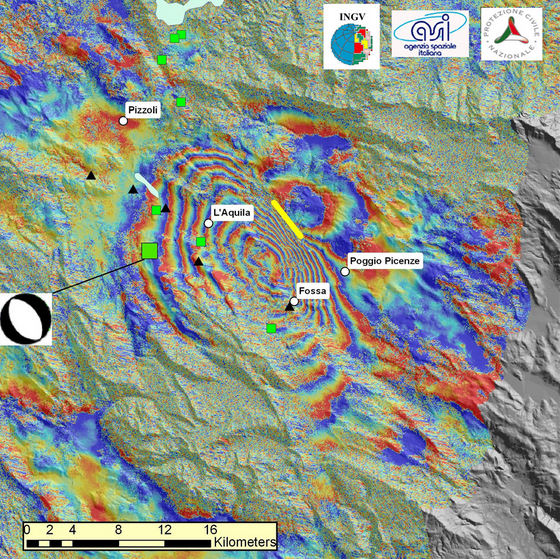
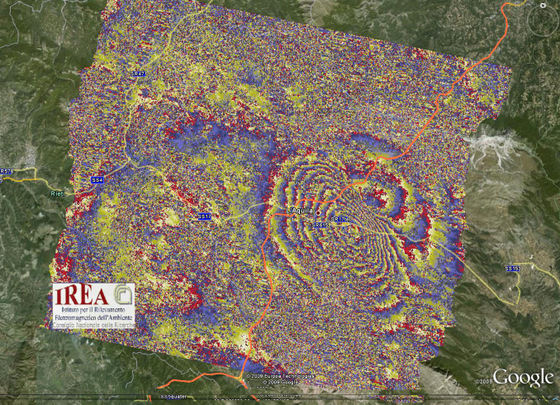
[/caption]
If you have ever experienced an earthquake, you know that the Earth literally moves beneath your feet. And now there’s satellite data to show just how much. Scientists studying satellite radar data from ESA’s Envisat and the Italian Space Agency’s COSMO-SkyMed, have been able analyze the movement of Earth during and after a recent earthquake in central Italy. A 6.3 earthquake shook the town of L’Aquila in on April 6, 2009, and satellite data is being used to map surface deformation in the Earth that took place after the quake and the numerous aftershocks that followed.
Using Synthetic Aperture Radar (SAR) data from these satellites, scientists took two or more radar images of the same ground location and compared them. The data is precise enough to show the differences in a scale of a few millimeters between images taken before and after the quake
Combining the before and after data, the scientists created ‘interferogram’ images that appear as rainbow-colored interference patterns. A complete set of colored bands, called ‘fringes’, represents ground movement relative to the spacecraft of half a wavelength, which is 2.8 cm in the case of the Envisat.
The Envisat interferogram shows nine fringes surrounding an area where the ground moved as much as 25 cm (along a line between the satellite’s orbital position and the earthquake area).

“By using available 3D ground displacements from five GPS location sites around the affected area, we were able to confirm the preliminary results obtained with Envisat data,” said Stefano Salvi from INGV’s Earthquake Remote Sensing Group.
The COSMO-SkyMed , which is a constellation of three satellites, can provide more frequent data. This means new interferograms can be calculated every few days.
The COSMO-SkyMed data together with the Envisat data and possibly radar data from other satellites will ensure a dense sampling of the ground deformation around the L’Aquila area in the next months, which could make this earthquake one of the most covered by SAR Interferometry measurements.
To ensure all scientists are able to contribute to the analysis of the earthquake, ESA is making its Earth observation dataset collected over the L’Aquila area freely accessible with an innovative fast data download mechanism. The dataset will be continuously updated with the newest Envisat acquisitions.
“We produced an interferogram just a few hours after the Envisat acquisition by combining these data with data acquired before the earthquake on 1 February. We were pleased that we were able to immediately see the pattern of the earthquake,” said Riccardo Lanari of IREA-CNR in Naples, Italy.
Source: ESA


Great to see SAR technology being used in a beneficial way. Also great to see ESA allowing free and immediate use of the data these missions collect. It’s fascinating to see these changes represented graphically. It makes for a new way for geologists to study earthquake dynamics. Thanks for the story, Nancy.
Wow. Molto stupefacente!
Now I wonder if SAR can be used to analyze tectonic movements on other worlds, namely Venus.
To Niki, The comments posted here are not without compassion for the terrible loss of life and the homeless in your beautiful country. .
That is just too cool! I worked on early ASARS back in the 80’s.. things sure have come a long way! FOR SURE it would be good to orbit similar instruments on Venus and Mars and Titan and… !
Totally cool!
This looks like pond ripples, after dropping a stone into the water, frozen in time. Just like what I imagined an earthquake might look like.
Totally cool?
Here in Italy was been less cool…I remember everybody that this quake kill 245people where the major part were College students,baby and young people. Finally,not less important, 6small town were razed to the ground like the capital Acquila. There are also over 30000 people without home and the 50% of the house are unusable.
But all this disaster is not totaly the result of quake,but bad building…
The quake of Umbria & Marche in 1998 had the same energy,but diffferent zone and building:only 11deads, where 4 died after the 1st quake,during a visit…
Can this technology be used to predict earthquakes? If we see deformation of the ground as stress builds in the fault zone, can this be used to forcast when and where an earthquake will strike. I suspect it would several years of data before forcasts could be made.
The saying “Earthquakes don’t kill people; buildings kill people” is doubly true here. The data gathered may help scientists down the long road, but what is really needed is better building practices in known earthquake zones. This area has been prone to earthquakes for centuries, as is Turkey, Afghanistan, and other countries in this region. Yet shoddy building practices continue, and because of this people will continue to be killed by buildings falling on them. It was seen in China in the last large earthquake and it was seen in the USA during one of the hurricanes that hit Florida, Hurricane Andrew, exposing shoddy building practices that caused widespread failure. This is what must be addressed so that in the future people are not killed by buildings failing.
Does anyone knows if the earth moved up or down?
Niki Says:
“Totally cool?
Here in Italy was been less cool…”
MY APOLOGIES – my comment was about the picture, the science ad the technology – not the earthquake.
I am also painfully aware of the problem with the bad building practices. I saw pictures of houses right next to each other – one a ruin, the other with not much more damage than broken windows and sagging roofs.
It’s great to see that satellites can help to study the effects of earthquakes. I live in a seismic zone (I’m peruvian) and 2 years ago there was an earthquake here, a powerful one. More than 500 people died and the city near the epycenter is still recovering from that quake.
I don’t think that we will be able to predict quakes in this century, but at least technology can help us to study its effects trying to minimize the casualties and the economic effects.
This data shows the Earth’s radius increasing.