[/caption]
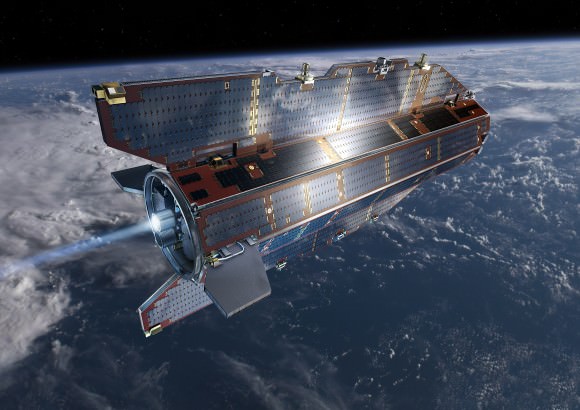
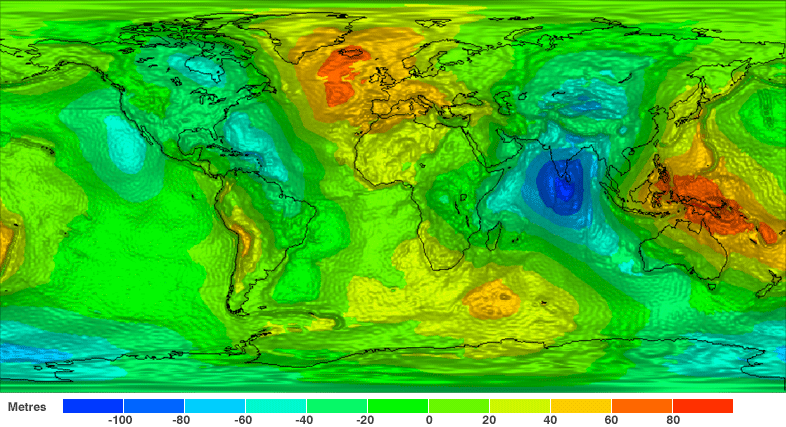
The sleek and sexy-looking GOCE satellite has provided a new, finely detailed look at Earth’s gravity – in high definition. This is the first-ever global gravity model and is based on just two months of data from the low-flying GOCE. “GOCE is delivering where it promised: in the fine spatial scales,” GOCE Mission Manager Rune Floberghagen said. “We have already been able to identify significant improvements in the high-resolution ‘geoid’, and the gravity model will improve as more data become available.”
GOCE stands for Gravity field and steady-state Ocean Circulation Explorer.
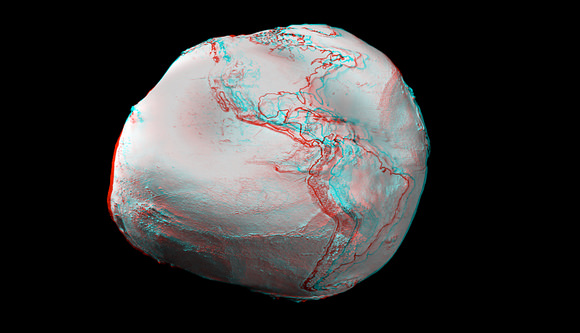
The geoid is a measure of the lumps and bumps in Earth’s gravity, and shows how the surface would look if an ocean covered the earth, also known as surface of equal gravitational attraction and mean sea level.
Scientists say it is a crucial reference for accurately measuring ocean circulation, sea-level change and ice dynamics – all affected by climate change.

The GOCE team presented their initial data at ESA’s Living Planet Symposium. ESA launched GOCE in March 2009, and the data is from November and December 2009.
“Over continents, and in particular in regions poorly mapped with terrestrial or airborne techniques, we can already conclude that GOCE is changing our understanding of the gravity field,” said Floberghagen. Over major parts of the oceans, the situation is even clearer, as the marine gravity field at high spatial resolution is for the first time independently determined by an instrument of such quality.”
This will greatly improve our knowledge and understanding of the Earth’s internal structure, and will be used as a much-improved reference for ocean and climate studies, including sea-level changes, oceanic circulation and ice caps dynamics survey. Numerous applications are expected in climatology, oceanography and geophysics.
“The computed global gravity field looks very promising. We can already see that important new information will be obtained for large areas of South America, Africa, Himalaya, South-East Asia and Antarctica,” said Prof. Reiner Rummel from Technische Universität München, Chairman of the GOCE Mission Advisory Group. “With each two-month cycle of data, the gravity model will become more detailed and accurate. I am convinced that the data will be of great interest to various disciplines of Earth sciences.”
The spacecraft can measure accelerations as small as 1 part in 10,000,000,000,000 of the gravity experienced on Earth.
GOCE flies in orbit at just 254.9 km (158 miles) mean altitude – the lowest orbit sustained over a long period by any Earth observation satellite, but the lower the altitude, the better the data.

The residual air at this low altitude causes the orbit of a standard satellite to decay very rapidly. So, to counteract the drag, the satellite fires an ion thruster using xenon gas, maintaining its orbit. This ensures the gravity sensors are flying as though they are in pure freefall, so they pick up only gravity readings and not the disturbing effects from other forces.
To obtain clean gravity readings, there can be no disturbances from moving parts, so the entire satellite is a single extremely sensitive measuring device.
The new map is just from the first data, and more information will be forthcoming. In May, ESA made available the first set of gravity gradients and ‘high-low satellite-to-satellite tracking’ to scientific and non-commercial users – and much more will come in the following months.


Ooh pretty picture! 🙂
So for real there’s less GRAVITY at the tip of the Indian subcontinent than there is on Iceland? I’m expecting an answer of “no of course not” but looking at this data map, how does one interpret it into the everyday world we experience?
With more sunspot activity observed GOCE honeymoon is likely over, it should need to go higher in a more voluminous atmosphere for the same drag and thus loose resolution. But it was nice timing while it lasted.
So it is the thinner more flexible ocean crust that better reflect mantle convection inhomogeneities, not the effects of the inflexibility in the more irregular continental plates? Who knew; or that islands like Island and Java would be the top of the geoid world? [Well, a geologists would know. But a layman goes “Ooh, pretty pictures!”]
This is a bit different than I was expecting. I figured there would be a marked difference at the equator vs the poles.
I will be intersted in watching this over the next couple of years to see how dynamic this is, and how it moves.. if it moves at all.
I would also like to see a version which tracks the Moon’s affect on our planet.
Does this mean that if I want to lose weight, I should move to Sri Lanka?
Bob,
I was thinking something along this line as well. As in… I would like to see a matrix displaying what a man who normally weighs so much in one town, weighs in various others… down to the milligram if necessary. This would give me a better idea of gauging the differences in gravity….rather than telling me how the Ocean’s would be…. if they were calm. I guess if they use the man thing, they better give us the weight, minus the air in the atmosphere pushing down on us.
@Bob In Maryland:
Yes, you would lose weight if you moved to Sri Lanka. Unfortunately, you would not lose mass, which is what I think you are really wanting.
Of course, exercise and a balanced diet would actually do the trick 😉
Way cool. Do I observe correctly that the two “high” points of Iceland and New Guinea are at roughly opposite ends of the globe? If so, I suspect that this tells us something about the mantle.
Notice how the gravity anomaly(s) resemble impact craters in the Analglyph image. Jah-jah?
The ‘anomaly’ over the Hudson Bay from an asteroid, comet or ‘mirror matter’ object some 12,500 years ago?
IV3Man@Lg….. my Duh. If I were perfect, my wages would be infinite.
@Aqua,
The correct spelling is Anaglyph, not “Analglyph”! 😛 😆
Incessant pattern matching is meaningless and irritating to boot on a science blog.
– Look at the map. No, I mean really look at it. There are plenty of low level geoid associated with the edges of continental plates, three of them with North America alone. So no anomaly.
“When Earth’s gravitational field was mapped starting in the 1960s a large region of below-average gravity was detected in the Hudson Bay region. This was initially thought to be a result of the crust still being depressed from the weight of the Laurentide ice sheet during the most recent Ice Age, but more detailed observations taken by the GRACE satellite suggest that this effect cannot account for the entirety of the gravitational anomaly. It is thought that convection in the underlying mantle may be contributing. [Wikipedia]”
– “Mirror matter”; meaningless.
– “some 12,500 years ago”; meaningless.
“The Canadian shield is a physiographic division, consisting of five smaller physiographic provinces, the Laurentian Upland, Kazan Region, Davis, Hudson, and James.[1] The shield extends into the United States as the Adirondack Mountains (connected by the Frontenac Axis) and the Superior Upland. The Canadian Shield is U-shaped, but almost semi-circular, which yields an appearance of a warrior’s shield or a giant doughnut, and is a subsection of the Laurentia craton signifying the area of greatest glacial impact (scraping down to bare rock) creating the thin soils.
The Canadian Shield is a collage of Archean plates and accreted juvenile arc terranes and sedimentary basins of Proterozoic age that were progressively amalgamated during the interval 2.45 to 1.24 Ga, with the most substantial growth period occurring during the Trans-Hudson orogeny, between ca. 1.90 to 1.80 Ga. [Wikipedia]”
Hudson Bay is a feature that came about from contingent aggregation of Archean plates billions of years ago. It is _not_ an impact feature, and a few s of googling would have told you so.
If you like pattern matching because it is the equivalent of mental jerking off, you will find plenty of it splattered all over astrology blogs. Here it is unbecuming.
Sadly, the GOCE gravity-measuring satellite recently lost the use of one of it’s two on board computers but should be OK.
So as I understand all of the above, and placing it into an ‘extreme’ aspect for comparison, is this correct then:
Referencing Cosmology’s space-time theory, does this mean a clock will tick slower in Iceland than a clock in India?
If gravity slowly makes a physical body ‘shrink in height’ over its lifetime as it endlessly pulls on the physical frame, then people in Iceland would be shorter in height overall compared to India? Will Icelanders’ have shorter lifespans due to the effects of gravity?
I’m a neutral and equal opportunity critic, so…
@Torbjörn Larsson OM,
The correct spelling is unbecoming, not “unbecuming”! 😛
Personally, I like the Pepperidge Farm Goldfish at the Southern tip of Africa. All he needs is the little smile 🙂
You may be referring to A.E.’s theory of General Relativity from which you can predict time dilation in that clocks closer to a massive object will seem to tick more slowly than identical clocks located further away.
Taking GPS satellites as a practical example, atomic clocks on the satellites appear, when viewed from the surface of the Earth, to be ticking[sic] faster than identical ground-based clocks by about 45 microseconds per day or roughly half a second per thirty years.
Since the difference in gravity measured at Iceland and India is many times smaller than the difference in gravity measured at GPS orbit and Earth’s surface, time dilation between Iceland and India will be a lot less than half a second per thirty years and possibly half a second per many human life times. [Although time dilation might be handy for the quality of FIFA referee decisions if it were possible to remotely host the next England versus Germany football match in the vicinity of some type of compact star.]
Love that lumpy potato Earth!
Could we get an explanation of the “meters” unit on the horizontal axis?
BTW, I don’t appreciate the tone of anyone deprecating someone else just because they think their question is stupid.
I for one am just an amateur interested in the subject. Give us a break!
It doesn’t speak well at all for “experts” when they are so inexpert in common civility. I believe it was Neil Armstrong who once said, “No question is stupid that you don’t know the answer to.”
If you think the question is mis-guided, then say so with a dignified respect for the questioner. No one’s going to pay much attention to insults.
knealy
“Could we get an explanation of the “meters” unit on the horizontal axis?”
It is the distance from the average gravity field.
For example -100 meters would mean the gravity is the same 100 lower as the average gravity field at this height.
it is easier to write than to write
254.900 m
254.870 m
254.850 m
254.900 m
This is easier to notice
+0
-30
-50
-100