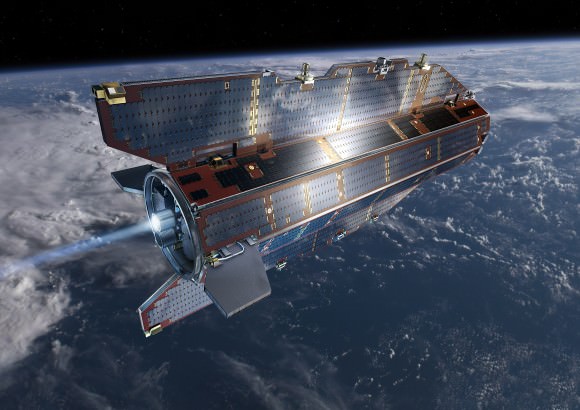
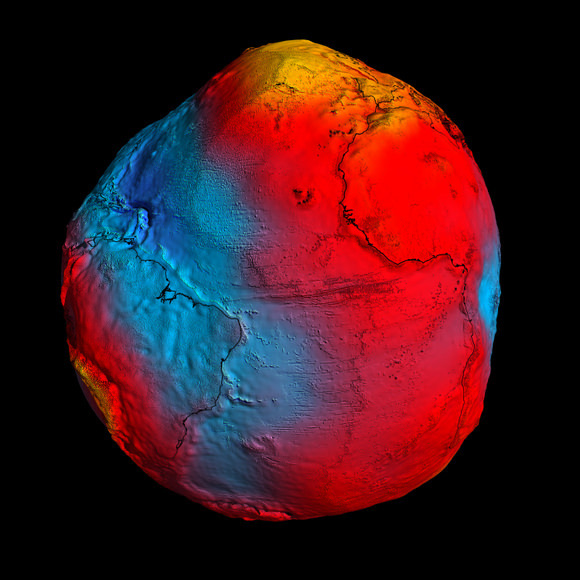
Although they aren’t particularly fond of the comparison, scientists from the GOCE satellite team had to admit that new data showing Earth’s gravity field – or geoid — makes our planet look like a rotating potato. After just two years in orbit, ESA’s sleek and sexy GOCE satellite (Gravity Field and Steady-State Ocean Circulation Explorer) has gathered sufficient data to map Earth’s gravity with unrivalled precision. While our world certainly doesn’t look like a spinning tuber, this exaggerated view shows the most accurate model of how gravity varies across the planet.
The geoid is nothing more than how the oceans would vary if there were no other forces besides gravity acting on our planet.
“If we had an homogeneous sphere, it would be a boring sphere,” said GOCE scientist Roland Pail from Technical University in Munich, speaking at the press briefing today. “But due to rotation, you get a flattening of the Earth, and we have topography such as mountains, and irregular mass distribution in Earth’s interior. What we are showing you here, in principle, is the gravity field by any deviations due to inhomogeneous mass distributions on the Earth and the Earth’s interior.”
[/caption]
While a previous gravity satellite, the Gravity Recovery And Climate Experiment (GRACE) operated for 8 years, most of the new data from GOCE was gathered in about 14 months, and provides data where there was none before.
GOCE is able to sense tiny variations in the pull of gravity over Earth, and the data is used to construct an idealized surface, which traces gravity lumps and bumps, and is the shape the oceans would take without winds, currents, Earth’s rotation and other forces.
By comparing sea level and geoid data, GOCE is revealing data on ocean currents and circulation, sea-level change, ice dynamics, said Rory Bingham, from the University of Newcastle, which helps understand heat transport and the changing climate.
But also of interest is how GOCE data reveals shifting tectonic plates in earthquakes and magma movements under volcanoes. Following the earthquakes in Japan, scientists are looking closely, as the data should reveal a three-dimensional view of what was going on inside the Earth. Even though the motion cannot be observed directly from space, earthquakes create signatures in gravity data, which could be used to understand the processes leading to these natural disasters and ultimately help to predict them.
“Even though these quakes resulted from big movements in the Earth, at the altitude of the satellite the signals are very small. But we should still seem them in the data,” said Dr. Johannes Bouman from the German Geodetic Research Institute.

“GOCE will give us dynamic topography and circulation patterns of the oceans with unprecedented quality and resolution,” said professor Reiner Rummel, former Head of the Institute for Astronomical and Physical Geodesy at the Technische Universität München. “I am confident that these results will help improve our understanding of the dynamics of world oceans.”
“You could say that, at its early conception, GOCE was more like science fiction,” said Volker Liebig, Director of ESA’s Earth Observation Program. “GOCE has now clearly demonstrated that it is a state-of-the-art mission.”
Sources: GOCE press briefing, ESA press release


I’m not overweight it’s just I live in a part of the world with a higher than average gravitational pull. Win.
Now I see why all those Brazilian models are so tall and lanky. Less gravity down there. 😉
And now one can see why Britain folks are stuck on their island: Gravity is much higher there than in the rest of Europe! 😀
How much of a difference does it make to be in a low vs high gravity area? Is this something measurable and does it effect how we standardize weights, the heights of oceans or air pressure? Or is the difference so small that it is meaningless on a day to day level?
For an “average” human being it is not really important. The difference is of the order of 1%. The average acceleration on earth’s surface is 9,81 m/s^2 and varies (IIRC) between 9,79 and 9,83 m/s^2.
For example: Even at the hight of the ISS (~300km) the gravity is not much less than on the surface
Doesn’t our planet rotate, and that means the gravity will differ with almost every passing moment in every diffrent location?
Yes, Earth rotates, but we rotate with it, so do not feel any difference in gravity. To measure a difference in gravity, you would have to move somewhere else on the surface.
Thanks learn something new each day!
This is one reason why it is hard to get data on the Lense-Thirring effect by a gyroscope around the Earth. The general relativistic effect is smaller than these local variations in the gravity field. It is necessary to place a gravity B type of gyroscope around a spacecraft that is parked in an orbit around Jupiter. Gas giants should have far less of this local variation in a gravity field.
LC
I’m confused. So sea level is not level? I know this view is exaggerated but by how much? I recall years ago reading that the Southern hemisphere was a bit larger than the Northern (by some odd miles). What is the scale of this exaggeration?
Correct, sea level is not everywhere at the same height.
Geoid:
“he geoid is that equipotential surface which would coincide exactly with the mean ocean surface of the Earth, if the oceans were in equilibrium, at rest (relative to the rotating Earth), and extended through the continents (such as with very narrow canals). […]
Although the physical Earth has excursions of +8,000 m (Mount Everest) and ?11,000 m (Mariana Trench), the geoid’s total variation is less than 200 m (?106 to +85 m)[2] compared to a perfect mathematical ellipsoid.”
So for sea level, obtain average. Then add local astronomical (tides), weather and climate effects for good measure.
“What are the facts? Again and again and again – what are the facts? Shun wishful thinking, ignore divine revelation, forget what “the stars fortell”, avoid opinion, care not what the neighbors think, never mind the unguessable “verdict of history” – what are the facts, and to how many decimal places? You pilot always into an unknown future; facts are your single clue. Get the facts!”
– Excerpt from the notebooks of Lazarus Long, by the ever so and sadly late Robert Heinlein.
In that spirit, I should clarity my question. Using the center of the Earth as a reference, does only know how much sea level will deviate from the average? Is it centmeters, meters, or kilometers?
You show by asking in this way that you understand SL is much like room temperature with respect to the room not being in a closed state, where it is subject to disturbances such as, gentle daylight heating of a wall, a door opening to bring warmer or colder air flow, shelving allowing a convection current to be disturbed and a local heat build-up and an eddy in the air mass.
For example the difference in SL at Cape Horn twixt the Atlantic and Pacific oceans; Sea level is about 20 cm higher on the Pacific side than the Atlantic since the water is less dense (on average) on the Pacific side and due in small part to the prevailing weather and ocean conditions.
Now this is answer not really to the question you ask, the answer to which I now address myself.
The earth is an ellipsoid spheroid (think pear) with an average center of mass conforming to the general shape described. The variance of the average center from a theoretical central point (as if the ellipsoid spheroid was a perfect sphere) is less than 1% (of the real life figure for the co-moving CoM) with a SD of .02. The figure for that difference can be as much as 1 meter (expressed at our view of sea level). This takes into account only those gross changes due to co-moving CoM with the moon’s elliptical orbit, minor changes in the force of gravity have little to no impact on this figure. These FoG deltas (force of gravity) are non-negligible of course but are truly of no importance when you also consider the density of the salt, the temperature, the forces exerted via torque from rotation and the corresponding reaction of any land mass to the moving water’s average SL near that shore at that time, the slow sinking of a tectonic plate vs the rising of another; truly these all together have such a great impact that in comparison to the force of gravity delta on sea level’s err, level, that it is much like the FoGgiest of ideas to imagine. -grin-
If my memory is correct that is. The actual figure is very small expressed as a delta for the two figures and it is interesting to note that the CoM area containing the theoretical central point can show a beautiful dance like oscillation over time as well as seemingly perturbed waves or fringes.
Mike C
Thanks, Mr. Mike but it seems that the Scientific American website that the easy answer to my question is a great article at http://www.scientificamerican.com/blog/post.cfm?id=the-geoid-why-a-map-of-earths-gravi-2011-04-01 which I shall quote in the name of fair use (education!)”
“The deviations of the geoid from the simplified, ellipsoidal model of the Earth are substantial: they range from 100 meters below (dark blue in the video) to 80 meters above (yellow), Rummel says.
The surface in the video is the geoid amplified by a factor 7,000, says GOCE mission manager Rune Floberghagen.”
It also mentions that both salinity variations as well as currents are a factor in the local sea level. And it talks about how some of the Drive-By media got this story SOOOO very wrong.
My admiration for the good work at this website reminds and is never ending! Both those with access to the source for the web sites and those who post. We truly live in the Golden Age of Astronomy!
As interesting as this topic is, I have to say the best fact I’ve learned from you guys’ discussion is that there is a person on this potato planet whose name is Rune Floberghagen.
HOW DID YOU ESCAPE FROM AZEROTH, MR. FLOBERGHAGEN???