The Sun has provided no shortage of mysteries thus far during solar cycle #24.
And perhaps the biggest news story that the Sun has generated recently is what it isn’t doing. As Universe Today recently reported, this cycle has been an especially weak one in terms of performance. The magnetic polarity flip signifying the peak of the solar maximum is just now upon us, as the current solar cycle #24 got off to a late start after a profound minimum in 2009…
Or is it?
Exciting new research out of the University of Michigan in Ann Arbor’s Department of Atmospheric, Oceanic and Space Sciences published in The Astrophysical Journal this past week suggests that we’re only looking at a portion of the puzzle when it comes to solar cycle activity.
Traditional models rely on the monthly averaged sunspot number. This number correlates a statistical estimation of the number of sunspots seen on the Earthward facing side of the Sun and has been in use since first proposed by Rudolf Wolf in 1848. That’s why you also hear the relative sunspot number sometimes referred to as the Wolf or Zürich Number.
But sunspot numbers may only tell one side of the story. In their recent paper titled Two Novel Parameters to Evaluate the Global Complexity of the Sun’s Magnetic Field and Track the Solar Cycle, researchers Liang Zhao, Enrico Landi and Sarah E. Gibson describe a fresh approach to model solar activity via looking at the 3-D dynamics heliospheric current sheet.

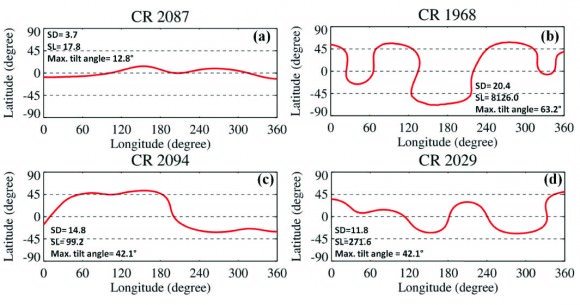
The heliospheric current sheet (or HCS) is the boundary of the Sun’s magnetic field separating the northern and southern polarity regions which extends out into the solar system. During the solar minimum, the sheet is almost flat and skirt-like. But during solar maximum, it’s tilted, wavy and complex.
Two variables, known as SD & SL were used by researchers in the study to produce a measurement that can characterize the 3-D complexity of the HCS. “SD is the standard deviation of the latitudes of the HCS’s position on each of the Carrington maps of the solar surface, which basically tells us how far away the HCS is distributed from the equator. And SL is the integral of the slope of HCS on that map, which can tell us how wavy the HCS is on each of the map,” Liang Zhao told Universe Today.
Ground and space-based observations of the Sun’s magnetic field exploit a phenomenon known as the Zeeman Effect, which was first demonstrated during solar observations conducted by George Ellery Hale using his new fangled invention of the spectrohelioscope in 1908. For the recent study, researchers used data covering a period from 1975 through 2013 to characterize the HCS data available online from the Wilcox Solar Observatory.

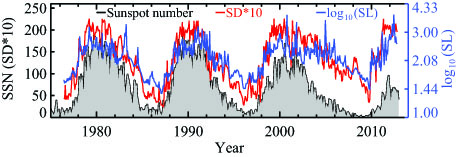
Comparing the HCS value against previous sunspot cycles yields some intriguing results. In particular, comparing the SD and SL values with the monthly sunspot number provide a “good fit” for the previous three solar cycles— right up until cycle #24.
“Looking at the HCS, we can see that the Sun began to act strange as early as 2003,” Zhao said. “This current cycle as characterized by the monthly sunspot number started a year late, but in terms of HCS values, the maximum of cycle #24 occurred right on time, with a first peak in late 2011.”
“Scientists believe there will be two peaks in the sunspot number in this solar maximum as in the previous maximum (in ~2000 and ~2002),” Zhao continued, “since the Sun’s magnetic fields in the north and south hemispheres look asymmetric, and the north evolved faster than the south recently. But so far as I can see, the highest value of monthly-averaged sunspot number in this cycle 24 is still the one in the November 2011. So we can say the first peak of cycle 24 could be in November of 2011, since it is the highest monthly sunspot number so far in this cycle. If there is a second peak, we will see it sooner or later.”
The paper also notes that although cycle 24 is especially weak when compared to recent cycles, its range of activity is not unique when compared with solar cycles over the past 260 years.

The HCS value characterizes the Sun over one complete Carrington Rotation of 27 days. This is an averaged value for the rotation of the Sun, as the poles rotate slower than the equatorial regions.
The approximately 22 year span of time that it takes for the poles to reverse back to the same polarity again is equal to two average 11 year sunspot cycles. The Sun’s magnetic field has been exceptionally asymmetric during this cycle, and as of this writing, the Sun has already finished its reversal of the north pole first.
This sort of asymmetry during an imminent pole reversal was first recorded during solar cycle 19, which spanned 1954-1964. Solar cycles are numbered starting from observations which began in 1749, just four decades after the end of the 70-year Maunder Minimum.
“This is an exciting time to study the magnetic field of the Sun, as we may be witnessing a return to a less-active type of cycle, more like those of 100 years ago,” NCAR/HAO senior scientist and co-author Sarah Gibson said.

But this time, an armada of space and ground-based observatories will scrutinize our host star like never before. The SOlar Heliospheric Observatory (SOHO) has already followed the Sun through the equivalent of one complete solar cycle— and it has now been joined in space by STEREO A & B, JAXA’s Hinode, ESA’s Proba-2 and NASA’s Solar Dynamics Observatory. NASA’s Interface Region Imaging Spectrograph (IRIS) was also launched earlier this year and has just recently opened for business.
Will there be a second peak following the magnetic polarity reversal of the Sun’s south pole, or is Cycle #24 about to “leave the building?” And will Cycle #25 be absent all together, as some researchers suggest? What role does the solar cycle play in the complex climate change puzzle? These next few years will prove to be exciting ones for solar science, as the predictive significance of HCS SD & SL values are put to the test… and that’s what good science is all about!
-Read the abstract with a link to the full paper in The Astrophysical Journal by University of Michigan researchers here.


Here is the information that is now slipping past the gatekeepers of information
http://theinternetpost.net/2013/08/12/the-creator-destroyer-sustainer-of-life/
Nice article. The Livingston and Penn index available from the NCAR guys is available at leif.org and points to a very weak cycle and a possible coming grand minima: http://www.leif.org/research/Livingston%20and%20Penn.png
Is this cycle already effecting the planet? Coldest summer on record in the Arctic, go through each summer at the Danish DMI site on temps above 80N: http://ocean.dmi.dk/arctic/meant80n.uk.php
Temps on the planet also not rising: http://www.metoffice.gov.uk/hadobs/hadcrut4/data/current/web_figures/hadcrut4_annual_global.png