As an amateur astronomer, two of the most frequently questions I’m asked are “When is the best time to see the aurora borealis and where is the best place?” In terms of place, two locations comes to mind: Churchill, Manitoba and Tromso, Norway. But until such time as the transporter is invented, most of us will be staying closer to home. The simple answer is north and the farther north the better.
As for the time, in the northern border states of the US, auroras occur fairly regularly around the time of solar maximum, when the sun peaks in storm activity. The current solar cycle tops out this summer and fall, so your chances at seeing northern lights are far better now than a year and a half ago when solar activity saw a steep decline during a protracted minimum.
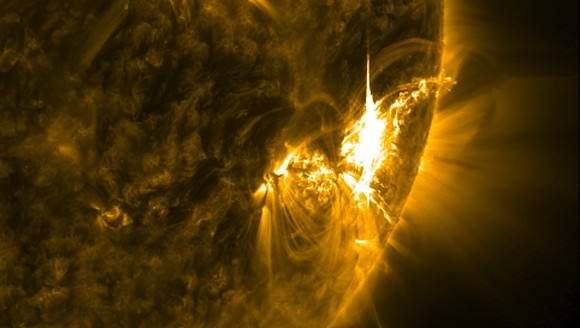
Explosive magnetic storms called flares on the sun’s surface propel a blizzard of high speed electrons and protons – disassembled hydrogen atoms in essence – into space in an event called a coronal mass ejection or CME. On any old day, the sun continually releases hot gases from its surface in the form of subatomic particles called the solar wind.
These tempests stream away from the sun at around 250 miles per second (400 km/sec), but during a CME, material can blast into space at more than 620 miles per second (1,000 km/sec). When the swarms arrive at Earth 1-3 days later, they can hook up with our planet’s own magnetic field. Follow the invisible magnetic field lines into the upper atmosphere the energetic electrons and protons spark a display of northern lights.
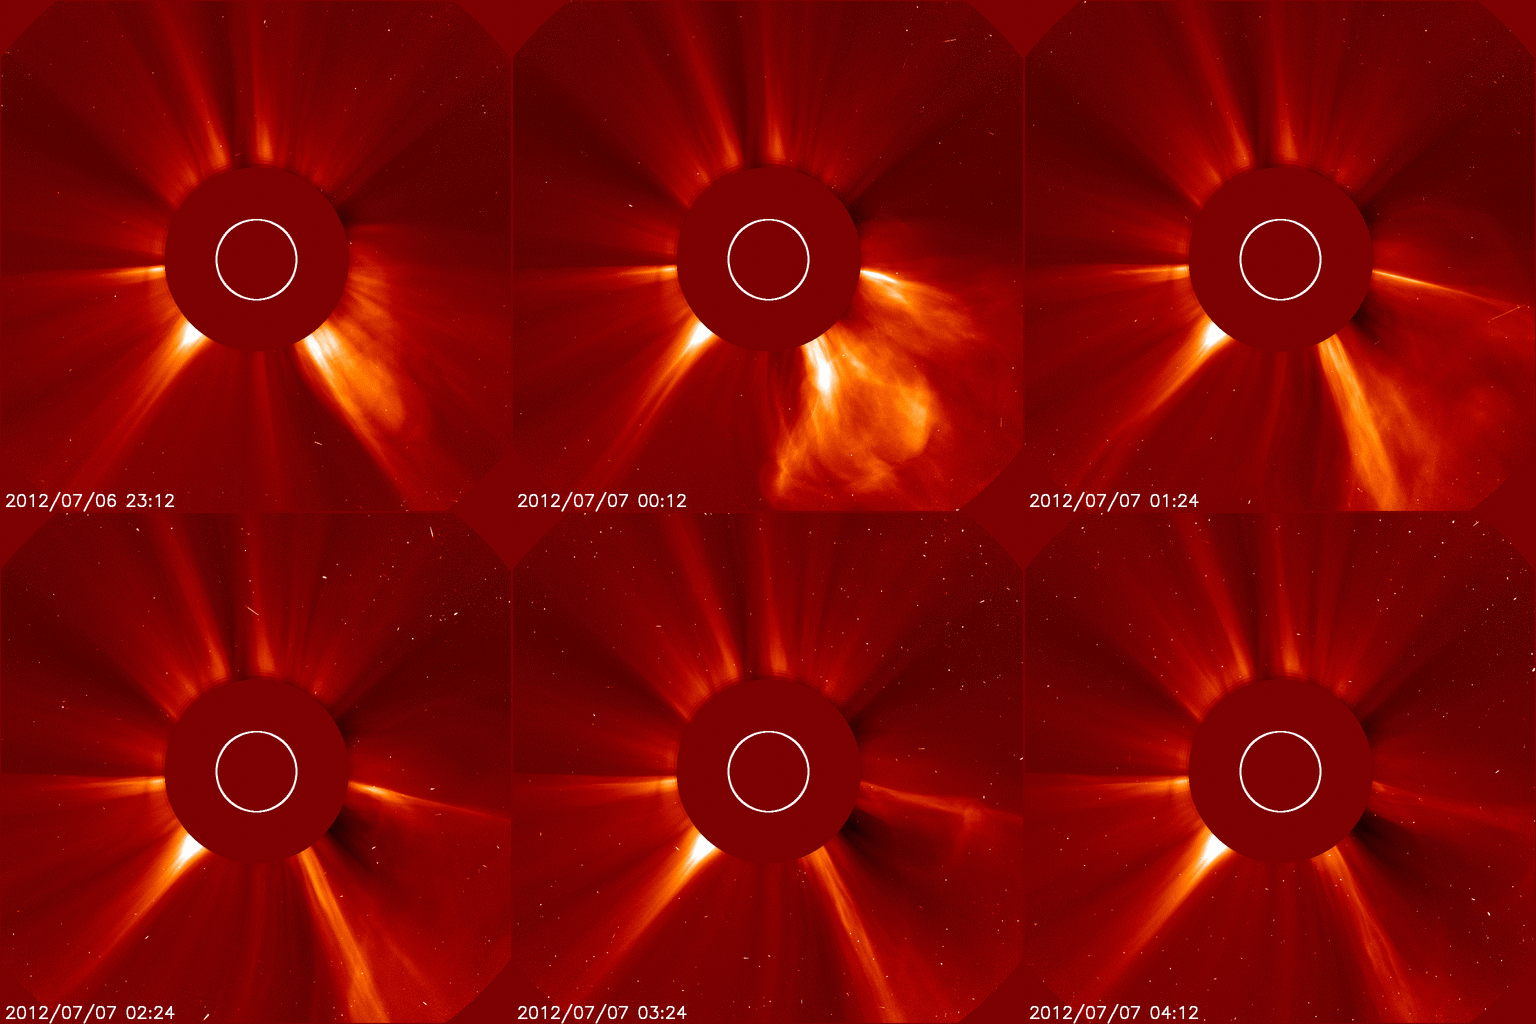
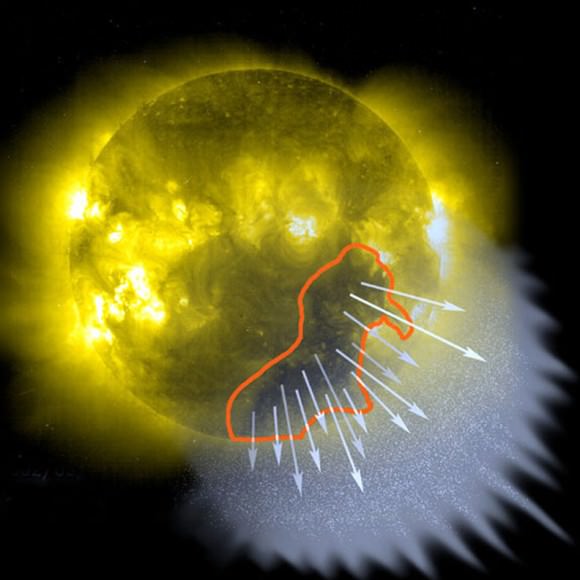
Solar goodies also exit via coronal holes. The sun is laced with magnetic fields that form closed loops across the surface, locking down particles that would otherwise escape. No so with coronal holes. These big gaping holes are regions in the sun’s corona where magnetic fields open freely into space; with no constraints, electrons and protons fly away at speeds up to 500 miles per second (800 km/sec).
With those aurora basics under our belt, let’s try our hand at forecasting. Since the aurora forms a ring centered on the geomagnetic poles rather than on the geographical north and south poles, your chances for spotting it improve if you’re closer to the geomagnetic pole. For instance, both Denver, Colo. and Madrid, Spain have nearly the same 40 degrees north latitude, but Denver’s in a much better location for an occasional auroral visit because the magnetic pole resides in Canada on the “North American side” of the globe.
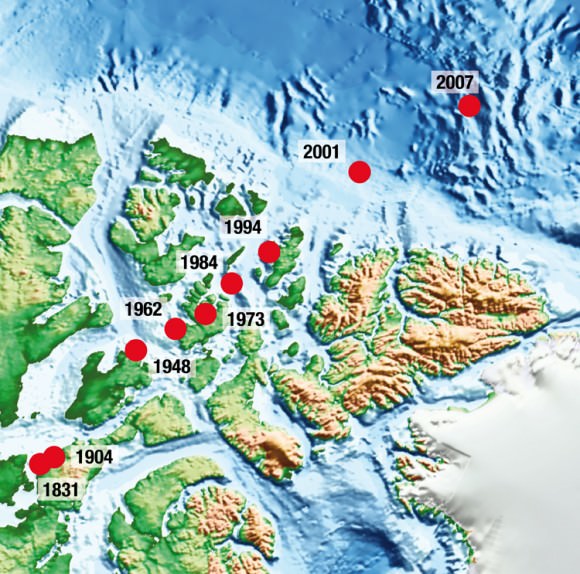
You can predict the likelihood of northern lights for your location by finding your magnetic latitude. This is much like your regular latitude but as it relates to the geomagnetic pole instead of the geographic pole. Returning to our example, the magnetic latitude of Madrid is 33 degrees while that of Denver is 48. As far as the aurora is concerned, Denver’s much farther north and in a better position to see a display.
Aurora prognosticators also use several indices happily available on the Internet to ordinary citizens like you and me. The estimated 3-hour Kp index is one of my favorites and easy to use.
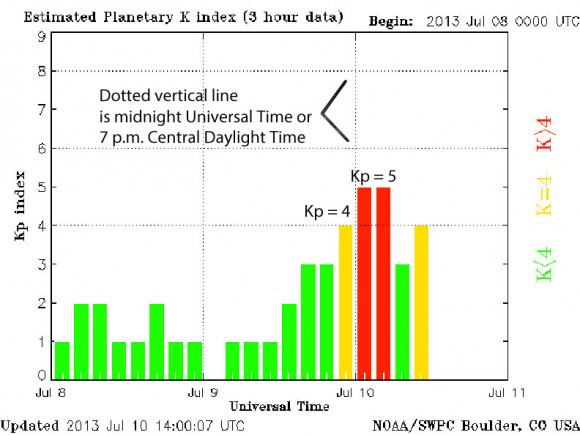
The Kp-index is a number that measures the likelihood of witnessing an aurora, and it’s determined by a grid of nine magnetometers set up around North America. Magnetometers measure the strength and direction of magnetic fields just like the ones we’re familiar with from playing with magnets. The aurora produces changes in the Earth’s magnetic field that are picked up by these magnetometers, which are relayed to NOAA and used to forecast current and upcoming activity.

For Duluth, Minn., the Kp-index only has to register “4” for the possibility of aurora. The further south you go, the higher the index has to be for aurora to be likely. The index is plotted as a series of 3-hour-wide bars ranging in height from 0 to 9. They’re also color-coded, with green representing low probability of a storm up to red, which begins at level 5 and extends to the maximum level of 9.

The NOAA POES Auroral Activity is another regular on my bookmark list. There you can check the extent of the auroral ovals, those caps of glowing auroral light centered on the Earth’s north and south geomagnetic poles. If you see the orange-red edge of the oval close to, touching or spilling right over your location, grab your coat and survey the northern sky for any telltale auroral glows.
NOAA constantly updates the oval’s size and intensity based on data received from the Polar Orbiting Environmental Satellite (POES). A more recent entry into realtime graphic depictions of the aurora oval is NOAA’s OVATION Aurora site. Hands down, it’s the prettiest view of the current oval. Maps show both poles and even include a viewing line. Since the aurora is 60 to 140 miles high, it can be seen for some distance beyond the edge of the oval.
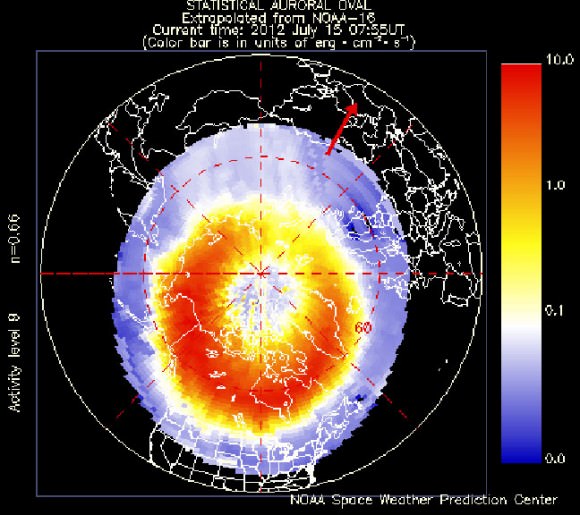
An activity index accompanies the POES oval. Rated from 1 to 10+, when the index climbs to “8”, chances are good for at least a little “green glow” in the northern sky across the Upper Midwest or across northern Europe. The level has to surge to “10+” for auroras to creep into Denver skies.
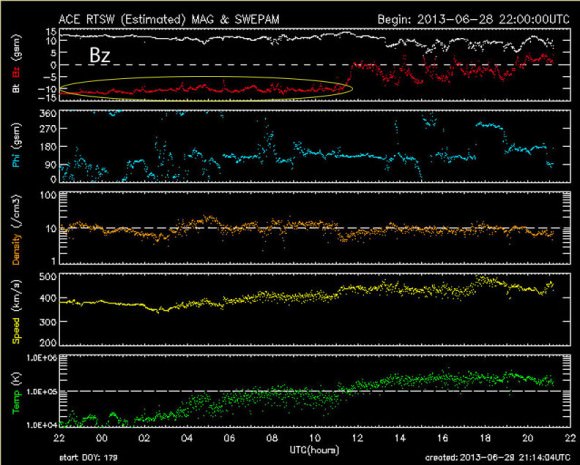
Finally, there’s the real-time data pouring in from the Advanced Composition Explorer (ACE) spacecraft located at the stable L1 Lagrange Point 1 million miles (1.6 million km) ahead of the Earth in the direction of the sun. ACE has nine instruments that detect and measure solar wind changes as well as particles beelining through the solar system from other locales within the Milky Way galaxy. ACE provides us with a one-hour advance warning of any geomagnetic (auroral) storms headed our way by detecting changes in the IMF or interplanetary magnetic field.
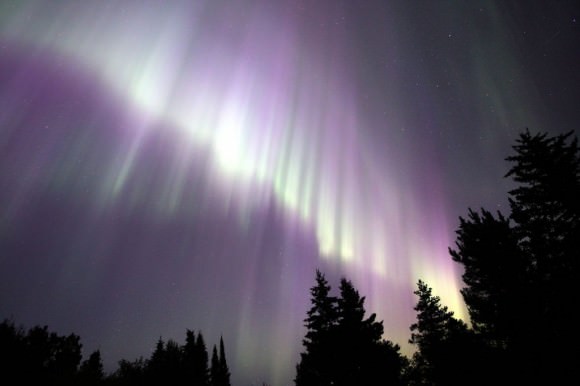
The IMF is a part of the sun’s magnetic field carried into interplanetary space by the solar wind, a high-speed outflow of subatomic particles, mostly electrons and protons. Scientists call this soup of charged particles a plasma. Because the sun rotates, solar plasma travels away from the sun in grand spirals much like water spraying from one of those rotating lawn sprinklers.
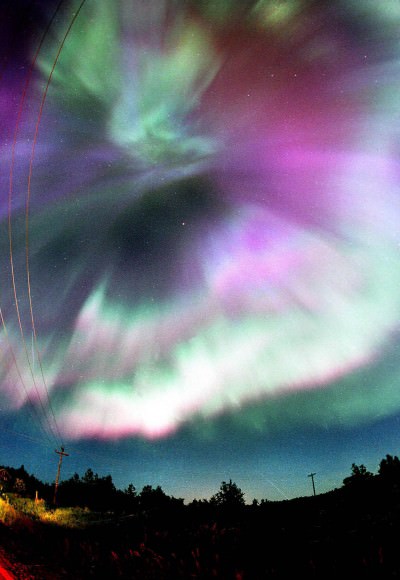
Embedded within the sun’s plasma swirls are portions of its magnetic field. As the IMF sweeps past Earth, it normally slides right by, deflected by our protective magnetic field, and no one’s worse for the wear. But when solar magnetic field points south – what’s called a southward Bz – it can hook up with Earth’s northward-pointing magnetic field. Once linked, the IMF dumps its baggage of high-speed particles into our atmosphere to light up the sky with aurora and set satellite operators on edge.
When the Bz turns south and drops to -10 or lower on the topmost graph on the ACE realtime data page, auroras are likely to kick in.
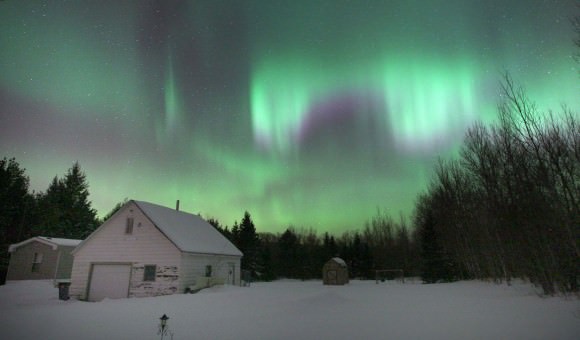
The space weather people have put together a very useful Aurora Tips page you can use to find your own magnetic latitude. A table and drop-down menu list a number of cities, but if you can’t find yours, click on one of the four Kp maps below and then click on your location to get your number. All the maps are also available on the Tips page:
* North America
* Eurasia
* South America and Eastern Pacific
* Africa-Indian Ocean-Australasia
With magnetic latitude in hand, you can now use the tables on the site to know at what level the POES and Kp indices need to reach for you to justify losing sleep for the northern lights. Bear in mind that all these methods are indicators only and don’t absolutely guarantee you will or won’t see northern lights. Other factors like moonlight, weather and nature’s unpredictability are always at play. I’ve been totally skunked on nights when the aurora was supposed to be inevitable. Other times, the lights have flared up unpredictably. If this all sounds familiar, it is. Space weather shares many of the same frustrations as forecasting weather on Earth.
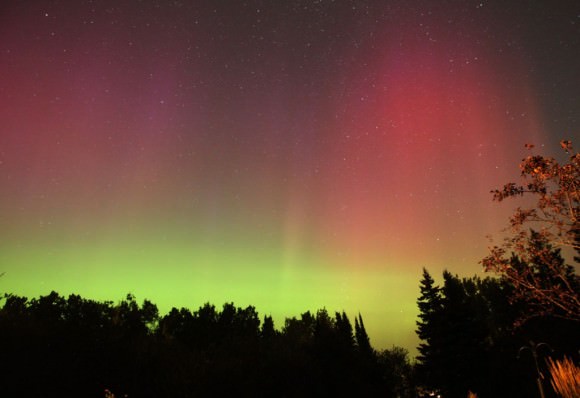
To summarize then, here’s my typical auroral forecasting routine:
1. Check the NOAA space weather forecast. If conditions call for a “minor storm” or better, I know auroras are possible for my location. Be aware that the dates listed are Universal or Greenwich Time. For example, if a minor storm is forecast for Aug. 20, that’s Aug. 19 during evening hours for the Midwestern U.S.
2. Check the Kp index. If it’s trending green (3 or lower), no need to get excited, but if a yellow or red bar appears, it’s time to pay attention. A Kp of “5” indicates a minor geomagnetic storm with auroras possible over far southern Canada and the northern U.S. “6” or “7”could mean a storm visible as far south as Kentucky and Missouri.
3. Click on the POES or Ovation map showing the extent of the auroral oval. If the oval extends down to southern Canada I start salivating because the northern U.S. is now within range.
4. Check the Bz on the topmost ACE graph. There’s nothing like seeing that it’s bottomed out at -10 or lower. Time now to go outside for a look!
5. Location is important. A place with a dark northern horizon is essential for seeing the early phases of the aurora when it’s often little more than a pale green arc 5-10 degrees high. If I suspect an auroral glow, I’ll take my camera and drive to a nearby spot with a wide open view to the north. Sometimes there are clouds in the north, but if they’re seen in silhouette, I know it’s from the aurora because no town lies in that direction.
Let’s cross our fingers the aurora will pay a visit soon. In the meantime you can bone up on your forecasting technique to get a jump on the next big show.


This hurts your european readers…
Yeah, ‘specially those in southern Europe…