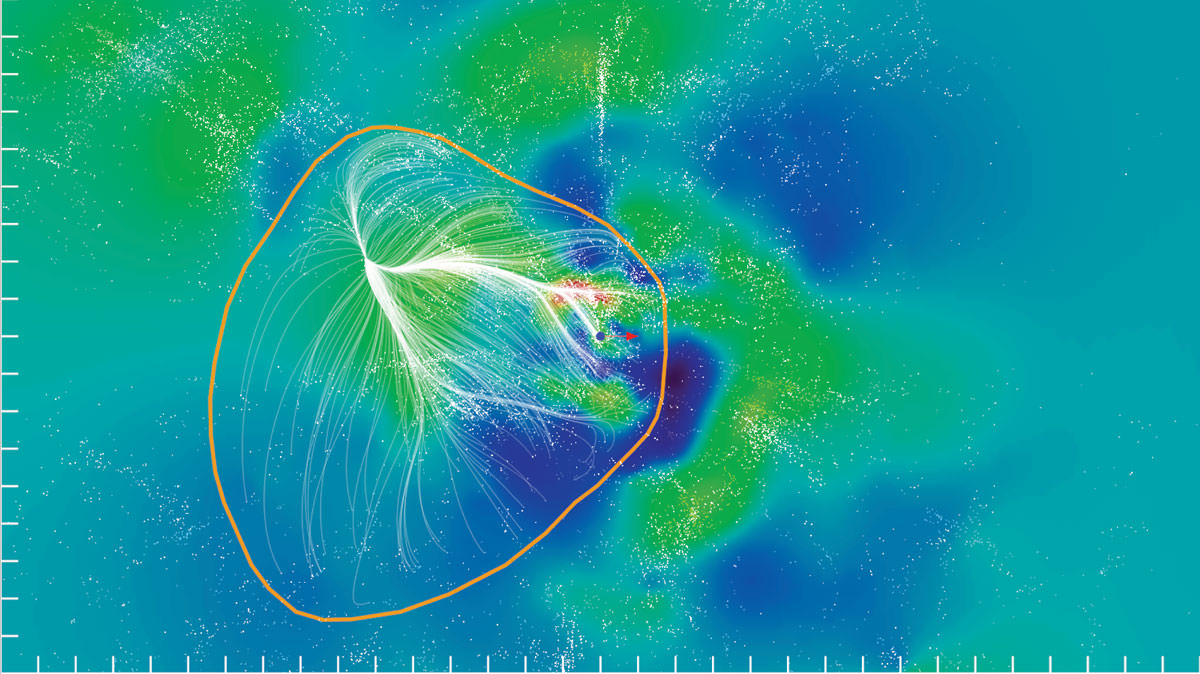
Our cosmic address extends well beyond Earth, past the Milky Way and toward the farthest reaches of the universe. But now astronomers are adding another line: the Laniakea Supercluster, which takes its name from the Hawaiin term “lani” meaning heaven and “akea” meaning spacious or immeasurable.
And the name is true to its meaning. The supercluster extends more than 500 million light-years and contains the mass of 100 quadrillion Suns in 100,000 large galaxies. This research is the first to trace our local supercluster on such a large scale.
“We have finally established the contours that define the supercluster of galaxies we can call home,” said lead researcher R. Brent Tully, from the University of Hawaii’s Institute for Astrophysics, in a news release. “This is not unlike finding out for the first time that your hometown is actually part of much larger country that borders other nations.”
Superclusters — aggregates of clusters of galaxies — rank among the largest structures in the universe. Although these structures are interconnected in a web of filaments, their exact outlines and boundaries are hard to define.
Large three-dimensional maps (think Sloan Digital Sky Survey) calculate a galaxy’s location based on its galactic redshift, the shifts in its spectrum due to its apparent motion as space itself expands. But Tully and colleagues used peculiar redshifts, the shifts in a galaxy’s spectrum due to the local gravitational landscape, instead.
In other words, the team is mapping the galaxies by examining their impact on the motions of other galaxies. A galaxy caught in the midst of multiple galaxies will find itself in a massive tug-of-war, where the balance of the surrounding gravitational forces will dictate its motion.
Typically this method is only viable for the local universe where the peculiar velocities are high enough compared with the expansion velocities, which increase with distance (a galaxy recedes faster the farther away it is). But Tully and colleagues used a new algorithm, which revealed the large-scale patterns created by galaxies’ motions.
Not only did this allow them to map our home supercluster, but to clarify the role of the Great Attractor, a dense region in the vicinity of Centaurus, Norma, and Hydra clusters that influences the motion of our Local Group and other groups of galaxies. They revealed that the Great Attractor is a large gravitational valley that draws all galaxies inward.
The team also discovered other structures, including a region named Shapley, toward which Laniakea is moving.
The findings have been published in the Sept. 4 issue of Nature.


Wonderful! (But I would love to see the use of powers of 10 rather than or in addition to (prefix)illion)
This is very noteworthy and interesting, but I do think the reporting lacks clarity. In the video, it’s not until 2:39 that they address how this new map of superclusters relates to the ones already in use; from the watcher’s POV, this information would have been better placed near the beginning.
“But Tully and colleagues used a new algorithm, which revealed the large-scale patterns created by galaxies’ motions.”
What kind of algorithm is used here? I couldn’t find any info. on the university page.
What does the green area represent in the image, if blue areas are voids, galaxies are white dots, and dense areas are red. What do the green areas consist of?