Since the early 20th century, scientists and physicists have been burdened with explaining how and why the Universe appears to be expanding at an accelerating rate. For decades, the most widely accepted explanation is that the cosmos is permeated by a mysterious force known as “dark energy”. In addition to being responsible for cosmic acceleration, this energy is also thought to comprise 68.3% of the universe’s non-visible mass.
Much like dark matter, the existence of this invisible force is based on observable phenomena and because it happens to fit with our current models of cosmology, and not direct evidence. Instead, scientists must rely on indirect observations, watching how fast cosmic objects (specifically Type Ia supernovae) recede from us as the universe expands.
This process would be extremely tedious for scientists – like those who work for the Dark Energy Survey (DES) – were it not for the new algorithms developed collaboratively by researchers at Lawrence Berkeley National Laboratory and UC Berkeley.
“Our algorithm can classify a detection of a supernova candidate in about 0.01 seconds, whereas an experienced human scanner can take several seconds,” said Danny Goldstein, a UC Berkeley graduate student who developed the code to automate the process of supernova discovery on DES images.
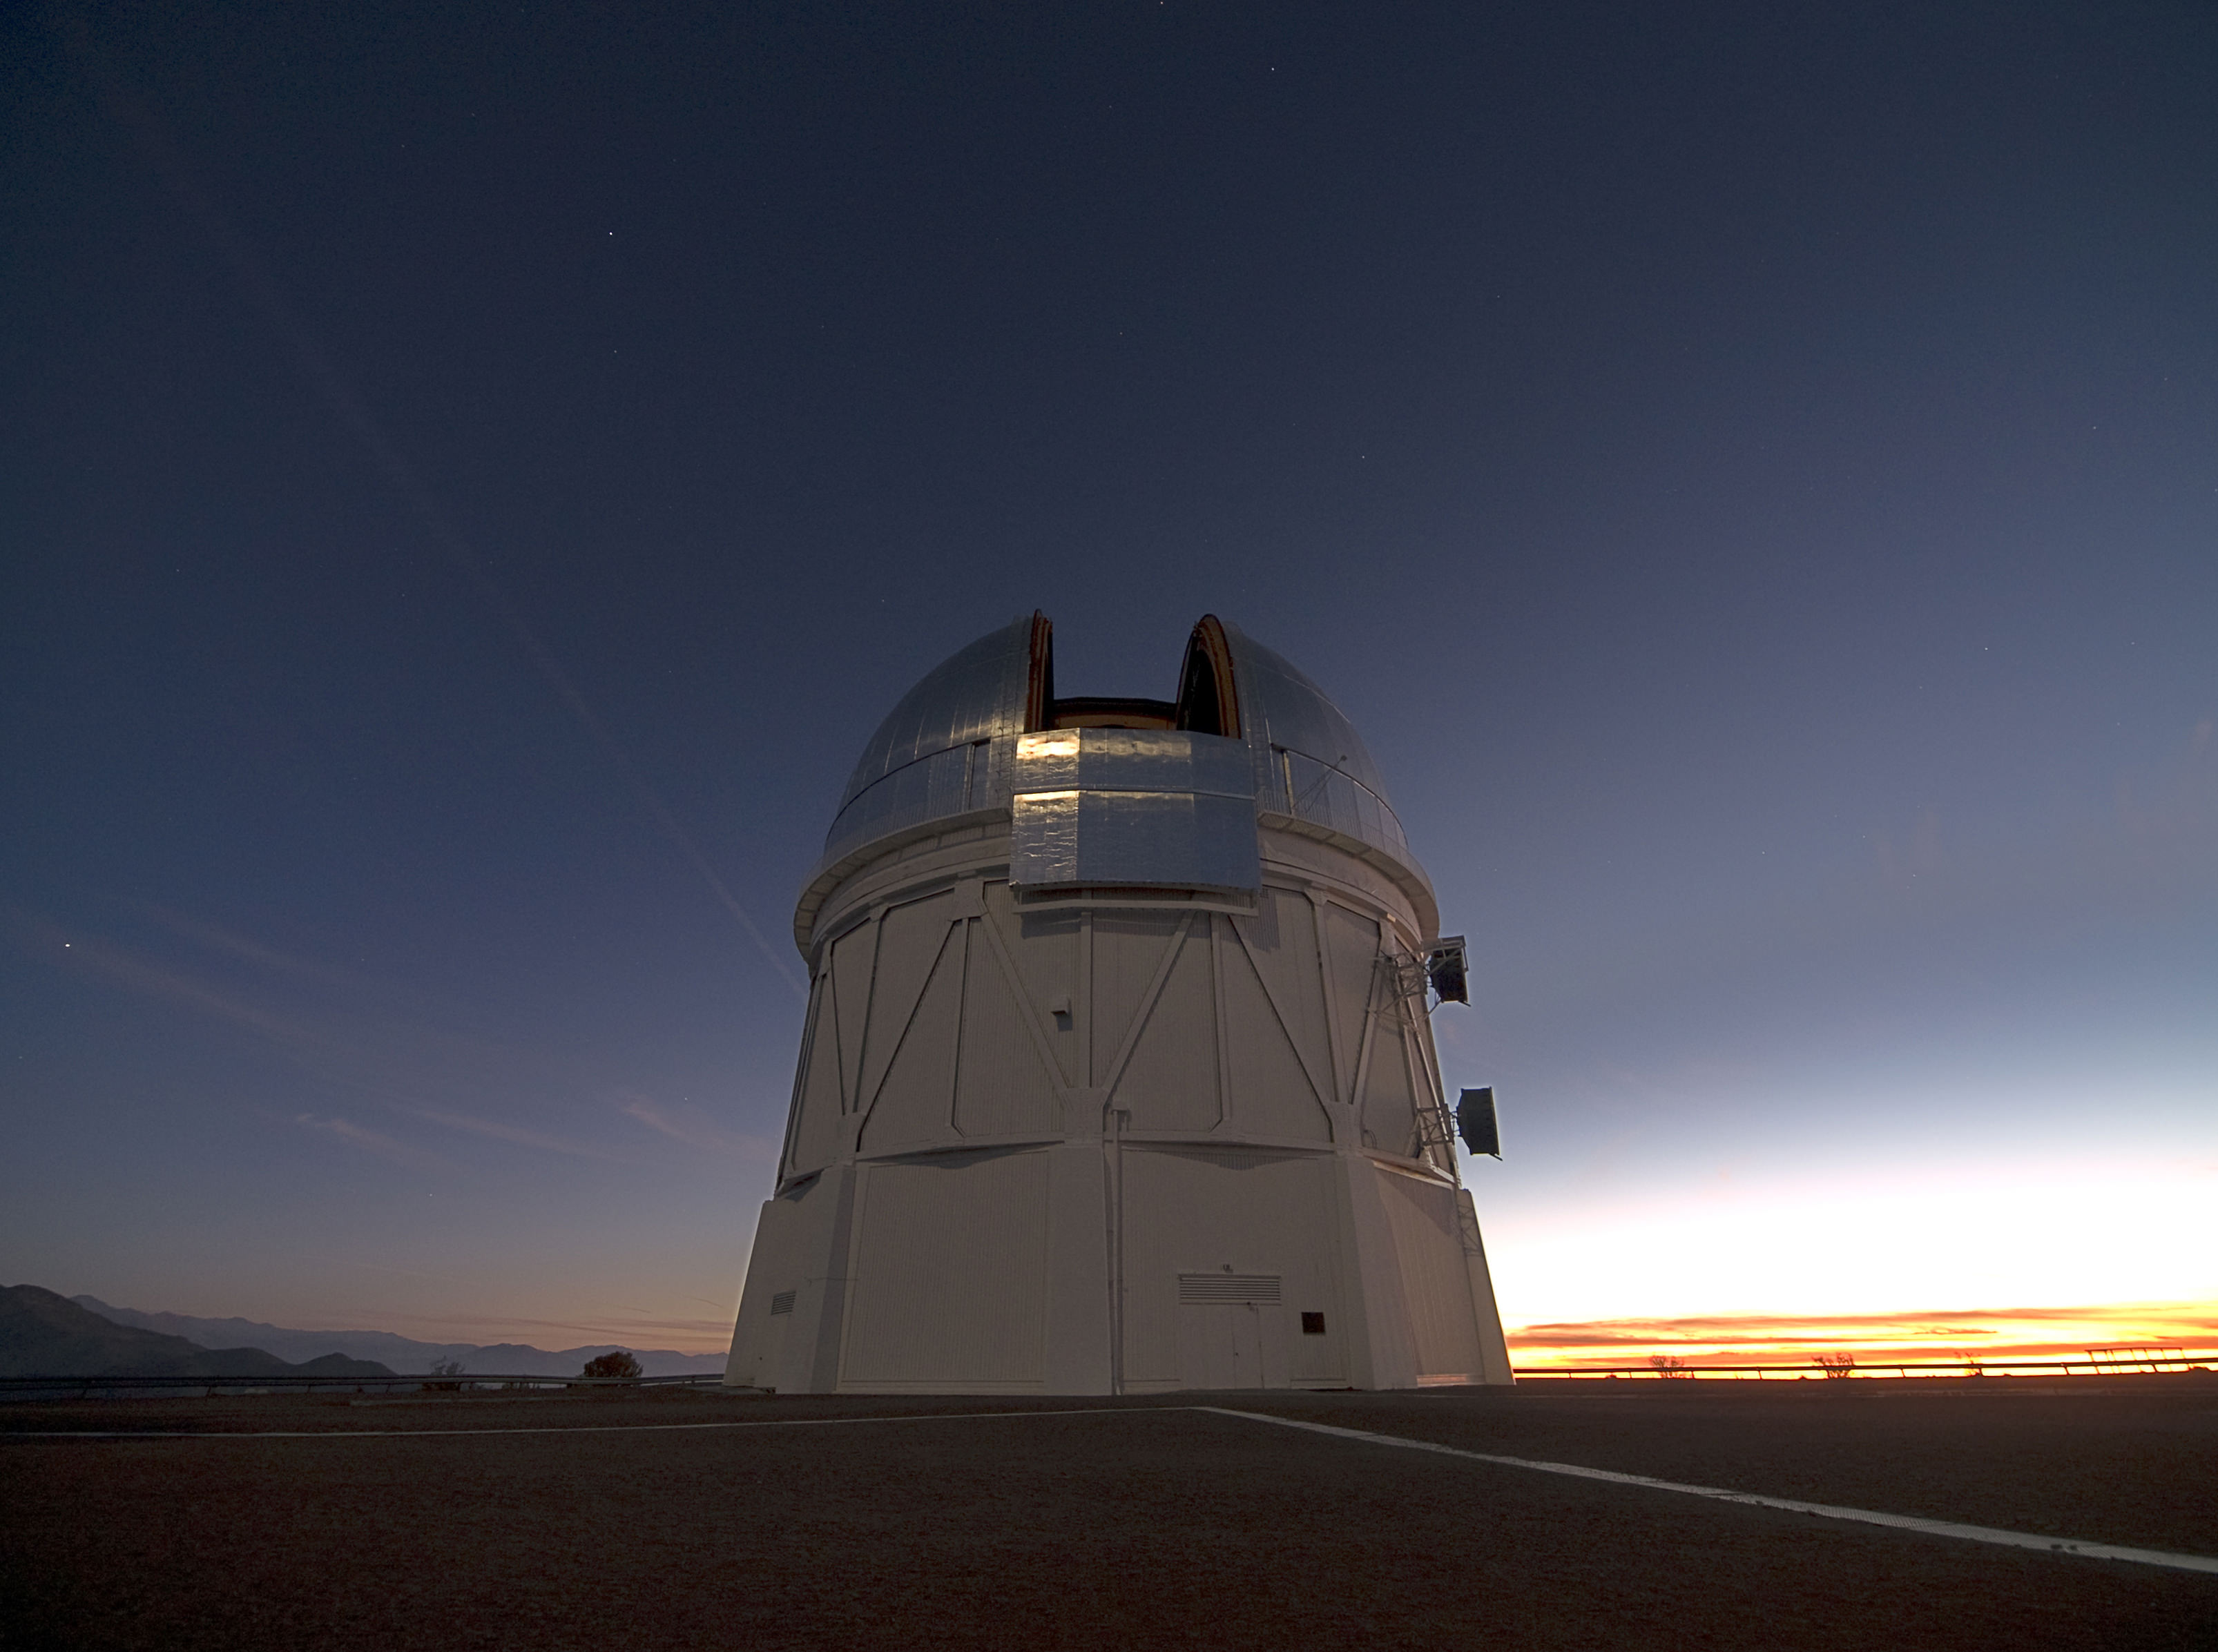
Currently in its second season, the DES takes nightly pictures of the Southern Sky with DECam – a 570-megapixel camera that is mounted on the Victor M. Blanco telescope at Cerro Tololo Interamerican Observatory (CTIO) in the Chilean Andes. Every night, the camera generates between 100 Gigabytes (GB) and 1 Terabyte (TB) of imaging data, which is sent to the National Center for Supercomputing Applications (NCSA) and DOE’s Fermilab in Illinois for initial processing and archiving.

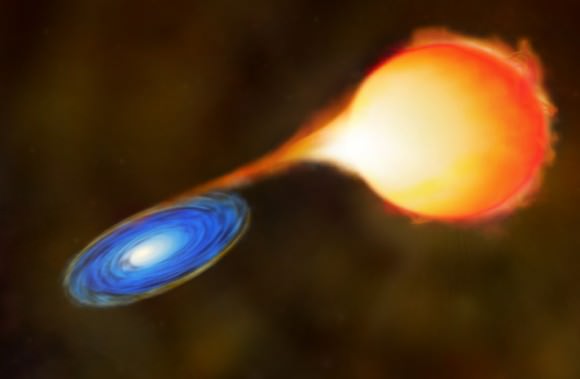
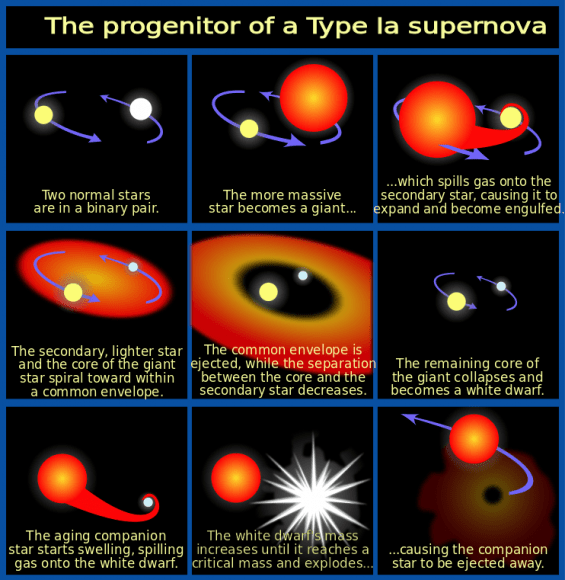
Object recognition programs developed at the National Energy Research Scientific Computing Center (NERSC) and implemented at NCSA then comb through the images in search of possible detections of Type Ia supernovae. These powerful explosions occur in binary star systems where one star is a white dwarf, which accretes material from a companion star until it reaches a critical mass and explodes in a Type Ia supernova.
“These explosions are remarkable because they can be used as cosmic distance indicators to within 3-10 percent accuracy,” says Goldstein.
Distance is important because the further away an object is located in space, the further back in time it is. By tracking Type Ia supernovae at different distances, researchers can measure cosmic expansion throughout the universe’s history. This allows them to put constraints on how fast the universe is expanding and maybe even provide other clues about the nature of dark energy.
“Scientifically, it’s a really exciting time because several groups around the world are trying to precisely measure Type Ia supernovae in order to constrain and understand the dark energy that is driving the accelerated expansion of the universe,” says Goldstein, who is also a student researcher in Berkeley Lab’s Computational Cosmology Center (C3).

The DES begins its search for Type Ia explosions by uncovering changes in the night sky, which is where the image subtraction pipeline developed and implemented by researchers in the DES supernova working group comes in. The pipeline subtracts images that contain known cosmic objects from new images that are exposed nightly at CTIO.
Each night, the pipeline produces between 10,000 and a few hundred thousand detections of supernova candidates that need to be validated.
“Historically, trained astronomers would sit at the computer for hours, look at these dots, and offer opinions about whether they had the characteristics of a supernova, or whether they were caused by spurious effects that masquerade as supernovae in the data. This process seems straightforward until you realize that the number of candidates that need to be classified each night is prohibitively large and only one in a few hundred is a real supernova of any type,” says Goldstein. “This process is extremely tedious and time-intensive. It also puts a lot of pressure on the supernova working group to process and scan data fast, which is hard work.”
To simplify the task of vetting candidates, Goldstein developed a code that uses the machine learning technique “Random Forest” to vet detections of supernova candidates automatically and in real-time to optimize them for the DES. The technique employs an ensemble of decision trees to automatically ask the types of questions that astronomers would typically consider when classifying supernova candidates.

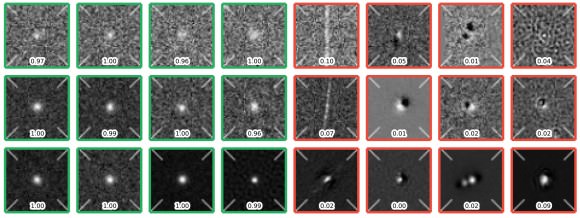
At the end of the process, each detection of a candidate is given a score based on the fraction of decision trees that considered it to have the characteristics of a detection of a supernova. The closer the classification score is to one, the stronger the candidate. Goldstein notes that in preliminary tests, the classification pipeline achieved 96 percent overall accuracy.
“When you do subtraction alone you get far too many ‘false-positives’ — instrumental or software artifacts that show up as potential supernova candidates — for humans to sift through,” says Rollin Thomas, of Berkeley Lab’s C3, who was Goldstein’s collaborator.
He notes that with the classifier, researchers can quickly and accurately strain out the artifacts from supernova candidates. “This means that instead of having 20 scientists from the supernova working group continually sift through thousands of candidates every night, you can just appoint one person to look at maybe few hundred strong candidates,” says Thomas. “This significantly speeds up our workflow and allows us to identify supernovae in real-time, which is crucial for conducting follow up observations.”
“Using about 60 cores on a supercomputer we can classify 200,000 detections in about 20 minutes, including time for database interaction and feature extraction.” says Goldstein.
Goldstein and Thomas note that the next step in this work is to add a second-level of machine learning to the pipeline to improve the classification accuracy. This extra layer would take into account how the object was classified in previous observations as it determines the probability that the candidate is “real.” The researchers and their colleagues are currently working on different approaches to achieve this capability.
Further Reading: Berkley Lab


Not convinced identifying SN1ae faster is going to make finding dark energy easier (not that I’m convinced dark energy is there to be found). This new technique should help quantify the acceleration of the Universe better – anything more is wild conjecture.
“…anything more is wild conjecture”, which is based firmly on, “(not that I’m convinced dark energy is there to be found)” The thinker seeks what the prover proves…
Dark energy is observed in the CMB peaks, besides being a firm component of inflationary cosmology. There is no remaining alternative, so what you are saying is that you rather not predict the observations with everyone else but throw up your hands based on personal incredulity. (Which is a fallacy, not a rational argument.) Besides, a useful, accepted theory can fundamentally not be “wild conjecture”, it has been through the wringer too many times for that.
“The first peak contains information about the total amount of stuff in the universe: ordinary matter, dark matter, photons, neutrinos, dark energy, and anything else we might not yet know about. The size and location of the peak is related to the geometry of the universe: how “flat” it is. Note that this peak covers areas of the sky much larger than the temperature fluctuations we’re seeing (the Sun is 0.5° on the sky!), so it’s not produced by sound waves in the early universe, but by the total energy driving expansion.
The second peak is the sound waves, and tells us exactly how much ordinary matter there is in the universe.
The third peak takes into account both the ordinary and dark matter. Combining this with the second peak therefore gives us the amount of dark matter.
So now we have it: by taking the three peaks together, we have the total amount of matter, the total amount of ordinary matter, and all the stuff together. Combining this data in different ways gives us the amount of dark matter (peaks 2 and 3) and dark energy (peaks 1 and 3).”
[ http://galileospendulum.org/2012/02/17/the-genome-of-the-universe/ ]
My problem is with the article, not with the exciting science. If and when I find a testable definition of distinguishing “direct” and “indirect” ways of making observational constraints, I will accept the idea as having merit besides the handwaving ‘I don’t like these derived constraints’. E.g. we have no way to observe properties except by tedious signal processing on interaction forces, even what we see is photons chemically detected and amplified and signal processed for pattern matching.
Interesting article, but I have a problem with the first paragraph. The accelerating expansion was discovered in the late 1990s, so it has been in the early 21st Century that people have been trying to explain it, not “Since the early 20th Century”. In the early 20th Century the big debate was whether the Milky Way was the entire shebang, or one “island universe” among many. Likewise, dark energy has not been the most widely accepted explanation for decades, unless you consider 15 or so years as “decades”.