
What’s up with the Sun? As we’ve said previous, what the Sun isn’t doing is the big news of 2018 in solar astronomy. Now, the Sun sent us another curveball this past weekend, with the strange tale of growing sunspot AR 2720.
We’re currently headed towards a solar minimum, forecasted to arrive in 2019 as the Sun switches over from Solar Cycle 24 to Solar Cycle 25. The Sun goes through 11-year cycles, during which solar activity increases and ebbs in a somewhat predictable fashion. Tracking this activity goes all the way back to the start of the first solar cycle in 1755. Today, simple sketching and counting of sunspot numbers has given way to ground and space-based operations that monitor the Sun around the clock.
As a technology dependent society, it’s important to know what the Sun is doing. Solar flares can spell a bad day for GPS, satellites, and astronauts currently in space. Even airline crew and passengers get a markedly higher dose of radiation during solar storms, especially during polar-crossing, trans-oceanic flights. And an event such as the 1859 Carrington Super-flare would wreak havoc today.
As it comes to a close, Solar Cycle 24 is now the most scrutinized period in solar astronomy… but it has been anything but normal. First, the transition period from Solar Cycle 24 to Solar Cycle 25 was deep and profound, the deepest in over a century. 2008 featured 268 spotless days, and when Cycle 24 finally arrived it was sputtering and lackluster at best, only producing a few notable sunspots.
Now, the transition from cycle 24 to 25 is on track to top that, with 132 spotless days on the Earthward face of Sol already as of August 29th or 55% of the time, leaving some solar astronomers to propose that if the trend continues, Solar Cycle #25 may be missing in action all together…
Or will it?
The growth of active sunspot region AR 2720 defied the overall trend for 2018 before it rotated around the solar limb and out of view, begging the question: has solar cycle #25 arrived? As a huge ball of gas, the Sun does not rotate uniformly, but instead, spins on its axis once every 34 days near its poles, and 25 days near the solar equator.
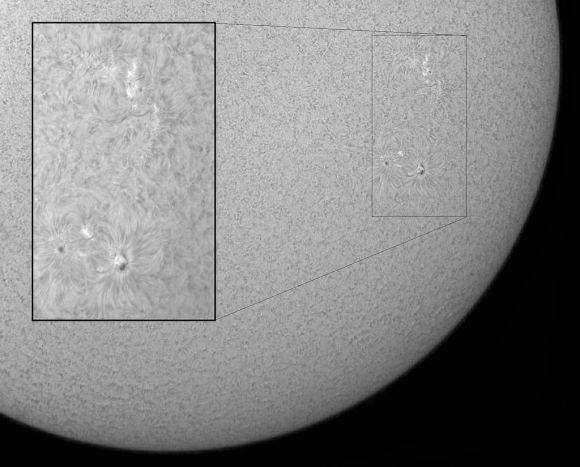
But how do we know that a new solar cycle has arrived, and that a given sunspot is a member?
Two factors come into play with identifying that a new solar cycle is indeed underway: the appearance of new sunspots at relatively high solar latitudes, and the reversal of the Sun’s magnetic field.
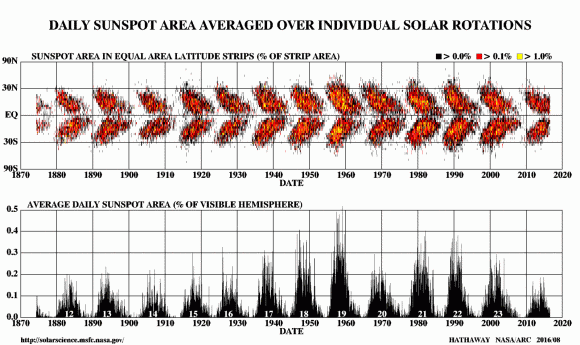
The first factor can be seen observationally in white light over the span of a solar cycle, and was first identified by Richard Carrington in 1861 and later refined by Gustav Spörer, in a law that now bears his name. Chart out the appearance of sunspots over time by latitude, Spörer noticed, and you get a tidy ‘butterfly graph’ depicting the 11-year solar cycle from minimum to maximum.
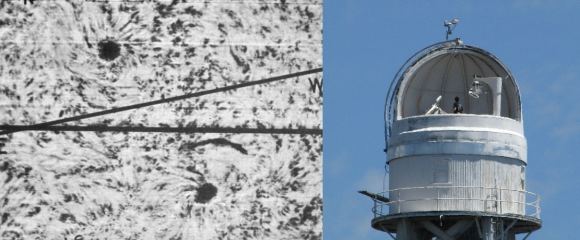
The second piece of the puzzle had to wait for the arrival of 20th century technology for astronomers to uncover it. It was known throughout the 19th century that there was a magnetic component to the Sun, as displayed by the electromagnetic havoc and enhanced auroral activity that solar storms could induce on Earth. In 1908, George Ellery Hale—a pioneer in American astronomy—used the newly installed 60-foot solar tower telescope at the Mount Wilson Observatory to note that spicule swirls around sunspot pairs rotated in opposite directions, much like metal fibers on a sheet of paper in the presence of a magnetic field in high school science class.
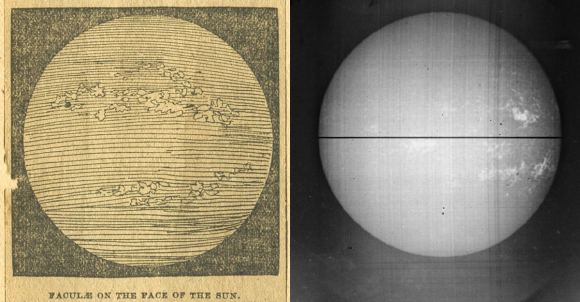
Hale used the 9-meter Littrow spectrograph attached to the solar tower telescope to exploit what’s known as the Zeeman effect—where a sunspot spectrum shows either a split or a broadening, evidence of its polarity—to deduce the magnetic field of the given spot. Hale showed that the Sun actually reverses its robust magnetic field every solar cycle, and the reversal period of 22 years whereas the same hemisphere returns to the same cycle is known as the Hale Cycle.
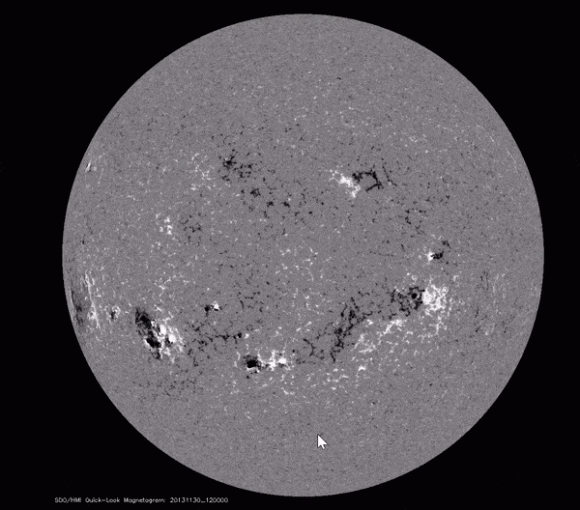
Likewise, sunspot pairs in the northern or southern hemisphere of the Sun show up as reversed in opposition to each other on magnetograms, showing spatial movement of the magnetic fields within the sunspot group, with one dark segment (south polarity, moving inward) and one bright segment (north polarity, moving outward). Remember that swirling action that Hale noted? Well, looking at the magnetogram of a given sunspot, you see either the bright spot leading or trailing the group versus solar rotation, and this flips when the Sun’s poles reverse every solar cycle.
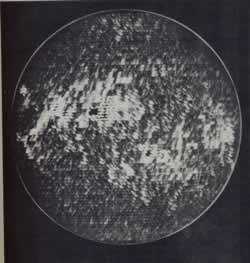
Horace Babcock built and installed the first true magnetogram imager on the 150-foot solar telescope on 1957, allowing him to take the first true magnetogram TV image of the Sun, which took the device about an hour to produce.
Today, you can see the very latest magnetogram image of the Sun with the flick of a smartphone, courtesy of the Solar Heliospheric Observatory (SOHO) and NASA’s Space Weather App.
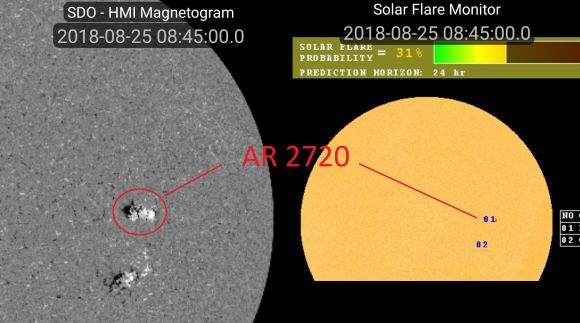
Which brings us back to the curious case of sunspot active region 2720. It was indeed showing a bright leading edge matching its southern counterpart (such mixing isn’t uncommon around the time the solar cycle flips) a strike in the ‘for’ category, but its latitude is still pretty low, a strike against. Another anomalous spot seen this past April also seems to have belonged to the next solar cycle.
One thing is for certain: the Sun is a fascinating subject of study, and will continue to surprise. Keep those solar filters handy, watch those magnetograms online, and we’ll see what AR 2720 does when it comes back ’round the solar limb in about 12 days.
(Our thanks to astronomer Karl Battams at the U.S. Naval Research Laboratory helping us explain the process of identifying a sunspot’s solar cycle membership!)

