Matter in the Universe is not distributed equally. It’s dominated by super-clusters and the filaments of matter that string them together, surrounded by huge voids. Galaxy super-clusters are at the top of the hierarchy. Inside those is everything else: galaxy groups and clusters, individual galaxies, and solar systems. This hierarchical structure is called the “Cosmic Web.”
But how and why did the Universe take this form?
A team of astronomers and computer scientists at University of California Santa Cruz took an interesting approach to figuring it out. They built a computer model based on the growth patterns of slime molds. This is not the first time that slime molds have helped explain other patterns in nature.
The team have published a study outlining their results titled “Revealing the Dark Threads of the Cosmic Web.” The lead author is Joseph Burchett, a postdoctoral researcher in astronomy and astrophysics at UC Santa Cruz. The study was published in The Astrophysical Journal Letters.
Modern cosmological theory predicts that matter will take the shape of these super-clusters and filaments, and the vast voids that separate them. But up until the 1980s, scientists thought that galaxy clusters were the largest structure, and they also thought that those clusters were distributed evenly throughout the Universe.

Then super-clusters were discovered. Then groups of quasars. On it went, with more and more discoveries of structures and voids. Then came the Sloan Digital Sky Survey and a huge 3D Map of the Universe, and other efforts like the Millennium Simulation.
The filaments of matter that connect all these super-clusters and groups of galaxies are difficult to see. For the most part, it’s just diffuse hydrogen. But astronomers have managed to catch glimpses of it.
Enter the slime mold. Slime molds are single-celled organisms that are perfectly fine living as single cells, but also autonomously form aggregate multi-cellular structures. When food is plentiful they act alone, but when food is more scarce, they band together. In the collective state they are better at detecting chemicals, finding food, and can even form stalks that produce spores.
Slime molds are remarkable creatures, and scientists have been puzzled and intrigued by the creature’s ability to “create optimal distribution networks and solve computationally difficult spatial organization problems,” as a press release says. In 2018, Japanese scientists reported that a slime mold was able to replicate the layout of Tokyo’s rail system.
Oskar Elek is a postdoctoral researcher in computational media at U of C, Santa Cruz. He suggested to lead author Joseph Burchett that slime molds may be able to mimic the cosmic distribution of matter and provide a way of visualizing it.
Burchett was skeptical, initially.
“That was kind of a Eureka moment, and I became convinced that the slime mold model was the way forward for us.”
Joseph Burchett, lead Author. U of C, Santa Cruz.
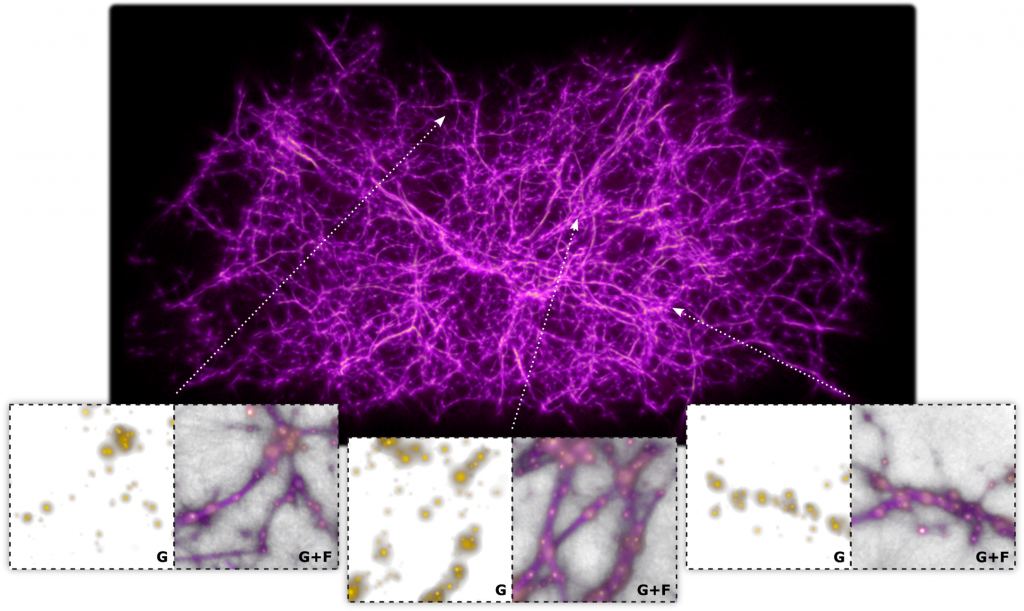
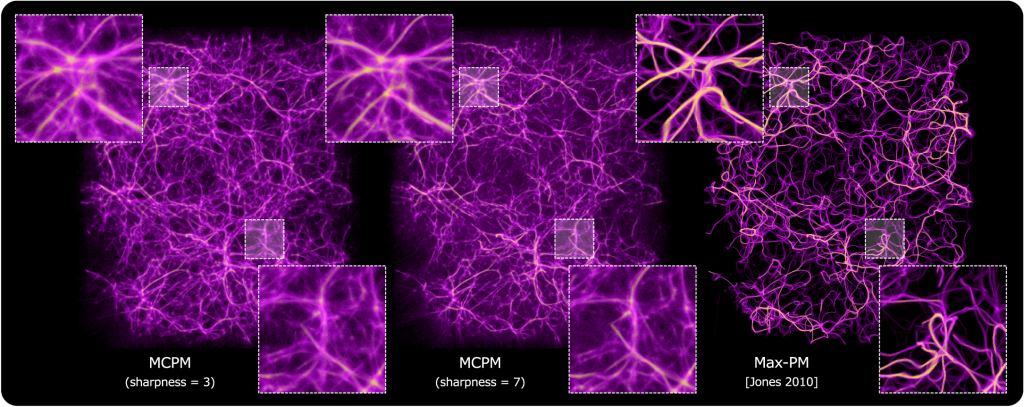
Drawing on 2-D inspiration from the art world, Elek and another programmer created a 3-D algorithm of slime mold behaviour that they call the Monte Carlo Physarum Machine. Physarum is a model organism used in all sorts of research.

Burchett decided to give Elek data from the Sloan Digital Sky Survey that contained 37,000 galaxies and their distribution in space. When they ran the slime mold algorithm, the result was “a pretty convincing representation of the cosmic web.”
“That was kind of a Eureka moment, and I became convinced that the slime mold model was the way forward for us,” Burchett said. “It’s somewhat coincidental that it works, but not entirely. A slime mold creates an optimized transport network, finding the most efficient pathways to connect food sources. In the cosmic web, the growth of structure produces networks that are also, in a sense, optimal. The underlying processes are different, but they produce mathematical structures that are analogous.”

But even though it’s compelling, the slime mold was just a visual representation of the large scale structure. The team didn’t stop there. They refined the algorithm and did additional tests to try to validate their model.
This is where Dark Matter enters the story. In one way, the large scale structure of the Universe is the large scale distribution of Dark Matter. Galaxies form in massive halos of Dark Matter, with long filamental structures connecting them. Dark Matter comprises about 85% of the matter in the Universe, and the gravitational pull of all that Dark Matter shapes the distribution of “regular” matter.
The team of researchers got hold of a catalogue of dark matter halos from another scientific simulation. Then they ran their slime-mold based algorithm with that data, to see if it could replicate the network of filaments connecting all those halos. The result was a very tight correlation with the original simulation.
“Starting with 450,000 dark matter halos, we can get an almost perfect fit to the density fields in the cosmological simulation,” Elek said in the press release.

The slime mold algorithm replicated the filamental network, and the researchers used those results to further fine-tune their algorithm.
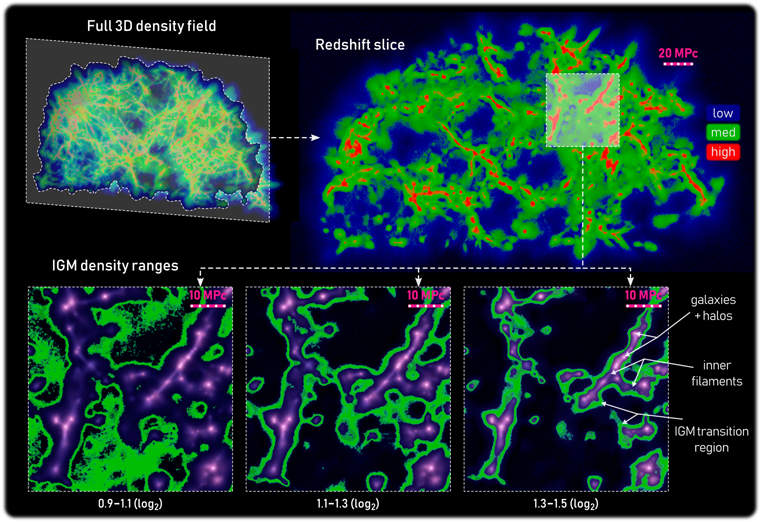
At that point, the team possessed a prediction of the structure of the large scale structure and the cosmic web connecting everything. The next step was to compare it to a different set of observational data. For this, they went to the venerable Hubble Space Telescope. That telescope’s Cosmic Origins Spectrograph (COS) studies the large scale structure of the Universe through spectroscopy of intergalactic gas. That gas doesn’t emit any light of its own, so spectroscopy is key. Rather than focus on the gas itself, the COS studies the light from distant quasars as it passes through the gas, and how the intergalactic gas affects that light.
“We knew where the filaments of the cosmic web should be thanks to the slime mold, so we could go to the archived Hubble spectra for the quasars that probe that space and look for the signatures of the gas,” Burchett explained. “Wherever we saw a filament in our model, the Hubble spectra showed a gas signal, and the signal got stronger toward the middle of filaments where the gas should be denser.”
That calls for another Eureka.

“For the first time now, we can quantify the density of the intergalactic medium from the remote outskirts of cosmic web filaments to the hot, dense interiors of galaxy clusters,” Burchett said. “These results not only confirm the structure of the cosmic web predicted by cosmological models, they also give us a way to improve our understanding of galaxy evolution by connecting it with the gas reservoirs out of which galaxies form.”
This study shows what can be accomplished when different researchers come out of their silos and cooperate through different disciplines. Cosmology, astronomy, computer programming, biology, and even art, all contributed to this most interesting outcome.
“I think there can be real opportunities when you integrate the arts into scientific research,” said co-author Angus Forbes from the UCSC Creative Coding lab. “Creative approaches to modeling and visualizing data can lead to new perspectives that help us make sense of complex systems.”

