Every day, there are more indications that show how anthropogenic factors are causing uncomfortable changes in our climate. Here in beautiful British Columbia, this means that wildfires are once again threatening countless acres of forests, communities, and wildlife. By the end of June 2021, more than 40 wildfires were raging across the province, including a rather substantial cluster around the town of Lytton.
Located just 150 km (about 93 mi) northeast of the city of Vancouver, Lytton, had to be evacuated on June 30th after an extreme heatwave led to wildfire sweeping through the area. These wildfires and the impact they were having at the time was being monitored by some of NASA’s Earth Observatory satellites. In a series of images recently shared on their website, they show the fires that were raging near Lytton just hours before the evacuation.
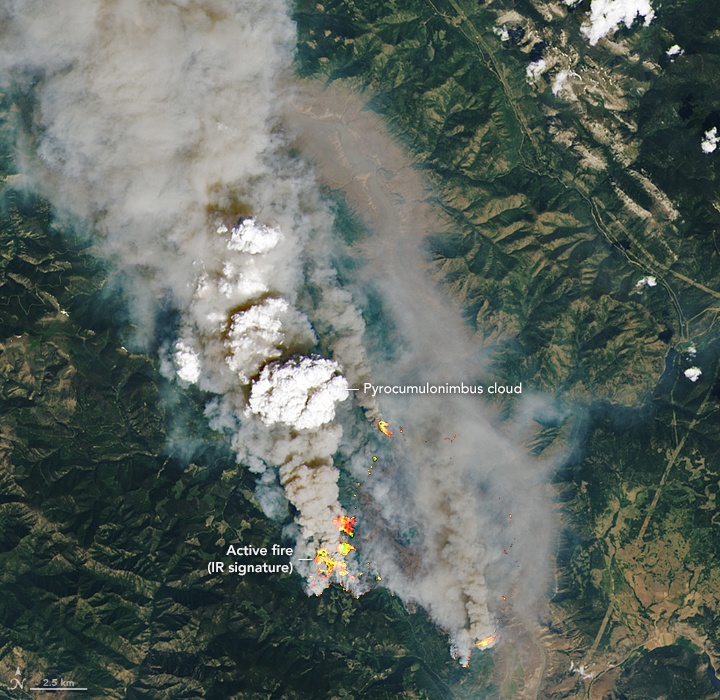
The satellites included the NOAA-20 satellite, which was launched as part of the Joint Polar Satellite System (JPSS) program mounted by NASA and the National Oceanic and Atmospheric Administration (NOAA). Using its Visible Infrared Imaging Radiometer Suite (VIIRS), the NOAA-20 acquired an image (shown below) of three fires that were burning around Lytoon at the time – 02:00 PM PDT (05:00 PM EDT) on June 30th.

These include the McKay Creek fire (left) and the Sparks Lake fire (right) that burned an estimated 150 – 200 km (60 – 75 mi) about 25 km (15.5 mi) north of Lillooett and 45 km (28 mi) northeast of Kamloops. The image also shows a smaller fire burning just 5 km (3 mi) south of Lytton, located in the vicinity of George Road. The images also show the different types of clouds that accompany these sorts of wildfires that occur in wooded areas.
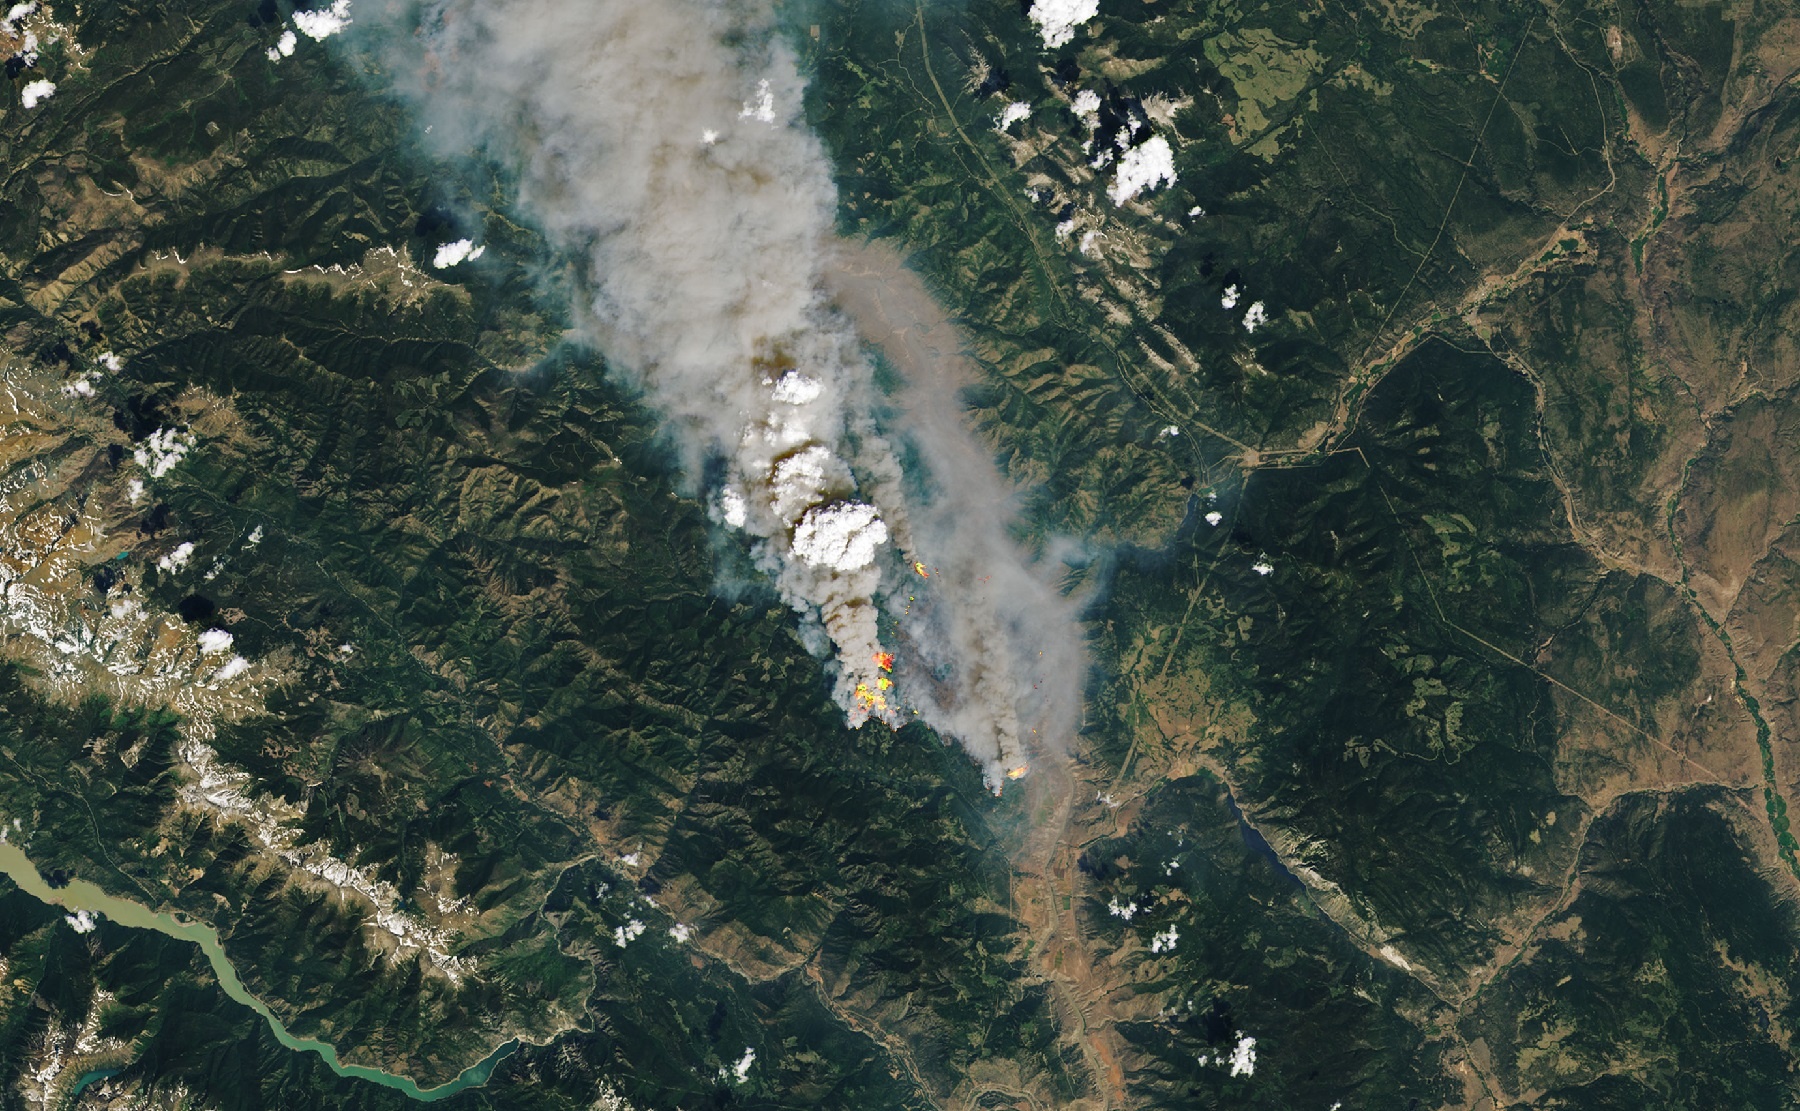
The second image (shown below) was acquired by the Operational Land Imager (OLI) on the Landsat 8 satellite, which was developed jointly by NASA and the U.S. Geological Survey (USGS). This image was taken at 12:00 PM PDT (03:00 PM EDT) and provides a more detailed look at the McKay Creek Fire and the contrast between pyroCbs clouds and dry smoke, as well as the fires driving them.
Whereas the clouds were imaged in natural color by the OLI, the flames were overlaid using shortwave infrared light data provided by the satellite’s Thermal Infrared Sensor (TIRS). The fires south of Lytton would eventually move north, prompting mayor Jan Polderman sign an official evacuation order at 06:00 PM PDT (09:00 PM EDT). The residents only received 15 minutes of advanced warning because the flames were being driven by winds of up to 71 km/h (44 mph).
About an hour later, the fires reached town and inflicted significant property damage and several injuries among the evacuating residents. The image captured by the NOAA-20 satellites also shows the different types of smoke produced by the wildfires. The bright white plumes, for example, are known as pyrocumulonimbus (pyroCb) clouds, which are caused by dry smoke and sublimated ice which then ascends due to convection and heat rising from the fires.

The darker plumes, visible to the west in the image, appear the way they do because they are composed of dry smoke created by dry burning foliage. While wildfires are a natural occurrence in the Pacific Northwest during the summer, their extent and intensity has been increasing. Michael Fromm, a meteorologist with the Naval Research Laboratory (NRL), indicates that this is a direct result of the recent heatwave that hit interior BC.
“The forests are vulnerable each summer, and big fires and pyroCbs have been seen there repeatedly,” he said, in a NASA EO press statement. “But there’s no doubt the extreme heat and substantial wind exacerbate the fire danger.”
The spate of fires occurred during a record-setting heatwave that was felt all across the Pacific Northwest and western Canada. A week before Lytton was evacuated, the town recorded the highest temperatures ever seen in Canada for three consecutive days. On Tuesday, June 22nd, temperatures peaked at 49.6 C (121 °F), the highest temperature ever recorded in Canada to date.
To illustrate this heatwave, NASA’s Earth Observatory also provided a map derived from the Goddard Earth Observing System (GEOS) model. The map depicts air temperature anomalies at 2 m (~6.5 ft) above the ground all across western Canada and the United States on June 29th, 2021. The darkest red areas correspond to regions where air temperatures were 20 °C (36 °F) higher than the average temperature recorded on June 29th every year between 2014 and 2020.

These wildfires and the temperature anomalies that preceded them illustrate the danger that anthropogenic climate change poses. As temperatures continue to rise, interior regions will continue to experience hotter, drier summers, resulting in increased drought and wildfires. Aside from making wildfires more likely, the loss of groundwater also makes the job of fighting and containing these fires more difficult.
At present, atmospheric carbon dioxide levels have reached 409.8 parts per million (ppm) and will continue to climb for the foreseeable future. This will mean that the current trend of hotter, drier summers and wetter, more extreme winters will continue. As the former threatens people’s lives and livelihoods with fires, droughts, and loss of arable land, the latter will do the same with floods, increased storm activity, and heavy rains that lead to topsoil erosion.
Earth Observation is vital to all of this, and not only because it allows scientists and climatologists to observe where and how our climate is changing. It’s also a crucial part of crisis management, where satellite imagery and data can provide advance warning and up-to-date monitoring of hazards. In these and many other ways, going to space helps us to be better caretakers of Earth.
Further Reading: NASA Earth Observatory

