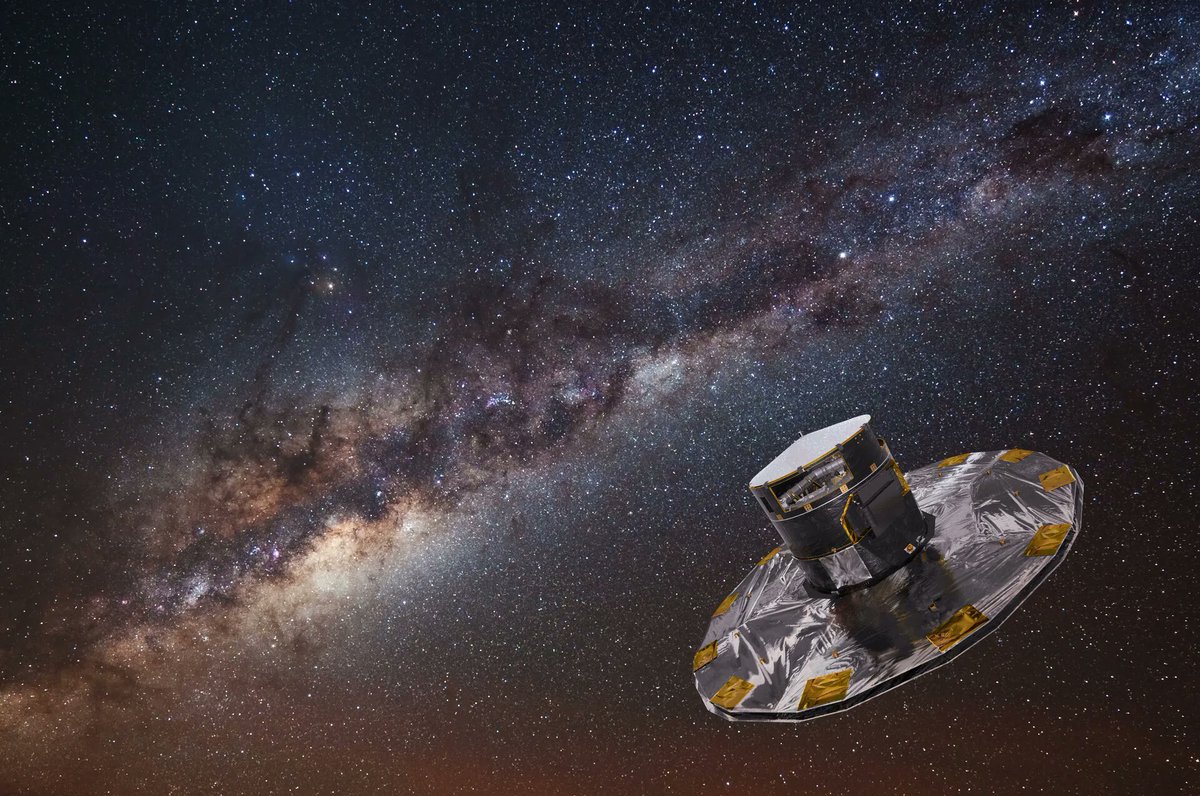
We’ve reported on Gaia’s incredible data-collection abilities in the past. Recently, it released DR3, its latest data set, with over 1.8 billion objects in it. That’s a lot of data to sift through, and one of the most effective ways to do so is through machine learning. A group of researchers did just that by using a supervised learning algorithm to classify a particular type of object found in the data set. The result is one of the world’s most comprehensive catalogs of the type of astronomical object known as variables.
By definition, variables change their brightness over time. And Gaia, which has been monitoring vast parts of the sky for long periods, is particularly adept at finding them. In fact, it found something on the order of 12.4 million variable sources, about 9 million of which were stars. The over 3 million or so were either active galactic nuclei or galaxies themselves. All of these objects had changes in their brightness at some point or another throughout Gaia’s observation of them.
Admittedly, 12.4 million out of 1.8 billion is only about .6% of the total observed objects in DR3. However, that is still a lot of data to work with, and they might hold information that astronomers would like to understand about what causes certain types of variability.
According to the researchers, those causes result in very different kinds of variability – 25 different kinds to be precise. Their paper, released on arXiv, includes categories such as pulsating, eclipsing, rotating, microlensing, and cataclysmic. That last one sounds exciting, and there are 7306 of them in the data set, though the brightness of these events varied widely even within individual categories.
To sort the 12.4 million objects into each of these categories, the researchers turned to one of the most useful algorithms to do just that – machine learning. In particular, they used a technique called “supervised classification.” Basically, that means they had a human help an AI algorithm identify features of a certain classification and then provided manual feedback on whether an object met the criteria for classification into that category.
Eventually, the algorithms could pick up on defining features of the different categories and sort objects that humans had never looked at into those categories relatively accurately. The specific features that define each category are also defined in the paper. For example, the cataclysmic variables have a higher level of variability probability than other objects in the data set.
Plenty of manual data massaging went into the final collection, though it was also discussed at length in the 105-page paper. However, there were some fundamental issues with how Gaia observes objects that could eliminate some potential variables from this collection. For example, Gaia doesn’t sample the whole sky all the time, so variables whose variability lasts less than a set amount of time might be missed if Gaia doesn’t happen to peer their way during the changes. This isn’t likely to be a large number of variables, but some are undoubtedly missed in this data set.
What the data set does represent, though, is the world’s most comprehensive catalog of variable astronomical objects and the tools to do science to them. These sorts of data releases are precisely the kind of milestones that keeps astronomy moving forward. And Gaia still has more to come, with DR4 on the way sometime after 2025. So astronomers will have plenty of time to pour over all the DR3 data in detail before the next massive data release.
Learn More:
Rimoldini et al – All-sky classification of 12.4 million variable sources into 25 classes
UT – Gaia is an Even More Powerful Planet Hunter Than we Thought
UT – ESA is About to Release its Third Giant Data Release From Gaia
UT – Gaia’s Massive Third Data Release is out!
Lead Image:
Artist’s depiction of Gaia in the Milky Way.
Credit – ESA / ATG medialab, background image: ESO / S. Brunier

