According to the Intergovernmental Panel on Climate Change (IPCC) Sixth Assessment Report (AR6), human activities have significantly impacted the planet. As global greenhouse gas emissions (mainly carbon dioxide) have continued to increase, so too have global temperatures - with severe ecological consequences. Between 2011 and 2020, global surface temperatures rose by an estimated 1.07 °C (2.01 ° F) above the average in 1850–1900. At this rate, temperatures could further increase by 1.5 to 2 °C (2.7 to 3.6 °F) in the coming decades, depending on whether we can achieve net zero by 2050.
Unfortunately, the data for the past year is not encouraging. According to the 2023 Global Carbon Budget (GCB), an annual assessment of Earth's carbon cycle, emissions in 2023 continued to rise by 1.1 percent compared to the previous year. This placed the total fossil fuel emissions from anthropogenic sources at 36.8 billion metric tons (over 40 US tons) of carbon dioxide, with an additional 4.1 billion metric tons (4.5 US tons) added by deforestation, extreme wildfires, and other sources. This trend indicates we are moving away from our goals and that things will get worse before they get better!
Carbon budgets are essential for assessing humanity's impact on the planet and implementing mitigation strategies. The budget quantifies how much carbon was added to the atmosphere from fossil fuel use, land-use change, and other factors relative to how much carbon was removed by the planet's carbon cycle. This refers to how our planet and its ecosystems recycle carbon, which keeps carbon dioxide levels in our atmosphere within certain parameters and ensures temperatures remain stable over time.
For eons, this balance was maintained by photosynthetic plants, organisms, and Earth's oceans, which absorbed CO2from the atmosphere. Meanwhile, geological forces (i.e., mantle convection) sequestered it in the Earth's crust as carbonate rocks. Since the Industrial Revolution, fossil fuel consumption has sharply increased, which has become exponentially worse since the mid-20th century. In addition, the growth of global populations since the 19th century has also seen a commensurate increase in land clearance and ecological destruction.
In short, emissions increased rapidly while Earth's natural sequestration mechanisms were simultaneously being disrupted. The Global Carbon Budget was established to analyze these trends and prepare reports that inform organizations and help guide climate policy development. This year's report relied on several data sources, the most notable of which were inventories of emissions collected by governments and energy agencies. Satellite data was provided by NASA's Orbiting Carbon Observatory-2 (OCO-2) instrument to estimate the flux of carbon between the land and atmosphere.
CO2concentrations have increased from 278 parts per million (ppm) in 1750 to 420 ppm in 2023. In addition to carbon emissions from transportation, power generation, and manufacturing, major contributors this year included the extreme wildfire season in Canada. The data also indicates that the average global surface temperature in 2023 was 1.2 °C (2.1 °F) warmer than the average for NASA's baseline period (1951-1980), making it the hottest year on record. This is part of a trend where the past ten years (2014-2023) were either the hottest year on record or tied with another year during that same period.
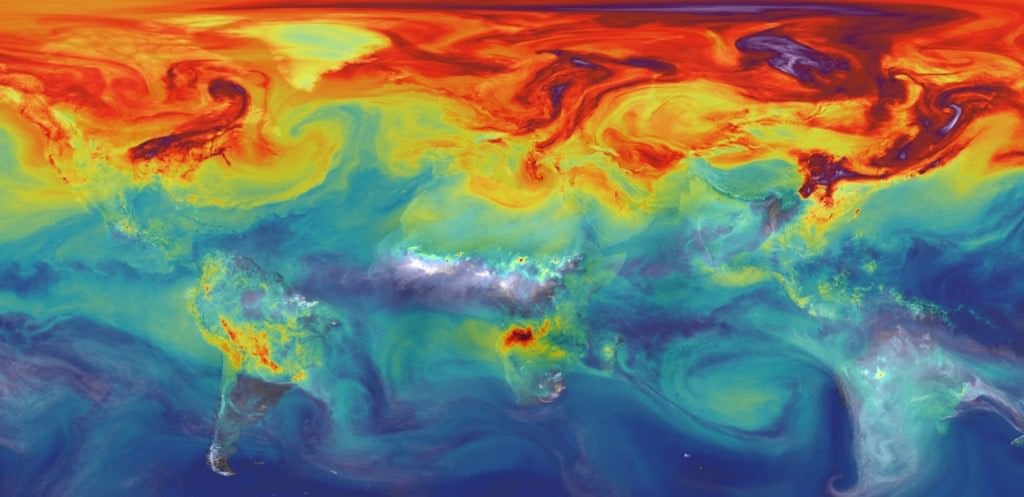
Based on climate modeling and data from the Goddard Earth Observing System (GEOS), researchers at NASA also create visualizations that illustrate how carbon dioxide is produced and stored every year. The visualization below is based on the most recent full year of available information (2021) and includes data on vegetation, human population density, infrastructure, and wildfires to depict how carbon dioxide was added and removed from the atmosphere. The carbon dioxide emissions are color-coded based on source to show the two main contributors and removal systems.
These include fossil fuel emissions (yellow), burning biomass (red), land ecosystems (green), and the ocean (blue). The Earth's crust and its oceans are both carbon sinks, meaning they remove more carbon from the atmosphere (and store it) than they emit. However, as the visualization shows, they can also be sources under certain circumstances, depending on the time and place. Surprisingly, the proportion of carbon dioxide that remains in the atmosphere (the airborne fraction) has remained remarkably stable over the past 60 years, even with the continued increase in anthropogenic greenhouse gas emissions.
However, scientists question whether and for how long that stability will continue. Ben Poulter, a co-author of the report and scientist at NASA's Goddard Space Flight Center, summarized in a recent NASA press release:
"Emissions are heading [in] the wrong direction that we need to limit global warming. Amazingly, the ocean and land continue to absorb about half of the carbon we emit. Only about 44 percent of emissions stay in the atmosphere each year, slowing the rate of climate change, but causing ocean acidification and altering how land ecosystems function."
In 2023, a study led by the National Oceanic and Atmospheric Administration (NOAA) analyzed carbon storage in the ocean over two decades. Titled " Decadal Trends in the Oceanic Storage of Anthropogenic Carbon From 1994 to 2014," this study indicated that this crucial carbon sink could be losing some of its storage capacity. The authors concluded that the ocean has likely slowed its absorption because it has already accumulated substantial amounts of CO2 and that changes in global ocean circulation (due to temperature increases) may be reducing the amount transferred from subsurface waters to the ocean floor.
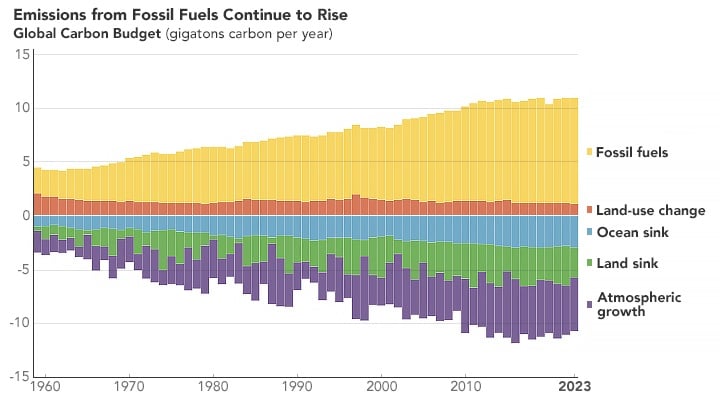
The chart below, taken from the 2023 GCB report, illustrates how the absorption rates of carbon sinks have changed over time. The report also emphasizes how carbon dioxide emissions are declining slightly in some regions, including Europe and the United States, but are still rising globally. The countries with the largest increase in emissions in 2023 were India and China, reflecting the ongoing "economic miracle" these nations have undergone in recent decades. Based on these latest numbers, there is doubt that world governments will meet their climate goals, as spelled out in the Paris Agreement.
Signed in December 2015, delegates from the 196 signatory countries committed to keeping average global temperature increases "well below 2 degrees Celsius above pre-industrial levels" while "pursuing efforts to limit the temperature increase to 1.5 °C." According to the GCB team, the current emissions level suggests that the planet's current carbon budget for keeping temperatures within this range is running out. They also claim that, at present, "there is a 50 percent chance global warming will exceed 1.5°C consistently in about seven years."
While it may not sound like a lot, this represents an average increase (both annually and globally), and the difference between these two scenarios is stark. As the IPCC explained in its A6 report, an increase of 1.5 °C would lead to more extreme weather (heavy rains and severe flooding), mass die-offs, and the extinction of many animal species. It would also mean that 8% of all farmland and 3 to 41% of fisheries worldwide would be lost due to increased famine and disruption to Earth's oceans. These risks increase sharply with an average increase of 2 °C, with the projected extinction of up to 18% of all species on land.
Above all, it is important to note that this is not the worst-case scenario. According to the AR6 report, a temperature increase of 4 °C (7.2 °F) would result in irreversible damage to the planet and its species:
"[M]ass mortalities and extinctions are expected that will irreversibly alter globally important areas, including those that host exceptionally rich biodiversity such as tropical coral reefs and cold-water kelp forests and the world’s rainforests. Even at lower levels of warming of 2°C or less, polar fauna (including fish, penguins, seals, and polar bears), tropical coral reefs and mangroves will be under serious threat."
Data collected by NASA and other federal agencies are now available through the recently launched U.S. Greenhouse Gas Center. This multi-agency effort consolidates information from observations and models to provide decision-makers with one location for data and analysis.
Further Reading: NASA Earth Observatory
 Universe Today


