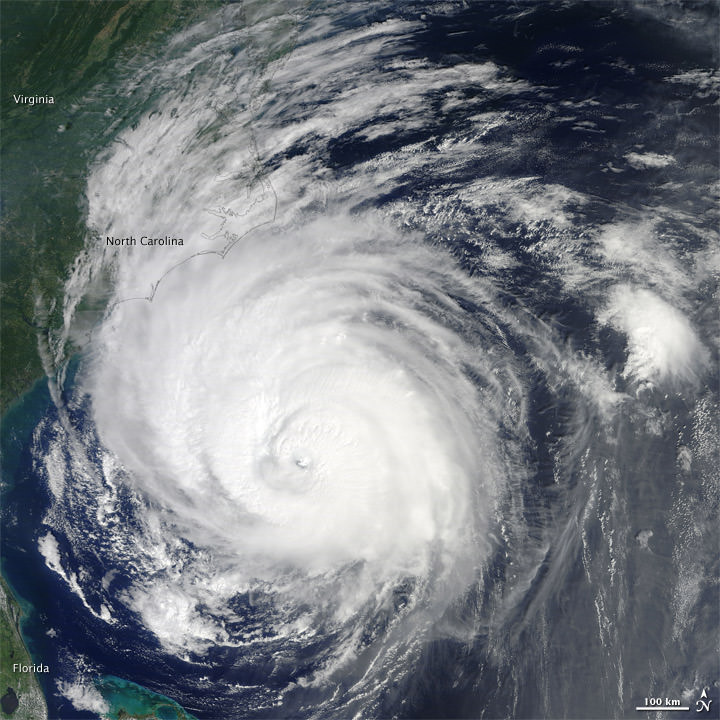
[/caption]
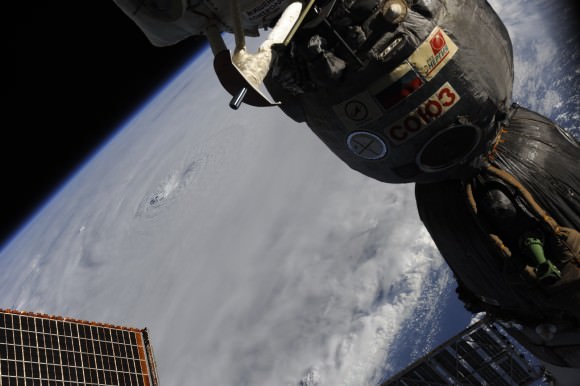
NASA scientists, instruments and spacecraft are busy studying Hurricane Earl from both the air and space, and an unmanned aircraft actually flew inside the giant storm. Above is a satellite image from NASA’s Terra satellite, and below is an image taken by one of the astronauts on board the International Space Station, Doug Wheelock. Three NASA aircraft carrying 15 instruments have been flying above, below and into Earl as part the new Genesis and Rapid Intensification Processes mission, or GRIP, which GRIP is designed to help improve our understanding of how hurricanes such as Earl form and intensify rapidly.
See below for a couple of NASA websites where you can see real-time data about Hurricane Earl.
The Global Hawk is an unmanned aerial vehicle, and it made its first-ever flight over a hurricane on Sept. 2, and here’s the image of Earl as seen the morning of Sept. 2 from a high-definition camera aboard the aircraft.
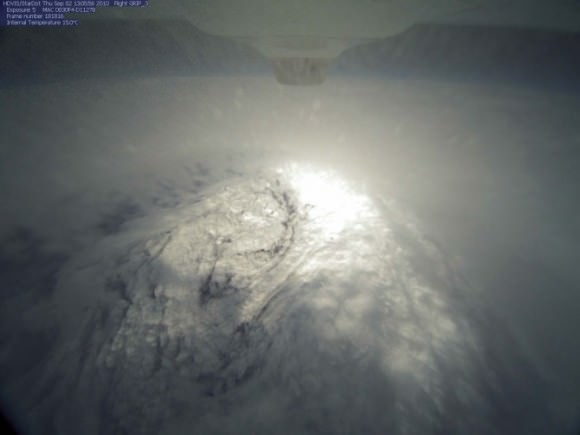
The photo show’s Hurricane Earl’s eye, and was taken from the HDVis camera on the underside of the Global Hawk aircraft at 13:05 UTC (9:05 a.m. EDT) on Sept. 2. The Global Hawk captured this photo from an altitude of 60,000 ft. (about 11.4 miles high). Here are some more hurricane photos.
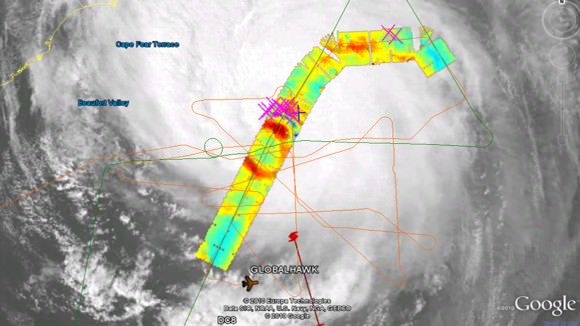
Among the instruments participating in GRIP is the High-Altitude Monolithic Microwave Integrated Circuit Sounding Radiometer, or HAMSR. The instrument is able to show the 3-D distribution of temperature, water vapor and cloud liquid water in the atmosphere.
Earl’s eye is visible as the blue-green circular area in the center of the image, surrounded by orange-red. The eye is colored blue-green because the instrument is seeing the ocean surface, which appears cool to the instrument. The surrounding clouds appear warm because they shield the cooler ocean surface from view. Just north of the ring of clouds is a deep blue arch, which represents a burst of convection (intense thunderstorms). The pink crosses in the image represent lightning in the area, as measured by a lightning network. Ice particles and heavy precipitation in the convective storm cell cause it to appear cold.
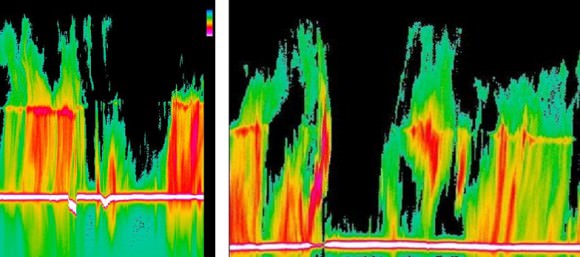
A second GRIP instrument is the Airborne Precipitation Radar (APR-2), a dual-frequency weather radar that is taking 3-D images of precipitation aboard NASA’s DC-8 aircraft. APR-2 is being used to help scientists understand the processes at work in hurricanes by looking at the vertical structure of the storms.
The two APR-2 hurricane images above show the early evolution of Hurricane Earl from a rather disorganized storm (left) to a better developed hurricane with a more distinct and smaller eye and sharper eyewall (right). The data, taken during southbound passes over Earl’s eye on Aug. 29 and 30, respectively, are essentially vertical slices of the storm. They correspond to the intensity of precipitation seen by the radar along the DC-8’s flight track. Intense convective precipitation (shown in shades of red and pink) was observed on both sides of the hurricane’s eye. The eye is indicated by the dark region near the middle of the images. The yellow-green-colored regions indicate areas of lighter precipitation. The white lines near the bottom are the ocean surface.
Near-real-time images from HAMSR and APR-2 are being displayed on NASA’s TC-IDEAS website at . The website is a near-real-time tropical cyclone data resource and it integrates data from satellites, models and direct measurements from many sources, to help researchers quickly locate information about current and recent oceanic and atmospheric conditions. The composite images and data are updated every hour and are displayed using a Google Earth plug-in. With a few mouse clicks, users can manipulate data and overlay multiple data sets to provide insights on storms that aren’t possible by looking at single data sets alone.
The progress of NASA’s GRIP aircraft can be followed in near-real-time when they are flying at this website. “Click to start RTMM Classic” will download a KML file that displays in Google Earth.
Source: JPL
Here are some more hurricane pictures, and even more hurricanes pictures.

