[/caption]
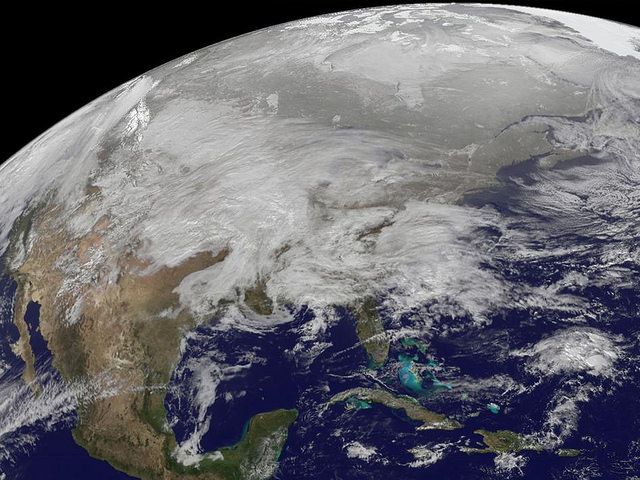
The roads are a skating rink where I live! This visible image was captured by the GOES-13 satellite on January 31, 2011 and it shows the low pressure area bringing snowfall to the Midwest US. Heavy snow is expected today in portions of northern Iowa, southern Minnesota and Wisconsin. Snowfall from the system extends from Michigan west to Montana, Idaho, Utah and Arizona. A mix of rain and snow also stretches into the Ohio and Tennessee valleys, and it is all moving east. This system appears to be as large as 1/3rd of the Continental U.S.
Meanwhile, in another hemisphere on the other side of the world a huge tropical cyclone threatens parts of Australia that has already been suffering from flooding.

The northeastern Australian state of Queensland is now bracing for what could become one of the largest tropical cyclones the state has ever seen.
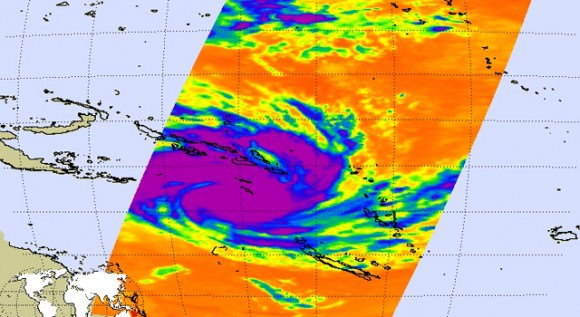
The Atmospheric Infrared Sounder (AIRS) instrument on NASA’s Aqua satellite captured this infrared image of Yasi on Jan. 31, 2011, at 6:29 a.m. PST (9:29 a.m. EST). The AIRS data create an accurate 3-D map of atmospheric temperature, water vapor and clouds, data that are useful to forecasters. The image shows the temperature of Yasi’s cloud tops or the surface of Earth in cloud-free regions.
The coldest cloud-top temperatures appear in purple, indicating towering cold clouds and heavy precipitation. The infrared signal of AIRS does not penetrate through clouds. Where there are no clouds, AIRS reads the infrared signal from the surface of the ocean waters, revealing warmer temperatures in orange and red.
At the approximate time this image was taken, Yasi had maximum sustained winds near 90 knots (166 kilometers per hour, or 103 mph), equivalent to a Category Two hurricane on the Saffir-Simpson Scale. It was centered about 1,400 kilometers (875 miles) east of Cairns, Australia, moving west at about 19 knots per hour (35 kilometers per hour, or 22 mph). Cyclone-force winds extend out to 48 kilometers (30 miles) from the center.
Yasi is forecast to move west, then southwestward, into an area of low vertical wind shear (strong wind shear can weaken a storm). Forecasters at the Joint Typhoon Warning Center expect Yasi to continue to strengthen over the next 36 hours. The Center forecasts a landfall just south of Cairns as a large 100-plus knot-per-hour (185 kilometers per hour, or 115 mph) system by around midnight local time on Wednesday, Feb. 2.
Sources: JPL, NASA Earth Observatory


everyone should start to ask if the military program haarp is responsible.they recently had a man working under the array and he got fried,your tax dollars are paying for these people to have this kind of awesome power to manipulate the weather as a military application.eisenhower said it best,i think in 1950″the war machine must be closely watched for it’s increasing appetite for power”
Sorry. I doubt it.
The storm may be related to global warming, but doubt the means exist to conjure storms like this on an ad hoc basis.
HAARP? Tell me what energy would HAARP need to transmit to create such a storm? And where exactly did they produce that amount of energy? Solar power? Wind mills?
Googled HAARP and found out it involves very low frequency radio waves. Radio waves don’t have any effect on the weather. Read that some conspiracy theorists are holding HAARP responsible for earthquakes. Don’t think it works that way, either. This serves as evidence that we need improved science education.
The conspiracy theorists are unable to explain where the energy would come to power such a machine as they claim.
because who has ever heard of a naturally-occurring storm, right?
Natural occurring storm? Hmmm, interesting.
The funny thing is that these HAARP believers believe in HAARP as some magic machine but the refuse to believe global warming.
lol. Funny guy.
Nancy
Thanks for the story. Looking at the images this tropical cyclone is enormous, gain strength and accelerating towards northern Australia. Worst is the width of it, whose size will cause much grief in terms of damage and tidal surges. The local media has been issuing important warnings and many have decided to head away from it.
More recent infrared images appear of the Bureau of Meteorology site, and show the huge spiral of the cyclone. http://www.bom.gov.au/gms/IDE00005.201102010430.shtml
(The circular mass near the centre of the continent is ex-tropic cyclone Anthony that crossed the coast a few days ago.)
As for your US storm, looks like cold weather the heavy snow falls across north eastern America. Staying safe indoors looks like the best option. Paradoxically, where I am along the southeast coast and eastern Australia today, the thermometer has soared. Temperature have been above 40C (104F) during the day, and this looks like continuing over the next week. (It is still 40.6C (105F) as I write this at 5pm local time.)
Good luck!
A Knot is a unit of velocity already: 1 Nautical Mile (2000 yards) per hour, so a Knot per hour is an acceleration!
Knot (disambiguation)
From Wikipedia, the free encyclopedia
. Knot (unit), a unit of speed equal to one nautical mile per hour
Per Mr. Webster
# Naut.
1. Historical any of the knots tied at regular intervals in a line used in measuring a ship’s speed
2. a unit of speed of one nautical mile (6,076.12 feet or 1,852 meters) an hour: abbrev. kn or kt: to average a speed of 10 knots
3. loosely nautical mile
The picture of the Northern hemisphere intriques me a bit. The image shows far north of the actic circle, which I would expect at this time of the year to be dark.
LC
Eeyup… its mid winter… Brrr
@ Mattmon
Yes, you are right on. Anyone who has any kind of memory left can see with their own eyes that the skies are being sprayed on a daily basis with chemtrails ( it is well documented) if your not suffering from cognitve disonance you will notice those white lines that go across the skies and turn into wispy clouds are not the contrails of old that were virtually safe and would disappear after at the most a minute. The NWO agenda is right on course: create all this extreme weather, call it global warming, and have the masses cry for FEMA to save them.
Yes, HAARP is very real and very scary do a simple search read both sides. Look for the HISTORY CHANNEL’s documentary on HAARP on Youtube.
Do your own research and don’t fall into the trap of going back and forth with the people on here who have an agenda or the disease of Head-Buried-In-the-Sand.
The HBS’s know that there Is So much evidence out there proving that geo-engineering (HAARP and More) is alive and well, but they are dogmatic on here and other venues that they are not real and/or not a threat. Never put your trust in any man! For me I will only put my trust in Jesus and HIS WORD! Jesus fortold the end times that we are in.
Um, wow
1. Chemtrails
2. HAARP & “geo-engineering”
3. *end times*
It’s an anti-science trifecta. 🙂
(…and AGW denial makes four)
Yep Haarp again. So tell me how much energy would haarp need to do the stuff that the CT claims? And especially where does that energy come from? Windmills?
I heard that after decades of research the US Navy has a working LENR (aka “cold fusion”) reactor. Top secret! Limitless energy!
Not. 😀
There are no chemtrails. The reason some contrails turn into whispy clouds is due to the wheather patterns, humidity, tempurature, etc. Plus it doesn’t always happen.
Also, I thought it was supposed to be the Russians controling weather, using “scalar fields”. 😉
Between the cyclone in Australia, the blizzards in the Staes, flooding in Brazil and the UK and freezing temps in India, some weird stuff happening with the weather.. check out a special feature on it:
http://thealteredpress.com/2011/02/02/breaking-news-mother-nature-tries-to-kill-us-some-more/