Swirling Feature on the Moon

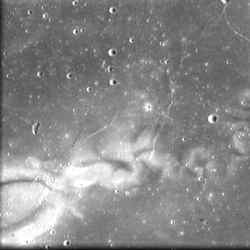
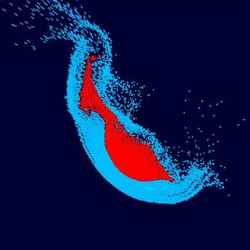
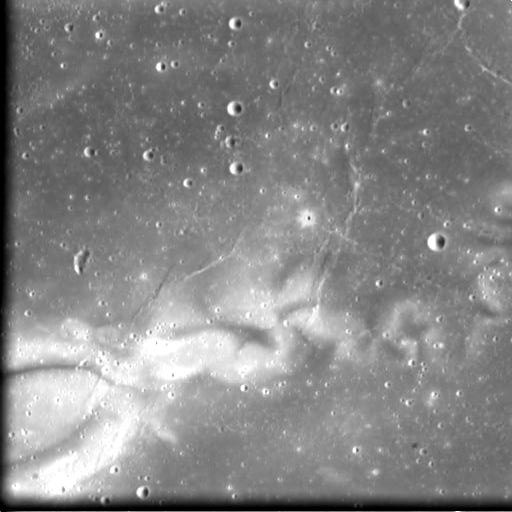
Reiner Gamma Formation. Image credit: ESA/Space-X. Click to enlarge
This image was taken by ESA’s SMART-1 spacecraft, and shows a bright feature on the surface of the Moon called the Reiner Gamma Formation. This is a bright spot on the Moon which is totally flat, and surrounded by much darker “mare”. Ground observations originally misidentified it as a crater, but when US and Russian spacecraft visited the Moon, they revealed this strange swirling morphology.

These images taken by the Advanced Moon Imaging Experiment (AMIE) on board ESA’s SMART-1 spacecraft, shows a feature characterised by bright albedo, and called Reiner Gamma Formation.

The Reiner Gamma Formation, a totally flat area consisting of much brighter material than the surrounding dark ‘mare’, is centred on an area located at 57.8 degrees West, 8.1 degrees North, in the Oceanus Procellarum on the near (visible) side of the Moon, and has an extension of approximately 30 by 60 kilometres.

The AMIE camera obtained the images on 14 January 2006, from a distance between 1599 and 1688 kilometres and with a ground resolution between 144 and 153 metres per pixel.

From early ground-based observations, this feature was initially misidentified as a crater. Only later detailed observations from orbit (such as those performed by USSR’s Zond-6, and NASA’s Lunar Orbiter, Apollo and Clementine missions) revealed its true nature: a very unusual morphology, consisting of swirl-like patterns that do not correspond to any topographic features.

Its main part consists of a bright pattern of elliptical shape, located to the west of Reiner crater. Bright elongated patches extend to the northeast in the Marius Hills region and small swirls extend to the southwest. The origin of the Reiner Gamma Formation and other swirls occurring on the lunar surface is still unclear.

Lunar swirls are associated with magnetic anomalies and some of these swirls – such as Mare Ingenii and Mare Marginis – are ‘antipodal’ to large impact structures (that is they are located right into opposite regions of the Moon globe).

So, it was suggested that the Reiner Gamma swirls correspond to magnetised materials in the crust or iron-rich ejecta materials able to deflect the solar wind (constant flow of charged particles coming from the Sun). This would prevent surface materials to undergo maturation processes, and so produce an optical anomaly.

However, Reiner Gamma Formation still stands as a particular case. In fact, the magnetic anomaly does not correlate with the scale of the lunar crust structure and large-scale anomalies seen on the far side. Furthermore, the anomaly is not associated with any obvious antipodal basin structure, and the surface material related to Reiner Gamma appears optically very immature (the age for its emplacement could be quite recent).

The analysis of NASA’s Clementine imaging data showed that the optical and spectroscopic properties of the local regolithic surface layer are close to those of immature mare crater-like soils. This is consistent with the properties of a shallow subsurface mare soil layer.

Considerations from works on impact cratering support the hypothesis that the uppermost part of the regolith could have been modified through an interaction with falling fragments of a low-density comet nucleus, previously broken by tidal forces and having ploughed the regolith.

Then, the magnetic anomaly would not be the result of an antipodal crustal field generated in the formation process of large impact basins. It would rather arise from local effects during the interaction between the lunar surface and cometary physical environment, with the possibility that the solar wind is locally deflected and contributes to the unusual optical properties.

So, the Reiner Gamma Formation could be an interesting site for future human exploration because of the radiation deflected from the surface. Further testing of this hypothesis requires access to the physical properties of the surface to constrain the mechanisms of formation of the lunar swirls. This is an ongoing task for the AMIE camera, aimed at studying regolith photometric properties.

Original Source: ESA Portal

First Colour Images from Mars Reconnaissance Orbiter

First colour images from MRO. Image credit: NASA/JPL-Caltech/University of Arizona. Click to enlarge.
The first full colour photographs are back from NASA’s Mars Reconnaissance Orbiter, and they’re big and beautiful. The photos were actually taken in the infrared spectrum, so this isn’t what the human eye would see – the colouring was done on computer. The spacecraft was 2,493 kilometers (1,549 miles) above the surface of Mars when it captured this image. It’ll be getting much closer in the coming months, so the photos are only going to get better.

This is the first color image of Mars from the High Resolution Imaging Science Experiment on NASA’s Mars Reconnaissance Orbiter. At the center portion of the camera’s array of light detectors there are extra detectors to image in green and near-infrared color bandpasses, to be combined with the black-and-white images (from red-bandpass detectors) to create color images. This is not natural color as seen by human eyes, but infrared color — shifted to longer wavelengths. This image also has been processed to enhance subtle color variations. The southern half of the scene is brighter and bluer than the northern half, perhaps due to early-morning fog in the atmosphere. Large-scale streaks in the northern half are due to the action of wind on surface materials. The blankets of material ejected from the many small fresh craters are generally brighter and redder than the surrounding surface, but a few are darker and less red. Two greenish spots in the middle right of the scene may have an unusual composition, and are good future targets for the Compact Reconnaissance Imaging Spectrometer for Mars, a mineral-identifying instrument on Mars Reconnaissance Orbiter ( http://crism.jhuapl.edu/). In the bottom half of the image we see a redder color in the rough areas, where wind and sublimation of water or carbon dioxide ice have partially eroded patches of smooth-textured deposits.

This image was taken by HiRISE on March 24, 2006. The image is centered at 33.65 degrees south latitude, 305.07 degrees east longitude. It is oriented such that north is 7 degrees to the left of up. The range to the target was 2,493 kilometers (1,549 miles). At this distance the image scale is 2.49 meters (8.17 feet) per pixel, so objects as small as 7.5 meters (24.6 feet) are resolved. In total this image is 49.92 kilometers (31.02 miles) or 20,081 pixels wide and 23.66 kilometers (14.70 miles) or 9,523 pixels long. The image was taken at a local Mars time of 07:33 and the scene is illuminated from the upper right with a solar incidence angle of 78 degrees, thus the sun was 12 degrees above the horizon. At an Ls of 29 degrees (with Ls an indicator of Mars’ position in its orbit around the sun), the season on Mars is southern autumn.

Images from the High Resolution Imaging Science Experiment and additional information about the Mars Reconnaissance Orbiter are available online at: http://www.nasa.gov/mro or http://HiRISE.lpl.arizona.edu. For information about NASA and agency programs on the Web, visit: http://www.nasa.gov.

JPL, a division of the California Institute of Technology in Pasadena, manages the Mars Reconnaissance Orbiter for NASA’s Science Mission Directorate, Washington. Lockheed Martin Space Systems is the prime contractor for the project and built the spacecraft. The HiRISE camera was built by Ball Aerospace and Technology Corporation and is operated by the University of Arizona.

Original Source: NASA/JPL News Release

Pulsars Form Planets Too

Artist illustration of a planetary disk forming around a pulsar. Image credit: NASA/JPL. Click to enlarge.
Think planets can only form around stars? Well, think again. NASA’s Spitzer Space Telescope has uncovered evidence for a potential planet-forming disk around a pulsar. In a former life, the pulsar would have been a large star 10-20 times bigger than the Sun that eventually consumed its fuel and exploded as a supernova. The remaining debris has started to collect again, and could eventually turn into new planets. This helps explain how planets were discovered around another pulsar in 1992, including one that’s Earth-sized.

NASA’s Spitzer Space Telescope has uncovered new evidence that planets might rise up out of a dead star’s ashes.

The infrared telescope surveyed the scene around a pulsar, the remnant of an exploded star, and found a surrounding disk made up of debris shot out during the star’s death throes. The dusty rubble in this disk might ultimately stick together to form planets.

This is the first time scientists have detected planet-building materials around a star that died in a fiery blast.

“We’re amazed that the planet-formation process seems to be so universal,” said Dr. Deepto Chakrabarty of the Massachusetts Institute of Technology in Cambridge, principal investigator of the new research. “Pulsars emit a tremendous amount of high energy radiation, yet within this harsh environment we have a disk that looks a lot like those around young stars where planets are formed.”

A paper on the Spitzer finding appears in the April 6 issue of Nature. Other authors of the paper are lead author Zhongxiang Wang and co-author David Kaplan, both of the Massachusetts Institute of Technology.

The finding also represents the missing piece in a puzzle that arose in 1992, when Dr. Aleksander Wolszczan of Pennsylvania State University found three planets circling a pulsar called PSR B1257+12. Those pulsar planets, two the size of Earth, were the first planets of any type ever discovered outside our solar system. Astronomers have since found indirect evidence the pulsar planets were born out of a dusty debris disk, but nobody had directly detected this kind of disk until now.

The pulsar observed by Spitzer, named 4U 0142+61, is 13,000 light-years away in the Cassiopeia constellation. It was once a large, bright star with a mass between 10 and 20 times that of our sun. The star probably survived for about 10 million years, until it collapsed under its own weight about 100,000 years ago and blasted apart in a supernova explosion.

Some of the debris, or “fallback,” from that explosion eventually settled into a disk orbiting the shrunken remains of the star, or pulsar. Spitzer was able to spot the warm glow of the dusty disk with its heat-seeking infrared eyes. The disk orbits at a distance of about 1 million miles and probably contains about 10 Earth-masses of material.

Pulsars are a class of supernova remnants, called neutron stars, which are incredibly dense. They have masses about 1.4 times that of the sun squeezed into bodies only 10 miles wide. One teaspoon of a neutron star would weigh about 2 billion tons. Pulsar 4U 0142+61 is an X-ray pulsar, meaning that it spins and pulses with X-ray radiation.

Any planets around the stars that gave rise to pulsars would have been incinerated when the stars blew up. The pulsar disk discovered by Spitzer might represent the first step in the formation of a new, more exotic type of planetary system, similar to the one found by Wolszczan in 1992.

“I find it very exciting to see direct evidence that the debris around a pulsar is capable of forming itself into a disk. This might be the beginning of a second generation of planets,” Wolszczan said.

Pulsar planets would be bathed in intense radiation and would be quite different from those in our solar system. “These planets must be among the least hospitable places in the galaxy for the formation of life,” said Dr. Charles Beichman, an astronomer at NASA’s Jet Propulsion Laboratory and the California Institute of Technology, both in Pasadena, Calif.

The Jet Propulsion Laboratory manages the Spitzer Space Telescope mission for NASA’s Science Mission Directorate, Washington. Science operations are conducted at the Spitzer Science Center at Caltech. JPL is a division of Caltech. Spitzer’s infrared array camera, which made the pulsar observations, was built by NASA’s Goddard Space Flight Center, Greenbelt, Md. The instrument’s principal investigator is Dr. Giovanni Fazio of the Harvard-Smithsonian Center for Astrophysics.

For more information about Spitzer, visit:

http://www.spitzer.caltech.edu/spitzer/

Original Source: NASA/JPL News Release

How Prometheus Pulls on Saturn’s F Ring

Prometheus acting on Saturn’s F ring. Image credit: NASA/JPL/SSI. Click to enlarge
One of the most amazing images sent back by the Cassini spacecraft shows one of Saturn’s shepherd moons, Prometheus, tugging a stream of particles away from the F ring. Scientists from Queen Mary, University of London have developed a model that explains the forces at work in this dramatic interaction. It was originally believed that Prometheus steals ring particles, but it now appears that it just borrows them as it comes past, and they drift back into the ring system after the moon sweeps by.

Images from Saturn’s F ring region obtained by the Cassini Imaging Science Subsystem (ISS) cameras have revealed structure never seen before in a planetary ring.

The rings around all the giant planets in our Solar System are thought to be stabilised by small ‘shepherd moons’ that orbit in or near the rings and stabilize them by gravitational influences.

The narrow F ring of Saturn ? which lies just outside the spectacular main rings – is tended by two small shepherds. Prometheus (100 km in diameter) orbits just inside the F ring, while Pandora (85 km in diameter) moves around Saturn just outside the F ring.

Periodic structures such as azimuthal gaps ? ‘channels’ of low optical depth – and ‘streamers’ have been discovered. These features can be seen in Movie1. The origin of these features has been explored by a team at Queen Mary, University of London (QMUL) using numerical integrations.

On Tuesday 4 April, Carlos Chavez of QMUL will be explaining to the RAS National Astronomy Meeting in Leicester the results of their computer models, which explain the close and complex relationship between Prometheus and the tangled F ring.

“The models are in excellent agreement with structures observed in the Cassini images,” said Chavez.

“We have found that the gaps are not due to a lack of particles, but to a forced change in orbital elements by a close encounter with Prometheus,” he explained. “The moon’s gravity temporarily pulls some of the particles away from the main stream as it passes by.”

“It is like a crowd of people walking in a number of lines in the same direction down a street. Suddenly, someone else comes from the other side of the street and collides with a few of them. He then tells them to come with him, and walks away. Only people in the closest lines follow him, which produces gaps in the crowd. However, they return back to the main group shortly afterwards.”

The most dramatic case will happen in late 2009, when the F ring and Prometheus are anti-aligned. Once per orbit during this anti-alignment Prometheus will be at apoapsis (its furthest point from Saturn) and the nearby ring particles will be at periapsis (closest point to Saturn). At that time, Prometheus and the ring particles are at their closest to each other.

The QMUL team explored how these events will affect collisions between the ring particles and Prometheus. They found a low number of collisions – only 0.6% of the particles collided per orbit. This was unexpected, since it was originally thought that Prometheus is a ‘thieving moon’, stealing particles from the F ring. What actually happens is that the particles are only temporarily pulled away and then drift back into the ring.

The ring-moon interactions are also likely to have an effect on the surface of Prometheus. Like our Moon and most other planetary satellites, Prometheus has a synchronous rotation, always showing the same face to Saturn.

The team at QMUL investigated the location on Prometheus’ surface where the particles would be expected to collide. They found that, in the synchronous co-rotating reference frame, the collisions surprisingly occurred on the trailing face of Prometheus, and preferably in the equatorial region.

This scenario has important implications for the surface features of Prometheus, and the team expects to find differences in albedo (reflectivity) between the trailing and leading faces.

“It would be like a man colliding with other people while facing continuously in a particular direction and hitting them with only one side of his body,” said Chavez.

Other members of the QMUL team examining the links between Prometheus and the F ring are: Prof. Carl D. Murray, Dr. Kevin Beurle, Dr. Nicholas J. Cooper, and Dr. Michael W. Evans.

Original Soure: RAS News Release

A Super Mercury was Smashed up 4.5 Billion Years Ago

Evolution of the impact three hours from the time of collision. Image credit: Horner et Al. Click to enlarge
According to current models of planetary formation, Mercury has too much mass. A new explanation proposes that Mercury was created from a much larger parent planet that collided with a giant asteroid 4.5 billion years ago. Astronomers from the University of Bern ran various scenarios modeling early versions of Mercury. This scenario of an early cataclysm best matched the current mass and composition of Mercury. Some of the ejected material would have made it all the way to Venus and even to the Earth.

A New computer simulations of Mercury’s formation show the fate of material blasted out into space when a large proto-planet collided with a giant asteroid 4.5 billion years ago. The simulations, which track the material over several million years, shed light on why Mercury is denser than expected and show that some of the ejected material would have found its way to the Earth and Venus.

“Mercury is an unusually dense planet, which suggests that it contains far more metal than would be expected for a planet of its size. We think that Mercury was created from a larger parent body that was involved in a catastrophic collision, but until these simulations we were not sure why so little of the planet’s outer layers were reaccreted following the impact,” said Dr Jonti Horner, who is presenting results at the Royal Astronomical Society’s National Astronomy Meeting on 5th April.

To solve this problem, Dr Horner and his colleagues from the University of Bern ran two sets of large-scale computer simulations. The first examined the behaviour of the material in both the proto-planet and the incoming projectile; these simulations were among the most detailed to date, following a huge number of particles and realistically modelling the behaviour of different materials inside the two bodies. At the end of the first simulations, a dense Mercury-like body remained along with a large swathe of rapidly escaping debris. The trajectories of the ejected particles were then fed in to a second set of simulations that followed the motion of the debris for several million years. Ejected particles were tracked until either they landed on a planet, were thrown into interstellar space, or fell into the Sun. The results allowed the group to work out how much material would have fallen back onto Mercury and investigate other ways in which debris is cleared up in the Solar System.

The group found that the fate of the debris depended on whereabouts Mercury was hit, both in terms of its orbital position and in terms of the angle of the collision.

Whilst purely gravitational theory suggested that a large fraction of the debris would eventually fall back onto Mercury, the simulations showed that it would take up to 4 million years for 50% of the particles to land back on the planet and in this time many would be carried away by solar radiation. This explains why Mercury retained a much smaller proportion than expected of the material in its outer layers.

The simulations also showed that some of the ejected material made its way to Venus and the Earth. While this is only a small fraction, it illustrates that material can be transferred between the inner planets relatively easily. Given the amount of material that would have been ejected in such a catastrophe, it is likely that there is a reasonable amount (possibly as much as 16 million billion tonnes [1.65×10^19 kg]) of proto-Mercury in the Earth.

Original Source: RAS News Release

Star Forming Dust Clouds Imaged by Hubble

NGC 281. Image credit: Hubble. Click to enlarge
The dark patch in this Hubble Space Telescope photograph is a “Bok globule” in the nearby star forming region, NGC 281. Astronomer Bart Bok first came up with the theory that dark globules like this are giant clouds of molecular gas, hundreds of light years across. Once perturbed, parts can collapse and become gravitationally bound; eventually forming stars and planets.

The yearly ritual of spring cleaning clears a house of dust as well as dust “bunnies,” those pesky dust balls that frolic under beds and behind furniture. NASA’s Hubble Space Telescope has photographed similar dense knots of dust and gas in our Milky Way Galaxy. This cosmic dust, however, is not a nuisance. It is a concentration of elements that are responsible for the formation of stars in our galaxy and throughout the universe.

These opaque, dark knots of gas and dust are called “Bok globules,” and they are absorbing light in the center of the nearby emission nebula and star-forming region, NGC 281. The globules are named after astronomer Bart Bok, who proposed their existence in the 1940’s.

Bok hypothesized that giant molecular clouds, on the order of hundreds of light-years in size, can become perturbed and form small pockets where the dust and gas are highly concentrated. These small pockets become gravitationally bound and accumulate dust and gas from the surrounding area. If they can capture enough mass, they have the potential of creating stars in their cores; however, not all Bok globules will form stars. Some will dissipate before they can collapse to form stars. That may be what’s happening to the globules seen here in NGC 281.

Near the globules are bright blue stars, members of the young open cluster IC 1590. The cluster is made up of a few hundred stars. The cluster’s core, off the image towards the top, is a tight grouping of extremely hot, massive stars with an immense stellar wind. The stars emit visible and ultraviolet light that energizes the surrounding hydrogen gas in NGC 281. This gas then becomes super heated in a process called ionization, and it glows pink in the image.

The Bok globules in NGC 281 are located very close to the center of the IC 1590 cluster. The exquisite resolution of these Hubble observations shows the jagged structure of the dust clouds as if they are being stripped apart from the outside. The heavy fracturing of the globules may appear beautifully serene but is in fact evident of the harsh, violent environment created by the nearby massive stars.

The Bok globules in NGC 281 are visually striking nonetheless. They are silhouetted against the luminous pink hydrogen gas of the emission nebula, creating a stark visual contrast. The dust knots are opaque in visual light. Conversely, the nebulous gas surrounding the globules is transparent and allows light from background stars and even background galaxies to shine through.

These images were taken with Hubble’s Advanced Camera for Surveys in October 2005. The hydrogen-emission image that clearly shows the outline of the dark globules was combined with images taken in red, blue, and green light in order to help establish the true color of the stars in the field. NGC 281 is located nearly 9,500 light-years away in the direction of the constellation Cassiopeia.

Original Source: HubbleSite News Release

Deep Space Alcohol

The cloud, where OH maser filament are red and extended methanol filaments are green. Image credit: JIVE Click to enlarge
Astronomers have located a gigantic cloud of methyl alcohol surrounding a stellar nursery. The cloud measures half a trillion km across (300 billion miles), and could help astronomers understand how some of the most massive stars in the Universe are formed. It’s methanol, not ethanol, so you wouldn’t want to drink it if you could reach it.

Astronomers based at Jodrell Bank Observatory have discovered a giant bridge of methyl alcohol, spanning approximately 288 billion miles, wrapped around a stellar nursery. The gas cloud could help our understanding of how the most massive stars in our galaxy are formed.

The new observations were taken with the UK’s MERLIN radio telescopes, which have recently been upgraded. The team studied an area called W3(OH), a region in our galaxy where stars are being formed by the gravitational collapse of a cloud of gas and dust. The observations have revealed giant filaments of gas that are emitting as ‘masers’ (molecules in the gas are amplifying and emitting beams of microwave radiation in much the same way as a laser emits beams of light).

The filaments of masing gas form giant bridges between maser ‘spots’ in W3(OH) that had been observed previously. The largest of these maser filaments is 288 billion miles (463 billion km) long. Observations show that the entire gas cloud appears to be rotating as a disc around a central star, in a similar manner to the accretion discs in which planets form around young stars. The maser filaments occur at shock boundaries where large regions of gas are colliding.

“Our discovery is very interesting because it challenges some long-accepted views held in astronomical maser research. Until we found these filaments, we thought of masers as point-like objects or very small bright hotspots surrounded by halos of fainter emission,” said Dr Lisa Harvey-Smith, who is the Principal Investigator for the study and is presenting results at the Royal Astronomical Society’s National Astronomy Meeting on 4th April.

Since the upgrade of the UK’s MERLIN telescope network, astronomers have been able to image methanol masers with a much higher sensitivity and, for the first time, get a complete picture of all the radiation surrounding maser sources. In the new study, the Jodrell Bank team looked at the motion of the W3(OH) star forming region in 3-dimensions and also measured physical properties of the gas such as temperature, pressure and the strength and direction of the magnetic fields. This information is vital when testing theories about how stars are born from the primordial gas in stellar nurseries.

Dr Harvey-Smith said, “There are still many unanswered questions about the birth of massive stars because the formation centres are shrouded by dust. The only radiation that can escape is at radio wavelengths and the upgraded MERLIN network is now giving us the first opportunity to look deep into these star forming regions and see what’s really going on.”

The many different types of interactions between molecules in star forming regions lead to emissions in many different wavelengths. Future observations of masers at other frequencies are planned to complete the complex jigsaw puzzle that has now been revealed.

Dr Harvey-Smith adds, “Although it is exciting to discover a cloud of alcohol almost 300 billion miles across, unfortunately methanol, unlike its chemical cousin ethanol, is not suitable for human consumption!”

Original Source: RAS News Release

Galaxies Trapped in the Universe’s Web

Galaxies are not randomly distributed. Image credit: IAC Click to enlarge
Although the galaxies we see in the night sky seem randomly strewn across the heavens, they’re actually organized into large scale structures that look like cosmic filaments. These filaments and walls surround huge bubble-like voids that lack any large structures at all. European astronomers measured the orientation of thousands of galaxies, and found that many are oriented in the direction of these linear filaments.

Astronomers from the University of Nottingham, UK, and the Instituto de Astrofisica de Canarias (Spain), have found the first observational evidence that galaxies are not randomly oriented.

Instead, they are aligned following a characteristic pattern dictated by the large-scale structure of the invisible dark matter that surrounds them.

This discovery confirms one of the fundamental aspects of galaxy formation theory and implies a direct link between the global properties of the Universe and the individual properties of galaxies.

Galaxy formation theories predicted such an effect, but its empirical verification has remained elusive until now. The results of this work were published the 1 April issue of Astrophysical Journal Letters.

Nowadays, matter is not distributed uniformly throughout space but is instead arranged in an intricate “cosmic web” of filaments and walls surrounding bubble-like voids. Regions with high galaxy concentrations are known as galaxy clusters whereas low density regions are termed voids.

This inhomogeneous distribution of matter is called the “Large-scale distribution of the Universe.” When the Universe is considered as whole, this distribution has a similar appearance to a spider’s web or the neural network of the brain. But it was not always like this.

After the Big Bang, when the Universe was much younger, matter was distributed homogeneously. As the Universe was evolving, gravitational pulls began to compress the matter in certain regions of space, forming the large-scale structure that we currently observe.

According to these models and theories a direct consequence of this process is that galaxies should be preferentially oriented perpendicularly to the direction of the linear filaments.

Several observational studies have looked for a preferential spatial orientation (or alignment) of galaxy rotation axes with respect to their surrounding large-scale structures. However, none of them have been successful, due to the difficulties associated with trying to characterise the filaments.

The research conducted by the astrophysical group formed by Ignacio Trujillo (University of Nottingham, UK), Conrado Carretero and Santiago G. Patiri, (both from the Instituto de Astrofisica de Canarias, Spain) has been able to measure this effect, confirming theoretical predictions.

To achieve this goal, they used a new technique based on the analysis of the huge voids that are found in the large-scale structure of the Universe. These voids have been detected by searching for large regions of space depleted of bright galaxies.

In addition, they took advantage of information provided by the two largest sky surveys yet undertaken: the Sloan Digital Sky Survey and the Two Degree Field Survey. These surveys contain positional information for more than half a million galaxies located within a distance of one billion light-years of the Earth.

Other parameters provided by the surveys, such as the position angle and the ellipticity of the objects, were used to estimate the orientation of the disk galaxies.

“We found that there is an excess of disk galaxies that are highly inclined relative to the plane defined by the large-scale structure surrounding them,” explained Dr. Trujillo. “Their rotation axes are mainly oriented in the direction of the filaments.

“Our work provides important confirmation of the tidal torque theory which explains how galaxies have acquired their current spin,” said Trujillo.

“The spin of the galaxies is believed to be intrinsically linked to their morphological shapes. So, this work is a step forward on our understanding of how galaxies have reached their current shapes.”

Dr. Ignacio Trujillo has a research assistant position, funded by PPARC, in the School of Physics and Astronomy at the University of Nottingham.

An abstract of the paper is available on the web at:
http://xxx.lanl.gov/abs/astro-ph/0511680

Original Source: RAS News Release

Deep Impact Caused a Great Gush of Water Vapour

Deep Impact. Image credit: NASA. Click to enlarge
When Deep Impact collided with Tempel 1, it released an amazing amount of water vapour from the comet – as much as 250,000 tonnes were blasted into space. These measurements were made by NASA’s Swift satellite, which normally locates and observes gamma ray bursts. Swift, like almost every other telescope on Earth and in space was pointed at Comet Tempel 1 when Deep Impact smashed into it last July. Swift monitored the X-ray emissions before and after the collision, and used that to measure the amount of water vapour ejected.

Over the weekend of 9-10 July 2005 a team of UK and US scientists, led by Dr. Dick Willingale of the University of Leicester, used NASA’s Swift satellite to observe the collision of NASA’s Deep Impact spacecraft with comet Tempel 1. Reporting today (Tuesday) at the UK 2006 National Astronomy Meeting in Leicester, Dr. Willingale revealed that the Swift observations show that the comet grew brighter and brighter in X-ray light after the impact, with the X-ray outburst lasting a total of 12 days.

“The Swift observations reveal that far more water was liberated and over a longer period than previously claimed,” said Dick Willingale.

Swift spends most of its time studying objects in the distant Universe, but its agility allows it to observe many objects per orbit. Dr. Willingale used Swift to monitor the X-ray emission from comet Tempel 1 before and after the collision with the Deep Impact probe.

The X-rays provide a direct measurement of how much material was kicked up after the impact. This is because the X-rays were created by the newly liberated water as it was lifted into the comet’s thin atmosphere and illuminated by the high-energy solar wind from the Sun.

“The more material liberated, the more X-rays are produced,” explained Dr. Paul O’Brien, also from the University of Leicester.

The X-ray power output depends on both the water production rate from the comet and the flux of subatomic particles streaming out of the Sun as the solar wind. Using data from the ACE satellite, which constantly monitors the solar wind, the Swift team managed to calculate the solar wind flux at the comet during the X-ray outburst. This enabled them to disentangle the two components responsible for the X-ray emission.

Tempel 1 is usually a rather dim, weak comet with a water production rate of 16,000 tonnes per day. However, after the Deep Impact probe hit the comet this rate increased to 40,000 tonnes per day over the period 5-10 days after impact. Over the duration of the outburst, the total mass of water released by the impact was 250,000 tonnes.

One objective of the Deep Impact mission was to determine what causes cometary outbursts. A simple theory suggests that such outbursts are caused by the impact of meteorites on the comet nucleus. If this is the case, Deep Impact should have initiated an outburst.

Although the impact was observed across the electromagnetic spectrum, most of what was seen was directly attributable to the impact explosion. After 5 days, optical observations showed that the comet was indistinguishable from its state prior to the collision. This was in stark contrast to the X-ray observations.

The analysis of the X-ray behaviour by the Swift team indicates that the collision produced an extended X-ray outburst largely because the amount of water produced by the comet had increased.

“A collision such as Deep Impact can cause an outburst, but apparently something rather different from the norm can also happen,” said Dr. Willingale. “Most of the water seen in X-rays came out slowly, possibly in the form of ice-covered dust grains.”

Original Source: RAS News Release

Simulating the Early Universe

Spiral galaxy NGC 1300. Image credit: Hubble. Click to enlarge
Researchers have harnessed the power one of the world’s fastest supercomputers – the Earth Simulator – to model the growth of galaxies in the early Universe. The team simulated the process right from the beginning, shortly after the Big Bang, when clumps of gas came together to form stars which then merged into larger and larger collections, and finally became galaxies. They found that galaxies like the Milky Way probably have the same composition now as they did only a billion years after the Big Bang.

Two astronomers have performed one of the world’s largest astrophysics simulations to date in order to model the growth of galaxies. Using the “Earth Simulator” supercomputer in Japan, which is also used for climate modelling and simulating seismic activity, Masao Mori of the University of California at Los Angeles and Masayuki Umemura at the University of Tsukuba have calculated how galaxies evolved from just 300 million years after the Big bang to the present day. The results show that galaxies may have evolved much faster than currently believed (Nature 440 644).

According to the “hierarchical” model, galaxies are formed via a bottom-up process that starts with the formation of small clumps of gas and stars that then merge into bigger systems. Mori and Umemura simulated this process using a powerful 3D hydrodynamic code combined with a “spectral synthesis” code for an astrophysical plasma in order to take into account the dynamical and chemical evolution of a primordial galaxy. The Earth-Simulator simulation was performed with an ultra-high resolution based on 1024 “grid points”, making it one of the biggest calculations ever performed in astrophysics.

Mori and Masayuki set up the initial conditions in their simulation based on a cold dark matter universe, the parameters of which are determined by measurements of the cosmic microwave background. These observations, first made in 2003, show that we are living in a flat universe comprising just 4% ordinary matter, 22% dark matter and 74% dark energy – in agreement with the standard model of cosmology. The researchers then directly compared their numerical results with observations of primitive galaxies called Lyman-alpha emitters and “Lyman break” galaxies, which astronomers find in the most distant and therefore oldest parts of the universe.

The results show that the primordial bubbles of gas that formed in the early universe just 300 millions years after the Big Bang do indeed look like Lyman-alpha emitters. After about 1 billion years, the simulations show that these galaxies mutate into Lyman break galaxies. Finally, after 10 billion years of evolution, the structures resemble present-day elliptical galaxies.

The simulation also predicts the mixture of chemical elements in the galaxy at each stage of its evolution, and suggests that our Milky Way has roughly the same composition today as it did when it was just 1 billion years old. Until now, galaxies were thought to have evolved gradually and become enriched in heavier elements beyond hydrogen and helium over a period of 10 billion years by repeated star formation and supernova explosions.

“Our finding shows that galaxy formation proceeded much faster and that a large amount of heavy elements were produced in galaxies in just 1 billion years,” says Mori.

Original Source: Institute of Physics