Debris Filled Craters on Mars

This photograph was taken by ESA’s Mars Express spacecraft. It shows a mountain in the eastern Hellas Planitia region with craters partly filled with debris. It’s possible that the mountain was covered by glaciers in the past, which filled up the craters with ice and debris; the debris remained after the glaciers retreated. The craters are largely free of meteorite impacts inside, so it’s believed they filled with debris less than a few million years ago.

This video and accompanying images, taken by the High Resolution Stereo Camera (HRSC) on board ESA’s Mars Express spacecraft, show an unusual flow deposit on the floors of two adjacent impact craters in the eastern Hellas Planitia region, indicating possible glacial processes.

The stereo capability of the HRSC makes it possible to animate 3D anaglyph images, based on digital elevation models. The image data have been acquired during Mars Express orbit 451 from an altitude of 590 kilometres with an original resolution of 29 metres per pixel.

The unusual ‘hourglass’-shaped structure is located in the southern-hemisphere highland terrain of Promethei Terra at the eastern rim of the Hellas Basin, at about latitude 38 South and longitude 104 East.

Most likely the surface morphology is formed by the ‘creep’ of ice and debris, similar to either terrestrial rock glacier landforms or debris covered glaciers which are commonly found in high latitudes and alpine regions.

‘Talus’ material (or ‘scree’, the broken rocks that lie on a steep mountainside or at the base of a cliff) and ice-rich debris accumulated at the base of the remnant massif and filled the upper bowl-shaped impact crater which is approximately nine kilometres wide. The debris-ice mixture then flowed through a breach in the crater rim into a 17-kilometre wide crater, 500 metres below, taking advantage of the downward slope.***image4:left***

Of particular interest is the age of these surfaces, which seem to be fairly intact over a wide area. It has been shown recently that there is some evidence that glaciers were shaping the Martian surface at mid latitudes and even near the equator until a few million years ago.

Typical evidence for a significant loss of volatiles, such as pits and other depressions can be observed on all debris surfaces surrounding the remnant massif.

The statistical analysis of the number of craters formed by meteorite impacts used for age determination also shows that part of the surface with its present-day glacial characteristics was formed only a few million years ago.

Original Source: Mars Express

Astrophoto: The Planet Jupiter by Mike Salway

The Planet Jupiter by Mike Salway
Thirty years ago the clearest views of the planet Jupiter could only be obtained from multi-million dollar robotic space probes, like the twin Voyager missions sent to survey the outer planets. As recently as five years ago, the atmosphere still hopelessly blurred views of Jupiter, or any other planet, seen from the surface of the Earth through telescopes. All of that has changed thanks to the digital revolution in photography. Now, people with the interest, a modest telescope and a common web camera can learn to take planetary portraits that rival some the best from NASA.

The accompanying photographs of Jupiter and its moon Ganymede, in orbit around the Sun, 365 million miles from our planet, were produced by Mike Salway, an Australian amateur astronomer using a unguided 10 inch Dobsonian telescope and a ToUCam web camera. The pictures were produced from images taken on March 12, 2006. The clarity of each image is similar to pictures taken by Voyager after it had traveled over 90 percent of the distance from Earth to Jupiter.

Taking planetary images from the ground using modest equipment is still a daunting challenge that requires patience, ingenuity and talent. For example, each of the three pictures featured here required Mike to take 450 separate exposures at five frames per second over a space of ninety seconds. Using commercially available software to pick out the best frames, Mike was able to identify the clearest images from each set, digitally combine then enhance them and produce one final picture.

Mike not only captured this trio of beautiful images, he created a short sixteen-frame movie showing the planet in rotation! Each frame is separated by approximately five minutes; therefore the movie spans the planet’s rotation over a period of almost an hour and a half. The clarity of this animation also harks back to those taken as Voyager approached Jupiter in 1979.

One of the three images has been arrowed to indicate the location of a new storm in Jupiter’s atmosphere that has taken on the same hues and characteristics of the Great Red Spot – a storm that has persisted for over three hundred years. Nicknamed Red Jr, this new disturbance is still quite huge and capable of swallowing several Earths.

Do you have photos you’d like to share? Post them to the Universe Today astrophotography forum or email them, and we might feature one in Universe Today.

Written by R. Jay GaBany

What’s Up This Week – March 20 – March 26, 2006

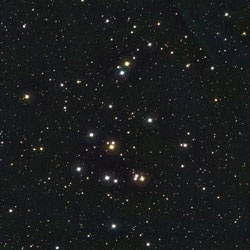
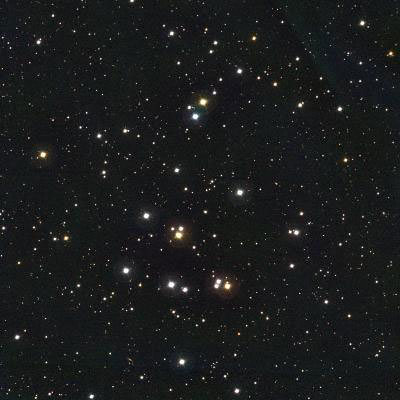
M44: The Beehive. Image credit: NOAO/AURA/NSF. Click to enlarge.
Greetings, fellow SkyWatchers! This week brings darker skies, bright star clusters, meteor showers, unusual nebulae and a chance to participate in G.L.O.B.E. at Night! Whether you use a telescope, binoculars, or just your eyes – you’ll find a wealth of astronomy activities this week. So turn an eye to the sky, because….

Here’s what’s up!

Monday, March 20 – Tonight the obscure constellation of Cancer is now well placed for observation – so why not compare views of the two Messier clusters found there? They’re both binocular and telescope easy!

M44 is one of the most easily recognized studies in the night sky. Like the Pleiades and Hyades in Taurus, Praesepe, “The Manger,” comes to us as a discovery from antiquity. Its myths include one about two neighboring bright stars – Asellus Australis and Asellus Borealis. These two stars are said to be donkeys taking meals from the manger. Known to amateur astronomers as “the Beehive Cluster,” Galileo was the first to discern its stellar nature. Even with his modest scope, he resolved around forty of its brightest members. Modern telescopes have determined that at least 200 of the 350 or more stars visually associated with M44 move together and are a part of the 700 million year old open cluster.

Open cluster M67 is little less than a fist width southeast of M44, or about a finger-width west of visual star – Acubens (Alpha Cancri). Five times further away than M44, and at 3.5 billion years of age, M67 is one of the oldest open clusters in our galaxy. Its brightest stars have already gone “white dwarf” after long ago exhausting their nuclear fuel. You’ll notice it’s quite dense and surprisingly faint for a Messier study. Its discoverer, Johann Gottfried Koehler, was unable to resolve any stars! Today’s telescopes resolve dozens – even hundreds – of cluster members while most binoculars will find it to appear quite “galactic!”

Be on the lookout for Antares as it and the Moon rise together. There will be an occultation tonight, so be sure to check IOTA for times and details in your area.

Tuesday, March 21 – How about one last open cluster before going galaxy hunting? Our study – M48 – is roughly 3 degrees southeast of Zeta Monocerotis. Like M44 in Cancer, M48 lies within the limits of unaided sight. Its brightest member is a spectral type A star, intrinsically some 70 times brighter than our own Sun, but it only appears close to 9th magnitude thanks to 1500 light-years separating us. M48 is quite large, and will show several dozen stars within reach of small scopes and binoculars.

Spring has arrived and with it comes the time of galaxies. To celebrate this new astronomical season, have a look at NGC 2903. Located about a finger-width south-southeast of Lambda Leonis, this 8.9 magnitude tilted spiral looks very much like a slightly fainter version of M81 in Ursa Major. Larger scopes easily catch hints of the galaxy’s spiral extensions and all will show considerable brightening toward the very expansive core region!

Wednesday, March 22 – Born on this day in 1799 was Friedrich Argelander, a compiler of star catalogues. Argelander also studied variable stars and created the first international astronomical organization entitled simply the “Astronomical Society.”

If you’d like to join in an Astronomical Society event, then take the time to visit the Astronomical League webpages and participate in the National Optical Astronomy Observatory (NOAO) call to all observers to participate in G.L.O.B.E. at Night program. No special equipment is needed and your observations “count”!

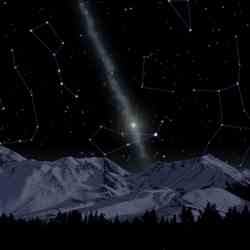
With a later moonrise tonight, let’s have a look at two meteor showers. We’ll start first with the Camelopardalids. These have no definite peak, and a screaming fall rate of only one per hour. They do have one claim to fame however – these are the slowest meteors known – arriving at a speed of only 7 kilometers per second!

Far more interesting will be to watch for the peak of the March Geminids. These were first discovered and recorded in 1973, then confirmed in 1975. With a much improved fall rate of about 40 per hour, these faster meteors will be fun to follow. When you do see a bright streak, trace it back to its point of origin. Did you see a Camelopardalid? Or a March Geminid?

While out, let’s use the late rise of the Moon to our advantage and head about 2 degrees northeast of star 13 in Monoceros. Our study will be NGC 2261 – more commonly known as “Hubble’s Variable Nebula.” Named for Edwin Hubble, this 10th magnitude object is very blue in appearance through larger apertures, and a true enigma. The fueling star, the variable R Monocerotis, does not display a normal stellar spectrum and may be a proto-planetary system. R is usually lost in the high surface brightness of the “comet-like” structure of the nebula, yet the nebula itself varies with no predictable timetable – perhaps due to dark masses shadowing the star. We do not even know how far away it is, because there is no detectable parallax!

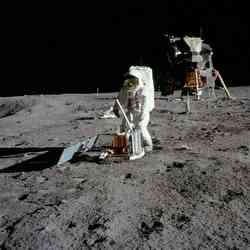
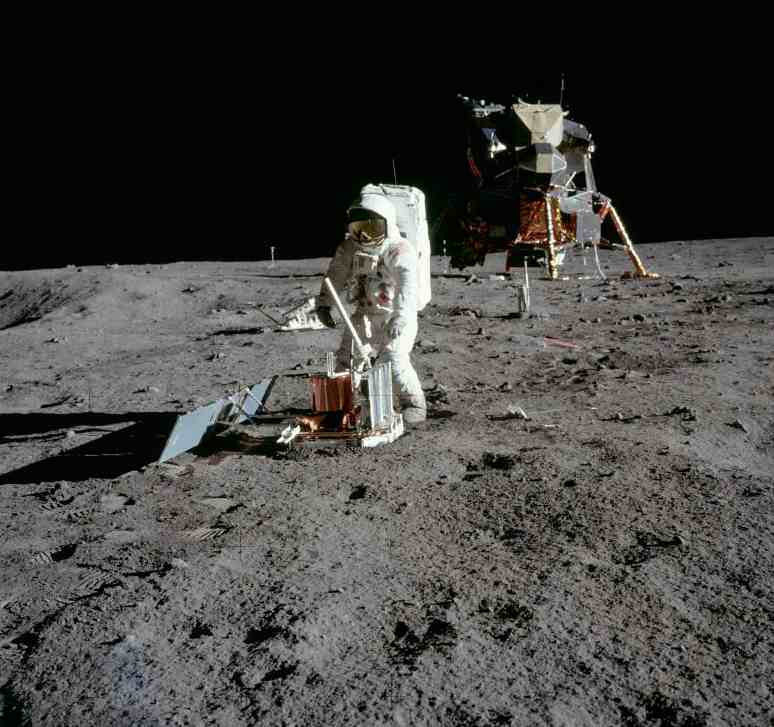
Thursday, March 23 – Today in 1840, the first photograph of the Moon was taken. The daguerreotype plate was exposed by American astronomer and medical doctor, J. W. Draper. Draper’s fascination with chemical responses to light also led him to another first — a photo of the Orion Nebula.

Tonight let’s have a look at a study in light and dark as we view our large binocular and telescope study for this evening. You’ll find it located roughly halfway between Sirius and Alpha Monocerotis – NGC 2359. Known as “Thor’s Helmut,” this bubble-like emission nebula was blown into existence by the superheated blue giant star in its center. NGC 2359 spans about 30 light-years some 15,000 light-years away. The supercharging Wolf-Rayet star produces high speed stellar winds which may have interacted with a nearby molecular cloud giving this strange nebula its curved shape. At magnitude 11, “Thor’s Helmut” is an unusual observation to add to your collection of “head gear.”

Friday, March 24 – Today is the birthday of Walter Baade. Born in 1893, Baade was the first to resolve the Andromeda galaxy’s companions into individual stars and developed the concept of the two types of stellar populations in galaxies. Among his many achievements, Baade is also well known for discovering an area towards our galactic center (M24) which is relatively free of dust, now known as “Baade’s Window.”

Although “Baade’s Window” is a summer sky study, we can take the time this evening to study an area on the opposite side of the sky. Astronomers use a celestial coordinate system based on “hours:minutes:seconds” for east-west location (right ascension – RA) and “degrees” for north-south (declination – DEC) position. It just so happens that should you turn eye, binoculars, or telescope to a RA-DEC location completely complimentary to the center of Baade’s Window (RA=6hrs:16mins, DEC=18.29 degrees) you will find yourself about mid-way between 3.2 magnitude Mu Geminorum and 4.4 magnitude Nu Orionis. And it is precisely there that you will see something that is almost completely the opposite of what can be seen in Baade’s Window – which is to say, “not much.”

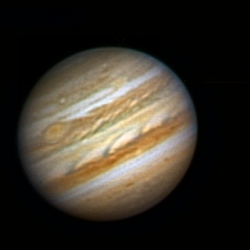
Saturday, March 25 – Today in 1655, Titan – Saturn’s largest satellite – was discovered by Christian Huygens. 350 years later, a probe named for Huygens captured the attention of the world as it descended by parachute onto Titan’s surface and sent back information on that distant moon. Huygens also went on to discover Saturn’s ring system in 1655. So while Saturn still rides high in the sky, make your own return visit and tour Saturn’s rings and satellites. The siren song of Titan awaits you!

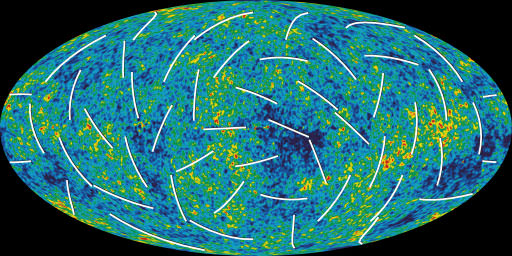
Also on this date in 1951, 21 cm wavelength radiation from atomic hydrogen in the Milky Way was first detected. 1420 MHz H I, neutral – but non-molecular, hydrogen studies continue to form the basis of large parts of modern radio astronomy. Milky Way H I regions are generally free of stars since they heat the stable hydrogen gases and cause them to emit light. Using 21 cm radio-telescopy, astronomers can map the distribution of non-stellar matter in the interstellar medium – the vast regions of space between the stars. Because radio waves can penetrate dust also found in the interstellar medium, we know much more about the distribution of hydrogen gas in our galaxy than would otherwise be possible.

Although stable hydrogen gas is invisible optically, its presence is especially concentrated along the disk of our galaxy in its vast spiral arms. One such region is associated with the Orion Complex. So take some time to scan the sky due south of 3.4 magnitude Eta Orionis and note how few stars are visible between it and 4.2 magnitude 29 Orionis – some 5 and a half degrees away. Such regions are known to have high concentrations of 21 cm radiation caused by hydrogen gas that has yet to begin coalescing into new Suns such as our own.

Sunday, March 26 – Tonight, let’s have a look at the “Eight-burst Planetary.” But, we have to warn you, it isn’t easy for the northern hemisphere. Start by locating Alpha Hydrae. Now drop more than a hand span due south to Psi in Vela. With Psi centered at low power, you can simply wait a little less than half an hour for NGC 3132 to “drift” into the field, or move due east 7 degrees. Either way should reveal this superb 8th magnitude “Southern Ring Nebula!” Look for a “tilt” in brightness across this 2000 light-year distant ring plus its central star. Use high power – this one is less than half the size of the famed “Northern Ring Nebula” – M57.

May all your journeys be at light speed… ~Tammy Plotner (with Jeff Barbour).

Maybe Water Didn’t Make the Gullies on Mars

Mars gullies in Noachis Terra region. Image credit: NASA Click to enlarge
It was only a few years that researchers announced the discovery of gullies on Mars. Here on Earth, gullies like this are formed when water flows quickly down a hill, and erodes the soil. Unfortunately, there might be another explanation for the Martian version – since similar gullies have now been seen on the Moon as well. It’s possible that the gullies are formed completely dry, when micrometeorites strike the side of a crater wall and trigger a landslide.

If you’re a scientist studying the surface of Mars, few discoveries could be more exciting than seeing recent gullies apparently formed by running water.

And that’s what scientists believed they saw in Mars Orbital Camera (MOC) images five years ago. They published a paper in Science on MOC images that show small, geologically young ravines. They concluded that the gullies are evidence that liquid water flowed on Mars’ surface sometime within the last million years.

A word of caution, though: The moon has gullies that look like that, a University of Arizona Lunar and Planetary Laboratory researcher has found. And water certainly didn’t form gullies on the waterless moon.

Gwendolyn D. Bart is presenting the work today at the 37th Lunar and Planetary Science Conference in Houston.

“We’d all like to find liquid water on Mars,” Bart said. “That would be really, really exciting. If there were liquid water on Mars, humans wouldn’t have to ship water from Earth when they go to explore the planet. That would be an enormous cost savings. And liquid water near the surface of Mars would greatly increase the chances for native life on Mars.”

The 2000 Science paper was provocative, Bart said. “But I was skeptical. I wondered if there is another explanation for the gullies.”

Then last year she heard a talk by Allan Treiman of the Lunar and Planetary Institute. Treiman suggested the martian gullies might be dry landslides, perhaps formed by wind and not formed by water at all.

Recently, Bart was studying the lunar landscape in high-resolution images taken in 1969, prior to the Apollo landings, for her research on processes that modify the lunar surface.

“Totally by accident, I saw gullies that looked strikingly like the gullies on Mars,” she said.

“If the dry landslide hypothesis for the formation of martian gullies is correct, we might expect to see similar features on the moon, where there is no water,” she said. “We do.”

Gullies in the moon’s 10-mile-diameter (17 kilometer) crater Dawes are similar in structure and size to those in a martian crater that MOC photographed. Micrometeorites hitting the smooth slopes and crater on the airless moon could easily trigger small avalanches that form gullies, Bart said.

However, the martian gullies also resemble gullies on Earth that were formed by water, she noted.

“My point is that you can’t just look at the Mars gullies and assume they were formed by water. It may be, or may be not. We need another test to know.”

Original Source: UA News Release

Watch Out for Moonquakes

Buzz Aldrin deploys a seismometer at the moon surface. Image credit: NASA Click to enlarge
During the Apollo Moon missions – between 1969 and 1972 – NASA astronauts placed seismometers at their landing sites to detect if the Moon has earthquakes (moonquakes). The equipment mostly detected minor tremors, but it also experienced some fairly strong ones, measuring greater than 5.5 on the Richter scale. And they lasted for a very long time, sometimes going on for 10 minutes. If the next group of astronauts will be visiting the Moon for any length of time, they’ll need a lunar base that can withstand the occasional trembler.

NASA astronauts are going back to the moon and when they get there they may need quake-proof housing.

That’s the surprising conclusion of Clive R. Neal, associate professor of civil engineering and geological sciences at the University of Notre Dame after he and a team of 15 other planetary scientists reexamined Apollo data from the 1970s. “The moon is seismically active,” he told a gathering of scientists at NASA’s Lunar Exploration Analysis Group (LEAG) meeting in League City, Texas, last October.

Between 1969 and 1972, Apollo astronauts placed seismometers at their landing sites around the moon. The Apollo 12, 14, 15, and 16 instruments faithfully radioed data back to Earth until they were switched off in 1977.

And what did they reveal?

There are at least four different kinds of moonquakes: (1) deep moonquakes about 700 km below the surface, probably caused by tides; (2) vibrations from the impact of meteorites; (3) thermal quakes caused by the expansion of the frigid crust when first illuminated by the morning sun after two weeks of deep-freeze lunar night; and (4) shallow moonquakes only 20 or 30 kilometers below the surface.

The first three were generally mild and harmless. Shallow moonquakes on the other hand were doozies. Between 1972 and 1977, the Apollo seismic network saw twenty-eight of them; a few “registered up to 5.5 on the Richter scale,” says Neal. A magnitude 5 quake on Earth is energetic enough to move heavy furniture and crack plaster.

Furthermore, shallow moonquakes lasted a remarkably long time. Once they got going, all continued more than 10 minutes. “The moon was ringing like a bell,” Neal says.

On Earth, vibrations from quakes usually die away in only half a minute. The reason has to do with chemical weathering, Neal explains: “Water weakens stone, expanding the structure of different minerals. When energy propagates across such a compressible structure, it acts like a foam sponge-it deadens the vibrations.” Even the biggest earthquakes stop shaking in less than 2 minutes.

The moon, however, is dry, cool and mostly rigid, like a chunk of stone or iron. So moonquakes set it vibrating like a tuning fork. Even if a moonquake isn’t intense, “it just keeps going and going,” Neal says. And for a lunar habitat, that persistence could be more significant than a moonquake’s magnitude.

“Any habitat would have to be built of materials that are somewhat flexible,” so no air-leaking cracks would develop. “We’d also need to know the fatigue threshold of building materials,” that is, how much repeated bending and shaking they could withstand.

What causes the shallow moonquakes? And where do they occur? “We’re not sure,” he says. “The Apollo seismometers were all in one relatively small region on the front side of the moon, so we can’t pinpoint [the exact locations of these quakes].” He and his colleagues do have some good ideas, among them being the rims of large and relatively young craters that may occasionally slump.

“We’re especially ignorant of the lunar poles,” Neal continues. That’s important, because one candidate location for a lunar base is on a permanently sunlit region on the rim of Shackleton Crater at the Moon’s south pole.

Neal and his colleagues are developing a proposal to deploy a network of 10 to 12 seismometers around the entire moon, to gather data for at least three to five years. This kind of work is necessary, Neal believes, to find the safest spots for permanent lunar bases.

And that’s just the beginning, he says. Other planets may be shaking, too: “The moon is a technology test bed for establishing such networks on Mars and beyond.”

Original Source: NASA News Release

A River of Stars Streaming Across the Sky

Artist’s illustration of the northern starry river. Image credit: Caltech Click to enlarge
Astronomers have found a narrow stream of stars extending across the sky for about 45 degrees – 90 times the width of the full Moon. The stream emanates from a cluster of 50,000 stars called NGC 5466, and stretches from Ursa Major (or the Big Dipper) to the constellation Bootes. The strength of gravity from the Milky Way is different on opposite sides of the star cluster, which causes it to stretch. Outlying stars are no longer held in the cluster and fall behind, creating the stream.

Astronomers have discovered a narrow stream of stars extending at least 45 degrees across the northern sky. The stream is about 76,000 light-years distant from Earth and forms a giant arc over the disk of the Milky Way galaxy.

In the March issue of the Astrophysical Journal Letters, Carl Grillmair, an associate research scientist at the California Institute of Technology’s Spitzer Science Center, and Roberta Johnson, a graduate student at California State University Long Beach, report on the discovery.

“We were blown away by just how long this thing is,” says Grillmair. “As one end of the stream clears the horizon this evening, the other will already be halfway up the sky.”

The stream begins just south of the bowl of the Big Dipper and continues in an almost straight line to a point about 12 degrees east of the bright star Arcturus in the constellation Bootes. The stream emanates from a cluster of about 50,000 stars known as NGC 5466.

The newly discovered stream extends both ahead and behind NGC 5466 in its orbit around the galaxy. This is due to a process called tidal stripping, which results when the force of the Milky Way’s gravity is markedly different from one side of the cluster to the other. This tends to stretch the cluster, which is normally almost spherical, along a line pointing towards the galactic center.

At some point, particularly when its orbit takes it close to the galactic center, the cluster can no longer hang onto its most outlying stars, and these stars drift off into orbits of their own. The lost stars that find themselves between the cluster and the galactic center begin to move slowly ahead of the cluster in its orbit, while the stars that drift outwards, away from the galactic center, fall slowly behind.

Ocean tides are caused by exactly the same phenomenon, though in this case it’s the difference in the moon’s gravity from one side of Earth to the other that stretches the oceans. If the gravity at the surface of Earth were very much weaker, then the oceans would be pulled from the planet, just like the stars in NGC 5466’s stream.

Despite its size, the stream has never previously been seen because it is so completely overwhelmed by the vast sea of foreground stars that make up the disk of the Milky Way. Grillmair and Johnson found the stream by examining the colors and brightnesses of more than nine million stars in the Sloan Digital Sky Survey public database.

“It turns out that, because they were all born at the same time and are situated at roughly the same distance, the stars in globular clusters have a fairly unique signature when you look at how their colors and brightnesses are distributed,” says Grillmair.

Using a technique called matched filtering, Grillmair and Johnson assigned to each star a probability that it might once have belonged to NGC 5466. By looking at the distribution of these probabilities across the sky, “the stream just sort of reached out and smacked us.

“The new stream may be even longer than we know, as we are limited at the southern end by the extent of the currently available data,” he adds. “Larger surveys in the future should be able to extend the known length of the stream substantially, possibly even right around the whole sky.”

The stars that make up the stream are much too faint to be seen by the unaided human eye. Owing to the vast distances involved, they are about three million times fainter than even the faintest stars that we can see on a clear night.

Grillmair says that such discoveries are important for our understanding of what makes up the Milky Way galaxy. Like earthbound rivers, such tidal streams can tell us which way is “down,” how steep is the slope, and where the mountains and valleys are located.

By measuring the positions and velocities of the stars in these streams, astronomers hope to determine how much Dark Matter the Milky Way contains, and whether the dark matter is distributed smoothly, or in enormous orbiting chunks.

Original Source: Caltech News Release

Early Universe’s Rapid Expansion Confirmed

A new detailed picture of the infant universe, where red indicates warm spots and blue for the cooler areas. Image credit: NASA/WMAP Click to enlarge
Scientists have gathered new evidence that supports the inflationary theory of expansion thanks new data from NASA’s Wilkinson Microwave Anisotropy Probe (WMAP). The spacecraft has been making continuous observations of the cosmic background radiation; the afterglow of the Big Bang. These latest observations produced a map of the sky so detailed that scientists were able to trace how microscopic fluctuations in the primordial Universe were magnified in a trillionth of a second of rapid expansion to create the stars and galaxies we see today.

Scientists peering back to the oldest light in the universe have new evidence to support the concept of inflation. The concept poses the universe expanded many trillion times its size in less than a trillionth of a second at the outset of the big bang.

This finding, made with NASA’s Wilkinson Microwave Anisotropy Probe (WMAP), is based on three years of continuous observations of the cosmic microwave background (CMB), the afterglow light produced when the universe was less than a million years old.

WMAP polarization data allow scientists to discriminate between competing models of inflation for the first time. This is a milestone in cosmology. “We can now distinguish between different versions of what happened within the first trillionth of a second of the universe,” said WMAP Principal Investigator Charles Bennett of the Johns Hopkins University in Baltimore. “The longer WMAP observes, the more it reveals about how our universe grew from microscopic quantum fluctuations to the vast expanses of stars and galaxies we see today.”

Previous WMAP results focused on the temperature variations of this light, which provided an accurate age of the universe and insights into its geometry and composition. The new WMAP observations give not only a more detailed temperature map, but also the first full-sky map of the polarization of the CMB. This major breakthrough will enable scientists to obtain much deeper insight into what happened within the first trillionth of a second of the universe. The WMAP results have been submitted to the Astrophysical Journal and are posted at

http://wmap.gsfc.nasa.gov/results

Big bang physics describes how matter and energy developed over the last 13.7 billion years. WMAP’s observation of the blanket of cool microwave radiation that permeates the universe shows patterns that mark the seeds of what grew into stars and galaxies. The patterns are tiny temperature differences within this extraordinarily uniform light. WMAP discerns temperature fluctuations at levels finer than a millionth of a degree.

WMAP can resolve features in the cosmic microwave background based on polarization, or the way light is changed by the environment through which it passes. For example, sunlight reflecting off of a shiny object is polarized. Comparing the brightness of broad features to compact features in the microwave background, or afterglow light, helps tell the story of the infant universe. One long-held prediction was the brightness would be the same for features of all sizes. In contrast, the simplest versions of inflation predict the relative brightness decreases as the features get small, a trend seen in the new data.

“This is brand new territory,” said WMAP team member Lyman Page of Princeton University in Princeton, N.J. “The polarization data will become stronger as WMAP continues to observe the microwave background. WMAP’s new results heighten the urgency of seeking out inflation’s gravitational wave sign. If gravitational waves are seen in future measurements, that would be solid evidence for inflation.”

With a richer temperature map and the new polarization map, WMAP data favor the simplest versions of inflation. Generically, inflation posits that, at the outset of the big bang, quantum fluctuations – short-lived bursts of energy at the subatomic level – were converted by the rapid inflationary expansion into fluctuations of matter that ultimately enabled stars and galaxies to form. The simplest versions of inflation predict that the largest-sized fluctuations will also be the strongest. The new results from WMAP favor this signature.

Inflation theory predicts that these same fluctuations also produced primordial gravitational waves whose distortion of space-time leaves a signature in the CMB polarization. This will be an important goal of future CMB measurements which, if found, would provide a stunning confirmation of inflation.

“Inflation was an amazing concept when it was first proposed 25 years ago, and now we can support it with real data,” said WMAP team member Gary Hinshaw of NASA’s Goddard Space Flight Center in Greenbelt, Md.

WMAP, a partnership between Goddard and Princeton, was launched on June 30, 2001. The WMAP team includes researchers in U.S. and Canadian universities and institutes. For images and information on the Web about WMAP, visit:
http://www.nasa.gov/vision/universe/wmap_pol.html

Original Source: NASA News Release

Night of the Living Dead… Stars

Artist’s view of an X-ray pulsar as seen by Integral. Image credit: NASA Click to enlarge
Like the shambling monsters in a zombie movie, the corpses of dead stars might have a little fight left in them after all. ESA’s Integral spacecraft has been analyzing some anomalous X-ray pulsars, which are thought to be neutron stars with powerful X-ray beams that regularly sweep past the Earth. Integral confirmed that these pulsars have magnetic fields billions of times stronger than anything created here on Earth.

Tiny stellar ‘corpses’ have been caught blasting surprisingly powerful X-rays and gamma rays across our galaxy by ESA’s gamma-ray observatory Integral.

This discovery links these objects to the most magnetically active bodies in the Universe and forces scientists to reconsider just how dead such stellar corpses really are.

Known as anomalous X-ray pulsars (AXPs), the stellar corpses were first spotted pulsing low-energy X-rays into space during the 1970s by the Uhuru X-ray satellite. AXPs are extremely rare with only seven known to exist. The X-rays were first thought to be produced by matter falling from a companion star onto the AXP.

An alternative was that each AXP is the spinning core of a dead star, known as a neutron star, sweeping beams of energy through space like a cosmic lighthouse. When these beams cross Earth?s line of sight, the AXP blinks on and off.

However, this scenario required the AXP’s magnetic field to be a thousand million times stronger than the strongest steady magnetic field achievable in a laboratory on Earth. Nevertheless, the Integral observations show that the magnetic solution is correct.

The newly detected emission, known to astronomers as a ‘hard tail’, of high-energy (‘hard’) X-rays and gamma rays also comes in the form of regular pulses every 6?12 seconds depending upon which AXP is observed.

Discovered in three of the four AXPs studied, the hard tails have a distinctive energy signature that forces astronomers to consider that they are produced by super-strong magnetic fields.

“The amount of energy in the hard tail is ten to almost one thousand times more than can be explained by a kind of magnetic friction between the spinning AXP and surrounding space,” said Wim Hermsen of SRON, the Netherlands Institute for Space Research, Utrecht, who together with SRON colleagues made the observations. This leaves so-called ‘magnetic field decay’ as the only viable alternative.

Neutron stars with super-strong magnetic fields are dubbed ‘magnetars’. Created from the core of a gigantic star that has exploded at the end of its life, each magnetar is only around 15 kilometres in diameter yet contains more than one and a half times the mass of the Sun.

Magnetars are also responsible for the ‘soft gamma-ray repeaters’ (SGRs), which explosively release massive quantities of energy when catastrophic reorganisations of their magnetic fields spontaneously take place. The big difference between an SGR and an AXP is that the process is continuous rather than explosive in an AXP and less energetic.

“Somehow these objects are tapping the enormous magnetic energy contained beneath their surfaces and funnelling it into space,” said Hermsen.

Exactly how that happens is the focus of future work. It is possible that SGRs, of which five are known, turn into AXPs once they have exploded enough of their energy into space.

All known AXPs except one are clustered towards the plane of our galaxy, the Milky Way, indicating that they are the result of recent stellar explosions; some are even wreathed in the exploded gaseous remnants of their former stars.

The other known AXP is in a satellite galaxy of the Milky Way. The hard tails were discovered by Integral serendipitously, thanks to its unique wide-field camera, the Imager on-Board Integral Satellite (IBIS).

“This is one of the things you hope for when you run an observatory like Integral,” said Christoph Winkler, ESA’s Integral project scientist. As the AXPs prove, the stellar afterlife is more alive than astronomers once thought.

Original Source: ESA Portal

Spitzer Sees Huge Clouds of Dust Around M82

An infrared image of the Cigar galaxy by Spitzer. Image credit: NASA/JPL Click to enlarge
NASA’s Spitzer Space Telescope has revealed a burning hot galaxy blowing out clouds of dust and smoke. The galaxy is M82, and it’s well known for vast regions of young, hot stars in stellar nurseries. In visible light, the galaxy looks fairly normal, but in Spitzer’s infrared view, it’s nestled inside an enormous cloud of dust. These clouds are the largest ever seen around a galaxy, stretching 20,000 light years from the galactic plane in both directions.

Where there’s smoke, there’s fire – even in outer space. A new infrared image from NASA’s Spitzer Space Telescope shows a burning hot galaxy whose fiery stars appear to be blowing out giant billows of smoky dust.

The galaxy, called Messier 82, or the “Cigar galaxy,” was previously known to host a hotbed of young, massive stars. The new Spitzer image reveals, for the first time, the “smoke” surrounding those stellar fires.

“We’ve never seen anything like this,” said Dr. Charles Engelbracht of the University of Arizona, Tucson. “This unusual galaxy has ejected an enormous amount of dust to cover itself with a cloud brighter than any we’ve seen around other galaxies.”

The false-colored view, online at http://www.spitzer.caltech.edu/Media , shows Messier 82, an irregular-shaped galaxy positioned on its side, as a diffuse bar of blue light. Fanning out from its top and bottom like the wings of a butterfly are huge red clouds of dust believed to contain a compound similar to car exhaust.

The smelly material, called polycyclic aromatic hydrocarbon, can be found on Earth in tailpipes, barbecue pits and other places where combustion reactions have occurred. In galaxies, the stuff is created by stars, whose winds and radiation blow the material out into space.

“Usually you see smoke before a fire, but we knew about the fire in this galaxy before Spitzer’s infrared eyes saw the smoke,” said Dr. David Leisawitz, Spitzer program scientist at NASA Headquarters in Washington.

These hazy clouds are some of the biggest ever seen around a galaxy. They stretch out 20,000 light-years away from the galactic plane in both directions, far beyond where stars are found.

Previous observations of Messier 82 had revealed two cone-shaped clouds of very hot gas projecting outward below and above the center of galaxy. Spitzer’s sensitive infrared vision allowed astronomers to see the galaxy’s dust.

“Spitzer showed us a dust halo all around this galaxy,” said Engelbracht. “We still don’t understand why the dust is all over the place and not cone-shaped.”

Cone-shaped clouds of dust around this galaxy would have indicated that its central, massive stars had sprayed the dust into space. Instead, Engelbracht and his team believe stars throughout the galaxy are sending off the “smoke signals.”

Messier 82 is located about 12 million light-years away in the Ursa Major constellation. It is undergoing a renaissance of star birth in its middle age, with the most intense bursts of star formation taking place at its core. The galaxy’s interaction with its neighbor, a larger galaxy called Messier 81, is the cause of all the stellar ruckus. Our own Milky Way galaxy is a less hectic place, with dust confined to the galactic plane.

The findings will appear in an upcoming issue of the Astrophysical Journal. Other authors who contributed significantly to this work are Praveen Kundurthy and Dr. Karl Gordon, both of the University of Arizona. The image was taken as a part of the Spitzer Infrared Nearby Galaxy Survey, which is led by Dr. Robert Kennicutt, also of the University of Arizona.

The Jet Propulsion Laboratory manages the Spitzer Space Telescope mission for NASA’s Science Mission Directorate, Washington. Science operations are conducted at the Spitzer Science Center at Caltech. JPL is a division of Caltech.

For more information about Spitzer, visit http://www.spitzer.caltech.edu/spitzer . For more information about NASA and agency programs on the Web, visit http://www.nasa.gov/home/ .

Original Source: NASA News Release

Early Galaxies Looked Similar

A group of the newly discovered galaxies by the Lyman-break technique. Image credit: Astronomy & Astrophysics. Click to enlarge
An international team of astronomers have performed one of the most detailed surveys of the most distant galaxies. These galaxies are so far away, we see them as they looked when the Universe was less than half its current age. One of the big surprises of this survey; however, is how much these young galaxies match the structures we see in the current Universe. This means that galaxies probably evolved through collisions and mergers much earlier than previously believed.

A team of astronomers from France, the USA, Japan, and Korea, led by Denis Burgarella has recently discovered new galaxies in the Early Universe. They have been detected for the first time both in the near-UV and in the far-infrared wavelengths. Their findings will be reported in a coming issue of Astronomy & Astrophysics. This discovery is a new step in understanding how galaxies evolve.

The astronomer Denis Burgarella (Observatoire Astronomique Marseille Provence, Laboratoire d’Astrophysique de Marseille, France) and his colleagues from France, the USA, Japan, and Korea, have recently announced their discovery of new galaxies in the Early Universe both for the first time in the near-UV and in the far-infrared wavelengths. This discovery leads to the first thorough investigation of early galaxies. The discovery will be reported in a coming issue of Astronomy & Astrophysics.

The knowledge of early galaxies has made major progress in the past ten years. From the end of 1995, astronomers have been using a new technique, known as the “Lyman-break technique”. This technique allows very distant galaxies to be detected. They are seen as they were when the Universe was much younger, thus providing clues to how galaxies formed and evolved. The Lyman-break technique has moved the frontier of distant galaxy surveys further up to redshift z=6-7 (that is about 5% of the present age of the Universe). In astronomy, the redshift denotes the shift of a light wave from a galaxy moving away from the Earth. The light wave is shifted toward longer wavelengths, that is, toward the red end of the spectrum. The higher the redshift of a galaxy is, the farther it is from us.

The Lyman-break technique is based on the characteristic “disappearance” of distant galaxies observed in the far-UV wavelengths. As light from a distant galaxy is almost fully absorbed by hydrogen at 0.912 nm (due to the absorption lines of hydrogen, discovered by the physicist Theodore Lyman), the galaxy “disappears” in the far-ultraviolet filter. Figure 2 illustrates the ?disappearance? of the galaxy in the far-UV filter. The Lyman discontinuity should theoretically occur at 0.912 nm. Photons at shorter wavelengths are absorbed by hydrogen around stars or within the observed galaxies. For high-redshift galaxies, the Lyman discontinuity is redshifted so that it occurs at a longer wavelength and can be observed from the Earth. From ground-based observations, astronomers can currently detect galaxies with a redshift range of z~3 to z~6. However, once detected, it is still very difficult to obtain additional information on these galaxies because they are very faint.

For the first time, Denis Burgarella and his team have been able to detect less distant galaxies via the Lyman-break technique. The team collected data from various origins: UV data from the NASA GALEX satellite, infrared data from the SPITZER satellite, and data in the visible range at ESO telescopes. From these data, they selected about 300 galaxies showing a far-UV disappearance. These galaxies have a redshift ranging from 0.9 to 1.3, that is, they are observed at a moment when the Universe had less than half of its current age. This is the first time a large sample of Lyman Break Galaxies is discovered at z~1. As these galaxies are less distant than the samples observed up to now, they are also brighter and easier to study at all wavelengths thereby allowing a deep analysis from UV to infrared to be performed.

Previous observations of distant galaxies have led to the discovery of two classes of galaxies, one of which includes galaxies that emit light in the near-UV and visible wavelength ranges. The other type of galaxy emits light in the infrared (IR) and submillimeter ranges. The UV galaxies were not observed in the infrared range, while IR galaxies were not observed in the UV. It was thus difficult to explain how such galaxies could evolve into present-day galaxies that emit light at all wavelengths. With their work, Denis Burgarella and his colleagues have taken a step toward solving this problem. When observing their new sample of z~1 galaxies, they found that about 40% of these galaxies emit light in the infrared range as well. This is the first time a significant number of distant galaxies were observed both in the UV and IR wavelength ranges, incorporating the properties of both major types.

From their observations of this sample, the team also inferred various information about these galaxies. Combining UV and infrared measurements makes it possible to determine the formation rate for stars in these distant galaxies for the first time. Stars form there very actively, at a rate of a few hundred to one thousand stars per year (only a few stars currently form in our Galaxy each year). The team also studied their morphology, and show that most of them are spiral galaxies. Up to now, distant galaxies were believed to be mainly interacting galaxies, with irregular and complex shapes. Denis Burgarella and his colleagues have now shown that the galaxies in their sample, seen when the Universe had about 40% of its current age, have regular shapes, similar to present-day galaxies like ours. They bring a new element to our understanding of the evolution of the galaxies.

Original Source: Astronomy & Astrophysics News Release