Discovery Launch Window Set for July

The crew of STS-121 and the space shuttle. Image credit: NASA. Click to enlarge.
The launch of the space shuttle Discovery has been pushed back until July to give engineers time to fix a sensor on the external fuel tank. The new launch window opens up on July 1, and lasts until July 19, 2006. If all goes well, Discovery will lift off and rendezvous with the International Space Station. The 7-member crew of astronauts will deliver supplies to the station, and continue testing post-Columbia upgrades and repair techniques.

NASA announced today July 1 to 19, 2006, is the new launch planning window for Space Shuttle Discovery’s mission (STS-121). The window gives the agency time to do additional engineering work and analysis to ensure a safe flight for Discovery and its crew.

Space Shuttle Program Manager Wayne Hale made the announcement during a news conference from NASA’s Johnson Space Center in Houston. The decision to target July followed a two-day meeting on the external fuel tank’s engine cutoff (ECO) sensors. The sensors indicate whether the tank still has fuel during liftoff. During testing, one of the four ECO sensors had a slightly different reading than is expected. Shuttle officials have decided they will remove and replace all four liquid hydrogen sensors.

“We’ve been saying for months that our engineering work would determine when we fly our next mission. Targeting July is the right choice in order to make smart decisions,” said Bill Gerstenmaier, NASA associate administrator for Space Operations.

Other issues factored into the decision to adjust the STS-121 planning window:

* Testing and analysis are required on the shuttle’s modified external tank. The testing will help verify the tank is safe to fly without the protuberance air load (PAL) foam ramp. The PAL ramp was removed after a large piece of foam fell from that area during Discovery’s July 2005 launch. More analysis is needed to decide whether changes are needed on the tank’s ice frost foam ramps.

* Repair work on the shuttle’s robotic arm must be completed. Technicians on a work platform accidentally bumped the arm last week, causing a tiny crack. The arm will be removed for repair.

The STS-121 mission will take Shuttle Commander Steve Lindsey and six crew members to the International Space Station. This is the second mission in the Return to Flight sequence to evaluate new heat shield inspection and repair techniques and to deliver supplies and equipment to the station.

For information about the Space Shuttle Program, the STS-121 mission and its crew, visit:
http://www.nasa.gov/shuttle

Original Source: NASA News Release

Galaxies Are Colliding All the Time

An artist’s impression of two colliding galaxies. Image credit: ESO Click to enlarge
Dark matter is a mysterious substance that appears to account for 25% of the mass of the Universe. We can’t see it, but we can measure the effect of its gravity; this can reveal information about galactic structure and formation. European astronomers have measured the amount of dark matter in several galaxies, and found that a large portion of them are out of balance; their internal motions are very disturbed. This means that many galaxies – as much as 40% – have recently gone through mergers or near collisions.

Studying several tens of distant galaxies, an international team of astronomers found that galaxies had the same amount of dark matter relative to stars 6 billion years ago as they have now. If confirmed, this suggests a much closer interplay between dark and normal matter than previously believed. The scientists also found that as many as 4 out of 10 galaxies are out of balance. These results shed a new light on how galaxies form and evolve since the Universe was only half its current age.

“This may imply that collisions and merging are important in the formation and evolution of galaxies”, said Francois Hammer, Paris Observatory, France, and one of the leaders of the team.

The scientists were interested in finding out how galaxies that are far away – thus seen as they were when the Universe was younger – evolved into the ones nearby. In particular, they wanted to study the importance of dark matter in galaxies.

“Dark matter, which composes about 25% of the Universe, is a simple word to describe something we really don’t understand,” said Hector Flores, co-leader. “From looking at how galaxy rotates, we know that dark matter must be present, as otherwise these gigantic structures would just dissolve.”

In nearby galaxies, and in our own Milky Way for that matter, astronomers have found that there exist a relation between the amount of dark matter and ordinary stars: for every kilogram of material within a star there is roughly 30 kilograms of dark matter. But does this relation between dark and ordinary matter still hold in the Universe’s past?

This required measuring the velocity in different parts of distant galaxies, a rather tricky experiment: previous measurements were indeed unable to probe these galaxies in sufficient details, since they had to select a single slit, i.e. a single direction, across the galaxy.

Things changed with the availability of the multi-object GIRAFFE spectrograph, now installed on the 8.2-m Kueyen Unit Telescope of ESO’s Very Large Telescope (VLT) at the Paranal Observatory (Chile).

In one mode, known as “3-D spectroscopy” or “integrated field”, this instrument can obtain simultaneous spectra of smaller areas of extended objects like galaxies or nebulae. For this, 15 deployable fibre bundles, the so-called Integral Field Units (IFUs) , cf. ESO PR 01/02 , are used to make meticulous measurements of distant galaxies. Each IFU is a microscopic, state-of-the-art two-dimensional lens array with an aperture of 3 x 2 arcsec2 on the sky. It is like an insect’s eye, with twenty micro-lenses coupled with optical fibres leading the light recorded at each point in the field to the entry slit of the spectrograph.

“GIRAFFE on ESO’s VLT is the only instrument in the world that is able to analyze simultaneously the light coming from 15 galaxies covering a field of view almost as large as the full moon,” said Mathieu Puech, lead author of one the papers presenting the results. “Every galaxy observed in this mode is split into continuous smaller areas where spectra are obtained at the same time.”

The astronomers used GIRAFFE to measure the velocity fields of several tens of distant galaxies, leading to the surprising discovery that as much as 40% of distant galaxies were “out of balance” – their internal motions were very disturbed – a possible sign that they are still showing the aftermath of collisions between galaxies.

When they limited themselves to only those galaxies that have apparently reached their equilibrium, the scientists found that the relation between the dark matter and the stellar content did not appear to have evolved during the last 6 billions years.

Thanks to its exquisite spectral resolution, GIRAFFE also allows for the first time to study the distribution of gas as a function of its density in such distant galaxies. The most spectacular results reveal a possible outflow of gas and energy driven by the intense star-formation within the galaxy and a giant region of very hot gas (HII region) in a galaxy in equilibrium that produces many stars.

“Such a technique can be expanded to obtain maps of many physical and chemical characteristics of distant galaxies, enabling us to study in detail how they assembled their mass during their entire life,” said Fran?ois Hammer. “In many respects, GIRAFFE and its multi-integral field mode gives us a first flavour of what will be achieved with future extremely large telescopes.”

Original Source: ESO News Release

Strange Helix-Shaped Nebula Discovered

The double helix nebula. Image credit: NASA/UCLA Click to enlarge
Astronomers have discovered an unusual helix-shaped nebula near the centre of the Milky Way. This peculiar nebula stretches 80 light years, and looks like the classic image of a DNA molecule. The nebula formed because it’s so close to the supermassive black hole at the heart of the Milky Way, which has a very powerful magnetic field. This field isn’t as powerful as the one surrounding the Sun, but it’s enormous, containing a tremendous amount of energy. It’s enough to reach out this incredible distance and twist up this gas cloud with its field lines.

Astronomers report an unprecedented elongated double helix nebula near the center of our Milky Way galaxy, using observations from NASA’s Spitzer Space Telescope. The part of the nebula the astronomers observed stretches 80 light years in length. The research is published March 16 in the journal Nature.

“We see two intertwining strands wrapped around each other as in a DNA molecule,” said Mark Morris, a UCLA professor of physics and astronomy, and lead author. “Nobody has ever seen anything like that before in the cosmic realm. Most nebulae are either spiral galaxies full of stars or formless amorphous conglomerations of dust and gas – space weather. What we see indicates a high degree of order.”

The double helix nebula is approximately 300 light years from the enormous black hole at the center of the Milky Way. (The Earth is more than 25,000 light years from the black hole at the galactic center.)

The Spitzer Space Telescope, an infrared telescope, is imaging the sky at unprecedented sensitivity and resolution; Spitzer’s sensitivity and spatial resolution were required to see the double helix nebula clearly.

“We know the galactic center has a strong magnetic field that is highly ordered and that the magnetic field lines are oriented perpendicular to the plane of the galaxy,” Morris said. “If you take these magnetic field lines and twist them at their base, that sends what is called a torsional wave up the magnetic field lines.

“You can regard these magnetic field lines as akin to a taut rubber band,” Morris added. “If you twist one end, the twist will travel up the rubber band.”

Offering another analogy, he said the wave is like what you see if you take a long loose rope attached at its far end, throw a loop, and watch the loop travel down the rope.

“That’s what is being sent down the magnetic field lines of our galaxy,” Morris said. “We see this twisting torsional wave propagating out. We don’t see it move because it takes 100,000 years to move from where we think it was launched to where we now see it, but it’s moving fast – about 1,000 kilometers per second – because the magnetic field is so strong at the galactic center – about 1,000 times stronger than where we are in the galaxy’s suburbs.”

A strong, large-scale magnetic field can affect the galactic orbits of molecular clouds by exerting a drag on them. It can inhibit star formation, and can guide a wind of cosmic rays away from the central region; understanding this strong magnetic field is important for understanding quasars and violent phenomena in a galactic nucleus. Morris will continue to probe the magnetic field at the galactic center in future research.

This magnetic field is strong enough to cause activity that does not occur elsewhere in the galaxy; the magnetic energy near the galactic center is capable of altering the activity of our galactic nucleus and by analogy the nuclei of many galaxies, including quasars, which are among the most luminous objects in the universe. All galaxies that have a well-concentrated galactic center may also have a strong magnetic field at their center, Morris said, but so far, ours is the only galaxy where the view is good enough to study it.

Morris has argued for many years that the magnetic field at the galactic center is extremely strong; the research published in Nature strongly supports that view.

The magnetic field at the galactic center, though 1,000 times weaker than the magnetic field on the sun, occupies such a large volume that it has vastly more energy than the magnetic field on the sun. It has the energy equivalent of 1,000 supernovae.

What launches the wave, twisting the magnetic field lines near the center of the Milky Way? Morris thinks the answer is not the monstrous black hole at the galactic center, at least not directly.

Orbiting the black hole like the rings of Saturn, several light years away, is a massive disk of gas called the circumnuclear disk; Morris hypothesizes that the magnetic field lines are anchored in this disk. The disk orbits the black hole approximately once every 10,000 years.

“Once every 10,000 years is exactly what we need to explain the twisting of the magnetic field lines that we see in the double helix nebula,” Morris said.

Co-authors on the Nature paper are Keven Uchida, a former UCLA graduate student and former member of Cornell University’s Center for Radiophysics and Space Research; and Tuan Do, a UCLA astronomy graduate student. Morris and his UCLA colleagues study the galactic center at all wavelengths.

NASA’s Jet Propulsion Laboratory in Pasadena, Calif., manages the Spitzer Space Telescope mission for the agency’s Science Mission Directorate. Science operations are conducted at the Spitzer Science Center at the California Institute of Technology. JPL is a division of Caltech. NASA funded the research.

Original Source: UCLA News Release

Hubble Pins Down Brown Dwarf Masses

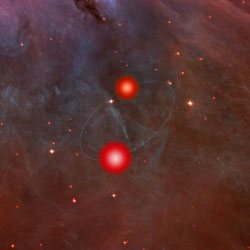
Artist illustration of brown dwarf binary pair. Image credit: Hubble. Click to enlarge.
One of the most difficult tasks for astronomers is to figure out how massive distant objects are. Once you find objects orbiting one another; however, it’s relatively easy to do. The Hubble Space Telescope has helped astronomers measure the mass of a binary pair of brown dwarfs – failed stars – as they orbit one another. One dwarf is 55 times the mass of Jupiter, and the other is 35 times the mass. Each would have to be 80 times the mass of Jupiter before they had enough mass to ignite a fusion reaction.

For the first time, astronomers have succeeded in weighing a binary pair of brown dwarfs and precisely measuring their diameters. These kinds of exact measurements are not possible when observing a single brown dwarf.

Because their orbits are inclined edge-on to Earth, the dwarfs pass in front of each other, creating eclipses. This is the first brown dwarf-eclipsing binary ever discovered. The pair offers an unusual opportunity for accurately determining the masses and diameters of the dwarfs, providing crucial tests of theoretical models.

A brown dwarf is a little understood intermediate class of celestial object that is too small to sustain hydrogen fusion reactions, like those that power our Sun. However, brown dwarfs are dozens of times more massive than the Solar System’s largest planet, Jupiter, and so are too large to be a planet.

The discovery of the paired brown dwarfs and the critical measurements are reported today in the scientific journal Nature by a team of astronomers: Jeff Valenti of the Space Telescope Science Institute (STScI), Robert Mathieu of the University of Wisconsin-Madison, and Keivan Stassun of Vanderbilt University.

One dwarf is 55 times Jupiter’s mass; the other is 35 times heftier than Jupiter (with a 10 percent margin of error). To qualify as a star and burn hydrogen through nuclear fusion, the dwarfs would have to be 80 times more massive than Jupiter. For comparison, the Sun is 1,000 times more massive than Jupiter.

The astronomers are surprised to discover that the more massive brown dwarf is the cooler of the pair, contrary to all predictions about brown dwarfs of the same age. Either the two are not the same age and may be captured bodies, or the theoretical models are wrong, say researchers.

The brown dwarf pair orbits each other so closely that they look like a single object when viewed from Earth. Because their racetrack orbit is edge-on, the two objects periodically pass in front of, or eclipse, each other. These eclipses cause regular dips in the brightness of the combined light coming from both objects. By precisely timing these occultations the astronomers were able to determine the orbits of the two objects. With this information, the astronomers used Newton’s laws of motion to calculate the mass of the two dwarfs.

In addition, the astronomers calculated the size of the two dwarfs by measuring the duration of the dips in their light curve. Because they are so young, the dwarfs are remarkably large for their mass: about the same diameter as the Sun. Because the pair is located in the Orion Nebula, which is a nearby stellar nursery with stars less than 10 million years old.

An analysis of the light coming from the dwarf pair indicates that the dwarfs have a reddish cast. Current models also predict that brown dwarfs should have “weather” — cloud-like bands and spots similar to those visible on Jupiter and Saturn.

By measuring variations in the light spectrum coming from the pair, the astronomers also determined the dwarfs’ surface temperatures. Theory predicts that the more massive member of a pair of brown dwarfs should have a higher surface temperature. But they found just the opposite. The heavier of the two has a temperature of 4,310 degrees Fahrenheit (2,650 degrees Kelvin) and the smaller, 4,562 degrees F (2,790 degrees K). These compare to the Sun’s surface temperature of 9,980 degrees F (5,800 degrees K).

“One possible explanation is that the two objects have different origins and ages,” Stassun says. If that is the case, then it supports one of the outcomes of the latest efforts to simulate the star-formation process. These simulations predict that brown dwarfs are created so close together that they are likely to disrupt each other’s formation.

The new observations confirm the theoretical prediction that brown dwarfs start out as star-sized objects, but shrink and cool and become increasingly planet-sized as they age. Before now, the only brown dwarf whose mass had been directly measured was much older and dimmer.

Many astronomers think that brown dwarfs may actually be the most common product of the stellar-formation process. So, information about brown dwarfs can provide valuable new insights into the dynamic processes that produce stars out of collapsing whirlpools of interstellar dust and gas.

Because old brown dwarfs are smaller and dimmer than true stars, it is only in recent years that improvements in telescope technology have allowed astronomers to catalog hundreds of faint objects that they think may be brown dwarfs. But to pick out the brown dwarfs from other types of faint objects, they need a way to estimate their masses, because mass is destiny for stars and star-like objects.

The existence of brown dwarfs was first proposed in the 1980s, but it wasn’t until 2000 that a brown dwarf was detected unambiguously. While brown dwarfs were hypothetical objects, astronomers differentiated them from planets by the manner in which they formed. Brown dwarfs and stars are formed in the same way, from a collapsing cloud of interstellar dust and gas. Planets are built from the disks of dust and gas that surround forming stars. Once astronomers discovered the first candidate brown dwarf, they realized that dwarfs are very difficult to differentiate from planets, particularly when they have stellar companions. So a growing group of astronomers favor defining brown dwarfs as objects between 13 to 80 times more massive than Jupiter.

The researchers made the observations with two sets of telescopes located in the Chilean Andes, about 100 miles north of Santiago: the Small and Moderate Aperture Research Telescope System (SMARTS), operated by a consortium including the Space Telescope Science Institute and Vanderbilt University, and the International Gemini Observatory, operated by the National Science Foundation.

Original Source: Hubble News Release

Enceladus Replenishes Saturn’s E-Ring

Saturn’s moon Enceladus. Image credit: NASA/JPL/SSI Click to enlarge
Now that Cassini has uncovered how Enceladus is spewing out water ice from geysers at its southern pole, scientists have an explanation for Saturn’s E ring. This is Saturn’s outermost ring, which consists of a diffuse cloud of particles stretching from Mimas to Titan. Cassini’s magnetometer matched the signature of the ice geysers to the particles in the E-ring, linking one to the together.

Saturn’s moon Enceladus is the source of Saturn’s E-ring, confirms research published today.

Writing in the journal Science, scientists show how a plume of icy water vapour bursting out of the South Pole of Enceladus replenishes the water particles that make up the E-ring and creates a dynamic water-based atmosphere around the small moon. The E-ring is Saturn’s outermost ring and is composed of microscopic particles. It is very diffuse and stretches between the orbit of two of Saturn’s moons, Mimas and Titan.

Scientists discovered the dynamic atmosphere during three separate fly-bys of Enceladus by the Cassini spacecraft in February, March and July 2005. Cassini Huygens is a joint NASA/ESA mission to study the Saturnian system.

The team working on results from the magnetometer instrument were surprised to discover what they believed was an atmosphere on their first fly-by, 1176km from the moon’s surface. After a second flyby at 500km confirmed their observations, they persuaded the Cassini Project to take the next flyby much closer to Enceladus in order to investigate further.

On this flyby, at 175km, measurements from all the different instruments on the spacecraft confirmed the presence of an atmosphere. Later remote sensing observations of the moon revealed a plume of water vapour coming from the moon’s South Pole.

The atmosphere was also seen to change between the flybys, with a particularly extended atmosphere observed during the first one and a more concentrated atmosphere seen during subsequent flybys. The team believe that changing levels of activity by the plume at the South Pole were causing these changes in the atmosphere.

Professor Michele Dougherty, from Imperial College London’s Department of Space and Atmospheric Physics, Principal Investigator on Cassini’s magnetometer instrument and lead author of one of the papers, said: “When we observed signatures of an atmosphere on the first distant flyby we were very surprised because it was so unexpected to observe such signatures so far away from the moon.

“It was extremely exciting to have all the other instruments confirm our initial discovery, particularly when it was found that the atmosphere was changing from flyby to flyby and was closely linked with the subsequent plume observations at the South Pole. In addition this discovery clearly shows the importance of having a multi-instrument spacecraft such as Cassini since it enables us to combine a whole range of different data sets thereby allowing us to gain a much better overall understanding of complex physical systems.

Measurements of the temperature of Enceladus showed that, surprisingly, there is a concentration of heat around the South Pole, with the hottest point located over one of the fractures in the planet’s surface. The scientists believe that this heat signature shows internal processes within Enceladus causing the icy plume, by heating the moon’s ice.

Original Source: PPARC News Release

Some Comet Material Formed Close to the Sun

Slice of comet dust trapped in an aerogel. Image credit: NASA Click to enlarge
Scientists studying cometary particles returned by NASA’s Stardust spacecraft have come across some surprising results, calling traditional theories about cometary formation into question. Comets are thought to form in the outer reaches of the Solar System, but Stardust returned minerals that only form in the high temperatures near the Sun. How did these minerals get inside Comet Wild-2? It supports a theory that our Sun had strong bipolar jets early on, which flung material into the far reaches of the Solar System.

Samples from comet Wild 2 have surprised scientists, indicating the formation of at least some comets may have included materials ejected by the early sun to the far reaches of the solar system.

Scientists have found minerals formed near the sun or other stars in the samples returned to Earth by NASA’s Stardust spacecraft in January. The findings suggest materials from the center of the solar system could have traveled to the outer reaches where comets formed. This may alter the way scientists view the formation and composition of comets.

“The interesting thing is we are finding these high-temperature minerals in materials from the coldest place in the solar system,” said Donald Brownlee, Stardust principal investigator from the University of Washington, Seattle.

Scientists have long thought of comets as cold, billowing clouds of ice, dust and gases formed on the edges of the solar system. But comets may not be so simple or similar. They may prove to be diverse bodies with complex histories. Comet Wild 2 seems to have had a more complex history than thought.

“We have found very high-temperature minerals, which supports a particular model where strong bipolar jets coming out of the early sun propelled material formed near to the sun outward to the outer reaches of the solar system,” said Michael Zolensky, Stardust curator and co-investigator at NASA’s Johnson Space Center, Houston. “It seems that comets are not composed entirely of volatile rich materials but rather are a mixture of materials formed at all temperature ranges, at places very near the early sun and at places very remote from it.”

One mineral found in the material brought back by Stardust is olivine, a primary component of the green sand found on some Hawaiian beaches. It is among the most common minerals in the universe, but scientists were surprised to find it in cometary dust.

Olivine is a compound of iron, magnesium and other elements. The Stardust sample is primarily magnesium. Along with olivine, the dust from Wild 2 contains high-temperature minerals rich in calcium, aluminum and titanium.

Stardust passed within 149 miles of comet Wild 2 in January 2004, trapping particles from the comet in an exposed gel. Its return capsule parachuted to the Utah desert on Jan. 15. The science canister with the Wild 2 sample arrived at Johnson on Jan. 17. Samples have been distributed to approximately 150 scientists for study.

“The collection of cometary particles is greater than we ever expected,” said Stardust Deputy Principal Investigator Peter Tsou of NASA’s Jet Propulsion Laboratory, Pasadena, Calif. “The collection includes about two dozen large tracks visible to the unaided eye.”

The grains are tiny, most smaller than a hair’s width. Thousands of them appear to be embedded in the glass-like aerogel. A single grain of 10 microns, only one-hundredth of a millimeter (.0004 inches), can be sliced into hundreds of samples for scientists.

In addition to cometary particles, Stardust gathered interstellar dust samples during its seven-year journey. The team at Johnson’s curatorial facility hopes to begin detailed scanning of the interstellar tray within a month. They will initiate the Stardust at Home project. It will enable volunteers from the public to help scientists locate particles.

After registering, Stardust at Home participants may download a virtual microscope. The microscope will connect to a server and download “focus movies.” The movies are images of the Stardust Interstellar Dust Collector from an automated microscope at the Cosmic Dust Lab at Johnson. Participants will search each field for interstellar dust impacts.

NASA’s Jet Propulsion Laboratory, Pasadena, Calif., manages the Stardust mission for NASA’s Science Mission Directorate, Washington. Lockheed Martin Space Systems, Denver, developed and operated the spacecraft.

Stardust science team members presented their first findings this week at the annual Lunar and Planetary Science Conference in League City, Texas.

For more information about Stardust on the Web, visit:
http://www.nasa.gov/stardust

Original Source: NASA News Release

Giotto Met Halley 20 Years Ago

An artist’s impression of Giotto’s brief encounter with comet Halley. Image credit: ESA Click to enlarge
This week the European Space Agency celebrated the 20-year anniversary of the Giotto spacecraft’s encounter with Comet Halley. This was ESA’s first deep space mission, which launched on board an Ariane 1 rocket. Giotto flew for 8 months, traveling almost 150 million kilometres. It swept past the comet on March 13, 1986, getting as close as 596 km (370 miles), and delivered the best pictures ever seen of a comet’s nucleus.

Twenty years ago, in the night between 13 and 14 March 1986, ESA’s Giotto spacecraft encountered Comet Halley. It was ESA’s first deep space mission, and part of an ambitious international effort to solve the riddles surrounding this mysterious object.

The adventure began when Giotto was launched by an Ariane 1 rocket (flight V14) on 2 July 1985. After three revolutions around the Earth, the on-board motor was fired to inject it into an interplanetary orbit.

After a cruise of eight months and almost 150 million kilometres, the spacecraft’s instruments first detected hydrogen ions from Halley at a distance of 7.8 million kilometres from the comet on 12 March 1986.

Giotto encountered Comet Halley about one day later, when it crossed the bow shock of the solar wind (the region where a shock wave is created as the supersonic solar particles slow to subsonic speed). When Giotto entered the densest part of the dusty coma, the camera began tracking the brightest object (the nucleus) in its field of view.

Excitement rose at the European Space Operations Centre in Darmstadt, Germany, as the first fuzzy images and data came in. The ten experiment teams scrutinised the latest information and struggled to come up with a preliminary analysis.

The first of 12 000 dust impacts was recorded 122 minutes before closest approach. Images were transmitted as Giotto closed in to within a distance of approximately 2000 kilometres, as the rate of dust impacts rose sharply and the spacecraft passed through a jet of material that streamed away from the nucleus.

The spacecraft was travelling at a speed of 68 kilometres per second relative to the comet. At 7.6 seconds before closest approach, the spacecraft was sent spinning by an impact from a ‘large’ (one gram) particle. Monitor screens went blank as contact with Earth was temporarily lost.

TV audiences and anxious Giotto team members feared the worst but, to everyone’s amazement, occasional bursts of information began to come through. Giotto was still alive.

Over the next 32 minutes, the sturdy spacecraft’s thrusters stabilised its motion and contact was fully restored. By then, Giotto had passed within 596 kilometres of the nucleus and was heading back into interplanetary space.

The remarkably resilient little spacecraft continued to return scientific data for another 24 hours on the outward journey. The last dust impact was detected 49 minutes after closest approach. The historic encounter ended 15 March when Giotto’s experiments were turned off.

Original Source: ESA Portal

Satellites Can Track Epidemics

Dust storms are being mapped for the ESA-led Epidemio project. Image credit: ESA Click to enlarge
All those eyes in the sky are coming in handy for purposes scientists never imagined. Now researchers from ESA are using Envisat data to track places on Earth where disease epidemics could get started. The team was able to link the outbreak of diseases in Africa with dryness and drought. So far they’ve been able to track regions which are dry, which contribute to the spread of meningitis. Aid workers can then target these regions to give vaccinations and provide early warnings.

The amount of data acquired by satellites is increasing at an exponential rate, and researchers are learning about the value of this data in fighting epidemic outbreaks as a result of the ESA’s Epidemio project.

“I was negative about the role satellites could play in addressing epidemics, but now I am positive,” Penelope Vernatsou of the Swiss Tropical Institute in Switzerland said.

The ESA-funded Epidemio project was developed in January 2004 to illustrate the benefits of remote-sensing data for studying, monitoring and predicting epidemic outbreaks.

By using data which focuses on a region’s landscape ? rainfall, vegetation, water bodies, elevation, dust mapping and temperature ? researchers are able to pinpoint climatic conditions which are favourable for harbouring various epidemic hosts, indicating where people are at greatest risk.

As the project draws to completion, epidemiologists and data users gathered in Frascati, Italy, at the ‘Earth Observation in Epidemiology Workshop’, on 8-10 March 2006, to report on how Earth observation (EO) has benefited the field of epidemiology.

Ghislain Moussavou of the Gabon-based International Centre for Medical Research (CIRMF) began studying Ebola haemorrhagic fever, which can cause runaway internal and external bleeding in humans and apes, in Congo and Gabon in the hope of spotting particular environmental characteristics associated with infected sites.

Combining ESA Envisat satellite data, under the Epidemio project, on water bodies, forest cover and digital elevation models (DEMs) with field results, Moussavou and his team were able to link the epidemic with dryness and drought.

Moussavou said determining these factors will allow officials to tell the villagers in the area that current conditions for transmission are high, and that they need to take extra precautions. “Because there are no medicines to prevent or cure Ebola, predictions and prevention are necessary.”

Dry conditions are also favourable for the spread of meningitis, an inflammation of the brain and spinal cord lining. Epidemics nearly always start in the early part of the dry season when it is hot and dusty. For this reason, ESA has been providing dust maps for high-risk areas to aid in implementing early warning systems.

Christelle Barbey of Silogic, in France, is currently involved in an Epidemio project to provide wind blown dust maps for Africa. Although her final results are still coming in, she was able to detect 100 percent of known dust events, using MeteoSat data, and determine that dust maps do correspond to a user need to contribute to meningitis prevention.

The Epidemio project – funded by the Data User Element of the ESA Earth Observation Envelope Programme – concludes its two-year mission in April 2006, but the groundwork it has laid will aid users in the continuance of their research and allow new projects to be undertaken.

Giuseppe Ottavianelli and Aude de Clercq of the HISTAR Solutions in the Netherlands are currently working on a project, backed by ESA business incubator financing, to confirm the onset of malaria epidemics in Africa, as predicted by remote sensing data.

They have designed a prototype of a sensor located in a box that detects mosquitoes as they fly overhead. The data collected by the sensor is then processed by a program inside the box, which will be placed in hat hutches in high-risk African villages, and indicates the species and numbers of the mosquitoes detected.

Malaria is transferred by the female mosquito of the species Anopheles, so if the sensor detects her presence in high numbers, public officials will be alerted so that preventive measures can be put into place.

Original Source: ESA Portal

Mars Orbiter Survives Its Journey to the Red Planet

Artist’s concept of MRO in orbit at Mars. Image credit: NASA/JPL Click to enlarge
Data transmitted back to Earth by NASA’s Mars Reconnaissance Orbiter indicates that the spacecraft successfully inserted itself into orbit around the Red Planet. It fired its main thrusters long enough to slow down its speed so Mars could capture it a wide orbit. The spacecraft will spend the next half-year aerobraking to lower down into a nearly circular orbit. Its instruments will be capable of resolving the Martian surface better than any spacecraft currently orbiting Mars.

With a crucially timed firing of its main engines today, NASA’s new mission to Mars successfully put itself into orbit around the red planet.

The spacecraft, Mars Reconnaissance Orbiter, will provide more science data than all previous Mars missions combined.

Signals received from the spacecraft at 2:16 p.m. Pacific Time after it emerged from its first pass behind Mars set off cheers and applause in control rooms at NASA’s Jet Propulsion Laboratory, Pasadena, Calif., and at Lockheed Martin Space Systems, Denver.

“This is a great milestone to have accomplished, but it’s just one of many milestones before we can open the champagne,” said Colleen Hartman, deputy associate administrator for NASA’s Science Mission Directorate. “Once we are in the prime science orbit, the spacecraft will perform observations of the atmosphere, surface, and subsurface of Mars in unprecedented detail.”

The spacecraft traveled about 500 million kilometers (310 million miles) to reach Mars after its launch from Florida on Aug. 12, 2005. It needed to use its main thrusters as it neared the planet in order to slow itself enough for Mars’ gravity to capture it. The thruster firing began while the spacecraft was still in radio contact with Earth, but needed to end during a tense half hour of radio silence while the spacecraft flew behind Mars.

“Our spacecraft has finally become an orbiter,” said JPL’s Jim Graf, project manager for the mission. “The celebration feels great, but it will be very brief because before we start our main science phase, we still have six months of challenging work to adjust the orbit to the right size and shape.”

For the next half-year, the mission will use hundreds of carefully calculated dips into Mars’ atmosphere in a process called “aerobraking.” This will shrink its orbit from the elongated ellipse it is now flying, to a nearly circular two-hour orbit. For the mission’s principal science phase, scheduled to begin in November, the desired orbit is a nearly circular loop ranging from 320 kilometers (199 miles) to 255 kilometers (158 miles) in altitude, lower than any previous Mars orbiter. To go directly into such an orbit instead of using aerobraking, the mission would have needed to carry about 70 percent more fuel when it launched.

The instruments on Mars Reconnaissance Orbiter will examine the planet from this low-altitude orbit. A spectrometer will map water-related minerals in patches as small as a baseball infield. A radar instrument will probe for underground layers of rock and water. One telescopic camera will resolve features as small as a card table. Another will put the highest-resolution images into broader context. A color camera will monitor the entire planet daily for changes in weather. A radiometer will check each layer of the atmosphere for variations in temperature, water vapor and dust.

“The missions currently at Mars have each advanced what we know about the presence and history of water on Mars, and one of the main goals for Mars Reconnaissance Orbiter is to decipher when water was on the surface and where it is now,” said JPL’s Dr. Richard Zurek, project scientist for the mission. “Water is essential for life, so that will help focus future studies of whether Mars has ever supported life.”

The orbiter can radio data to Earth at up to 10 times the rate of any previous Mars mission. Besides sending home the pictures and other information from its own investigations, it will relay data from surface missions, including NASA’s Phoenix Mars Scout scheduled for launch in 2007 and Mars Science Laboratory in development for 2009.

Additional information about Mars Reconnaissance Orbiter is available online at:

http://www.nasa.gov/mro

The mission is managed by JPL, a division of the California Institute of Technology, Pasadena, for the NASA Science Mission Directorate, Washington. Lockheed Martin Space Systems, Denver, is the prime contractor for the project and built the spacecraft.

Original Source: NASA News Release

Next Solar Max Will Be a Big One

Illustration of the “conveyor belt” on the Sun. Image credit: NASA. Click to enlarge.
We’ve now reached the Sun’s solar minimum; there’s not a sunspot anywhere across the surface of our closest star. Give it a few years, though, and it should be anything but quiet. Solar researchers think they understand the long term cycles of solar activity, and they’re predicting that the next Solar Maximum – expected to arrive between 2010 and 2012 – will be the strongest in 50 years.

It’s official: Solar minimum has arrived. Sunspots have all but vanished. Solar flares are nonexistent. The sun is utterly quiet.

Like the quiet before a storm.

This week researchers announced that a storm is coming–the most intense solar maximum in fifty years. The prediction comes from a team led by Mausumi Dikpati of the National Center for Atmospheric Research (NCAR). “The next sunspot cycle will be 30% to 50% stronger than the previous one,” she says. If correct, the years ahead could produce a burst of solar activity second only to the historic Solar Max of 1958.

That was a solar maximum. The Space Age was just beginning: Sputnik was launched in Oct. 1957 and Explorer 1 (the first US satellite) in Jan. 1958. In 1958 you couldn’t tell that a solar storm was underway by looking at the bars on your cell phone; cell phones didn’t exist. Even so, people knew something big was happening when Northern Lights were sighted three times in Mexico. A similar maximum now would be noticed by its effect on cell phones, GPS, weather satellites and many other modern technologies.

Dikpati’s prediction is unprecedented. In nearly-two centuries since the 11-year sunspot cycle was discovered, scientists have struggled to predict the size of future maxima—and failed. Solar maxima can be intense, as in 1958, or barely detectable, as in 1805, obeying no obvious pattern.

The key to the mystery, Dikpati realized years ago, is a conveyor belt on the sun.

We have something similar here on Earth—the Great Ocean Conveyor Belt, popularized in the sci-fi movie The Day After Tomorrow. It is a network of currents that carry water and heat from ocean to ocean–see the diagram below. In the movie, the Conveyor Belt stopped and threw the world’s weather into chaos.

The sun’s conveyor belt is a current, not of water, but of electrically-conducting gas. It flows in a loop from the sun’s equator to the poles and back again. Just as the Great Ocean Conveyor Belt controls weather on Earth, this solar conveyor belt controls weather on the sun. Specifically, it controls the sunspot cycle.

Solar physicist David Hathaway of the National Space Science & Technology Center (NSSTC) explains: “First, remember what sunspots are–tangled knots of magnetism generated by the sun’s inner dynamo. A typical sunspot exists for just a few weeks. Then it decays, leaving behind a ‘corpse’ of weak magnetic fields.”

Enter the conveyor belt.

“The top of the conveyor belt skims the surface of the sun, sweeping up the magnetic fields of old, dead sunspots. The ‘corpses’ are dragged down at the poles to a depth of 200,000 km where the sun’s magnetic dynamo can amplify them. Once the corpses (magnetic knots) are reincarnated (amplified), they become buoyant and float back to the surface.” Presto—new sunspots!

All this happens with massive slowness. “It takes about 40 years for the belt to complete one loop,” says Hathaway. The speed varies “anywhere from a 50-year pace (slow) to a 30-year pace (fast).”

When the belt is turning “fast,” it means that lots of magnetic fields are being swept up, and that a future sunspot cycle is going to be intense. This is a basis for forecasting: “The belt was turning fast in 1986-1996,” says Hathaway. “Old magnetic fields swept up then should re-appear as big sunspots in 2010-2011.”

Like most experts in the field, Hathaway has confidence in the conveyor belt model and agrees with Dikpati that the next solar maximum should be a doozy. But he disagrees with one point. Dikpati’s forecast puts Solar Max at 2012. Hathaway believes it will arrive sooner, in 2010 or 2011.

“History shows that big sunspot cycles ‘ramp up’ faster than small ones,” he says. “I expect to see the first sunspots of the next cycle appear in late 2006 or 2007—and Solar Max to be underway by 2010 or 2011.”

Who’s right? Time will tell. Either way, a storm is coming.

Original Source: Science@NASA