Opportunity Nears its Second Martian Year

Opportunity’s image of an outcrop called “Olympia”. Image credit: NASA Click to enlarge
NASA’s durable twin Mars rovers have successfully explored the surface of the mysterious red planet for a full Martian year (687 Earth days). Opportunity starts its second Martian year Dec. 11; Spirit started a new year three weeks ago. The rovers’ original mission was scheduled for only three months.

“The rovers went through all of the Martian seasons and are back to late summer,” said Dr. John Callas of NASA’s Jet Propulsion Laboratory, Pasadena, Calif. He is deputy rover project manager. “We’re preparing for the challenge of surviving another Martian winter.”

Both rovers keep finding new variations of bedrock in areas they are exploring on opposite sides of Mars. The geological information they have collected increased evidence about ancient Martian environments including periods of wet, possibly habitable conditions.

Spirit is descending from the top of “Husband Hill” to examine a platform-like structure seen from the summit. It will then hurry south to another hill in time to position itself for maximum solar-cell output during the winter.

“Our speed of travel is driven as much by survival as by discovery, though the geology of Husband Hill continues to fascinate, surprise, puzzle and delight us,” said Dr. Steve Squyres of Cornell University, Ithaca, N.Y., principal investigator for the rover’s science instruments. “We’ve got this dramatic topography covered with sand and loose boulders, then, every so often, a little window into the bedrock underneath.”

From the composition and texture of more than six different types of rock inspected, scientists deduced what this part of Mars was like long ago. “It was a hot, violent place with volcanic explosions and impacts,” Squyres said. “Water was around, perhaps localized hot springs in some cases and trace amounts of water in other cases.

Aided by a good power supply from Spirit’s solar cells, researchers have been using the rover at night for astronomical observations. One experiment watched the sky during a meteor shower as Mars passed through the debris trail left by a passage of Halley’s comet. “We’re taking advantage of a unique opportunity to do some bonus science we never anticipated we would be able to do,” Said Cornell’s Dr. Jim Bell, lead scientist for the rovers’ panoramic cameras.

Opportunity is examining bedrock exposures along a route between Endurance and Victoria craters. It recently reached what appears to be a younger layer of bedrock than examined inside Endurance. In Endurance, the lowest layers of bedrock were deposited as windblown dunes. Some of the upper layers were deposited as underwater sediments, indicating a change from drier to wetter conditions over time.

The bedrock Opportunity began seeing about two-thirds of the way to Victoria appears to lie higher than the upper layers at Endurance, but its texture is more like the lowest layer, petrified sand dunes. This suggests the change from drier to wetter environmental conditions may have been cyclical.

Iron-rich granules are abundant in all the layers at Endurance but are much smaller in the younger bedrock. These granules were formed by effects of water soaking the rocks. One possibility for why they are smaller is these layers spent less time wet. Another is the material in these layers had a different chemistry to begin with.

Rover researchers are presenting their latest data today during the American Geophysical Union meeting in San Francisco. Images and information about the rovers and their discoveries are available on the Web at:

http://www.nasa.gov/vision/universe/solarsystem/mer_main.html

Original Source: NASA News Release

What’s Up This Week – December 5 – December 11, 2005

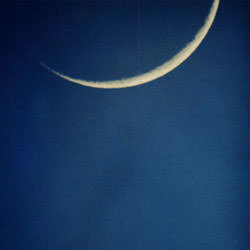
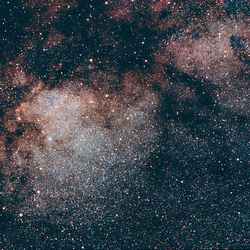
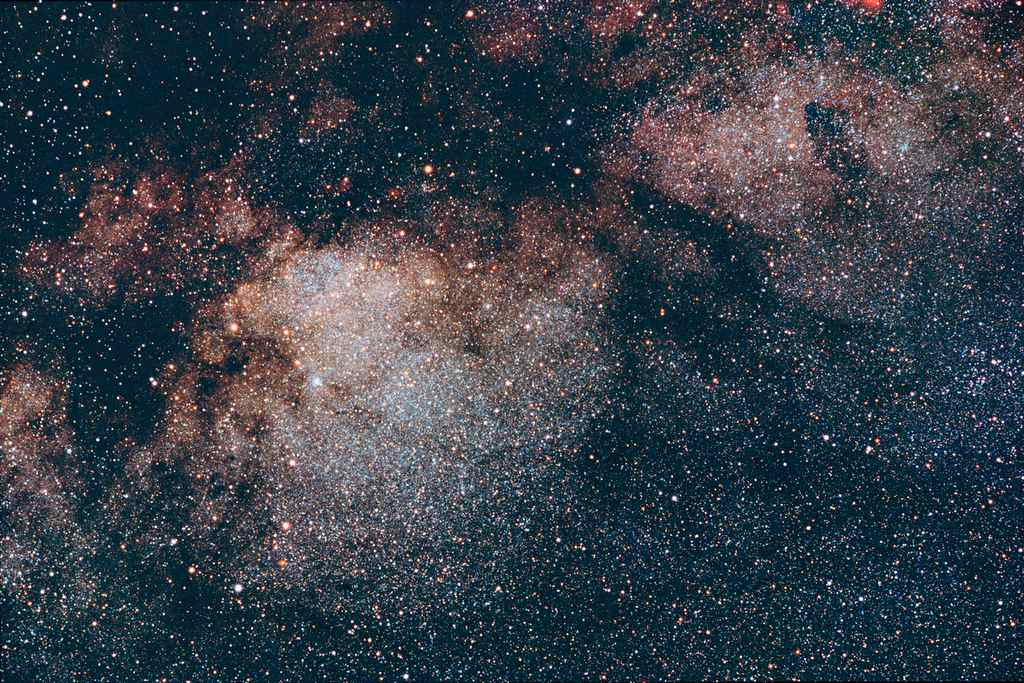
Image credit: Tunc Tezel
Monday, December 5 – For SkyWatchers everywhere, take a look at Venus. Before the week ends, Venus will have reached its greatest brilliancy at -4.6. Now look at the Moon nearby… At its very brightest, it carries a magnitude of -12.6!

Tonight the Moon will offer up a very changeable, sometimes transient, and eventually bright feature on the lunar surface – crater Proclus. At around 28 km (18 miles) in diameter and 2400 meters (11,900 feet) deep, Proclus will appear on the terminator on the west mountainous border of Mare Crisium. Tonight for many viewers, it will seem to be about 2/3 black, but 1/3 of the exposed crater will be exceptionally brilliant – and with good reason. Proclus has an albedo, or surface reflectivity, of about 16%, which is an unusually high value for a lunar feature. Watch this area over the next few nights as two rays from the crater will widen and lengthen, extending approximately 322 km (200 miles) to both the north and south.

Tuesday, December 6 – On the lunar surface tonight, look for the three rings of Theophilus, Cyrillus and Catharina on the edge of Mare Nectaris. Do you remember Dorsum Beaumont? Good! Then let’s head a bit further to the south to check out Fracastorius.

Named for Italian astronomer Girolamo Fracastoro, this 88 kilometer diameter ruined crater will certainly capture your attention. Look carefully at how its northern wall has eroded into the smooth sands of Mare Nectaris, yet a few “lumps” remain to show where it once stood. Fracastorius is a very old crater, mainly filled with lava flow, and has no central peak. With high power and steady seeing, you might glimpse a few small interior craterlets, but you stand a better chance of resolving the small, bright punctuation of Rosse to its northeast.

Wednesday, December 7 – Today is the birthday of Gerard Kuiper. Born 1905, Kuiper was a Dutch-born American planetary scientist who discovered moons of both Uranus and Neptune. He was the first to know that Titan had an atmosphere, and he studied the origins of comets and the solar system.

Tonight we’ll go mountain climbing as we explore the lunar Caucasus. Easily spotted in both binoculars and small telescopes, this mountain range towers around 5182 meters above the surrounding plains – making its peaks as high as Mount Ararat.

As the shadows throw the rugged terrain into bold relief, let’s start by taking a close look at crater Eudoxus in the north – note its rugged walls and a very small central peak. As you begin to move southward along the mountain range, the first small crater you will encounter is tiny Lamech with much more prominent Calippus further south. Now look to the east and you will identify the total ruins of a crater named Alexander. Not very much is left of Alexander except for a shallow arc that marks its south wall. If you haven’t guessed by now, complete this arc in your mind’s eye and you will see how the impact that formed Eudoxus “re-arranged” the lunar landscape!

Thursday, December 8 – Have you been up before dawn lately? If not, why not take a look this morning as Mercury will make its appearance – along with the mighty Jupiter about an hour before dawn!

Tonight on the lunar surface, let’s use a very recognizable feature to help us discover an Astronomical League Lunar Challenge – Cassini and Cassini A.

In the lunar north, the most prominent feature will be the long, dark “scar” of the Alpine Valley running from the northeast to southwest where it enters the Montes Alpes. Follow this mountain chain south to its end at Promontorium Agassiz. To the southwest you will see the singular peak of Mons Piton and to the southeast will be the 57 kilometer wide crater named for Giovanni Cassini. The crater will appear quite shallow: because at 1275 meters deep, it is. Yet, look inside for Cassini A. While it is only 17 kilometers in diameter, it is a stunning 2830 meters deep. Can you spot even smaller Cassini B just inside the crater’s southwest wall?

Friday, December 9 – Southern Hemisphere viewers, you’re in luck tonight as the Puppid-Velid meteor shower reaches its maximum. With an average fall rate of about 10 per hour, this particular meteor shower could also be visible to those far enough south to see the constellation of Puppis. Very little is known about this shower except that the streams and radiants are very tightly bound together. Since studies of the Puppid-Velids are just beginning, why not take the opportunity to watch? Viewing will be all night long and although most of the meteors are faint, it is known to produce an occasional fireball.

While we’re watching, let’s have a look at the lunar surface and use oft-visited crater Eratosthenes to locate other features. Like a yo-yo caught on the end of the string of the Montes Apenninus, Eratosthenes is easy to spot, but did you know the crater north of it in Mare Imbrium is Timocharis? Then look to its east for two small punctuations – Feuillee and Beer. If you return to Timocharis and look for the low rille running southeast you might – with large aperture and steady skies – catch ultra-tiny Pupin in the grey sands. Now let’s go back to Eratosthenes…
Follow the Apennines to the northeast and about a crater width away you will see the very impressive peak of Mons Wolf. While lunar features might not look so large from our vantage point, Mons Wolf is actually as tall as Colorado’s Mt. Zirkel! If placed here on Earth, we’d definitely need time to acclimatize to its summit of 3,658 meters!

Saturday, December 10 – Tonight is the peak of the Monocerid meteor shower. Its fall rate is around 1 per hour and the radiant point is near Gemini.

While you’re looking up, have a look at the “Man in the Moon” tonight. Do you wonder what’s up there? Even binoculars will show you great features like the C-shape of Sinus Iridium and the awesome impacts of Copernicus, Tycho and Clavius. But don’t put away those binoculars just yet…

Tonight Mars will end its backwards, or retrograde, motion against the stars. You’ll find it just a little more than a fistwidth away from the Moon! Now continue onward another handspan away and visit with the incomparable M45 – The Pleiades.

Sunday, December 11 – On this date in 1863, Annie Jump Cannon was born. She was a United States astronomer who created the modern system for classifying stars by their spectra. Tonight let’s celebrate her achievements by viewing some very specific stars that have unusual visual spectral qualities.

Let’s grab a star chart, brush up on our Greek letters and start first with Mu Cephei. Nicknamed the “Garnet Star,” this is perhaps one of the reddest stars visible to the unaided eye. At around 1200 light-years away, this spectral type M2 star will show a delightful blue/purple “flash.” If you still don’t perceive color, try comparing Mu to its bright neighbor Alpha, a spectral type A7, or “white” star. Perhaps you’d like something a bit more off the beaten path? Then head for S Cephei about halfway between Kappa and Gamma toward the pole. Its intense shade of red makes this magnitude 10 star an incredibly worthwhile hunt.

To see an example of a B spectrum star, look no further than the Pleiades… All the components are blue white. Want to taste an “orange?” Then look again at Aldeberan, or Alpha Tauri, and say hello to a K spectrum star. Now that I have your curiosity aroused, would you like to see what our own Sun would look like? Then chose Alpha Aurigae, better known as Capella, and discover a spectral class G star that’s only 160 times brighter intrinsically than the one that holds our solar system together.

If you’re enjoying the game, then have a look at one of the most unusual spectral stars of all – Theta Aurigae. Theta is actually a B class, or a blue/white, but instead of having strong lines in the helium, it has an abnormal concentration of silicon, making this incredibly unusual double star seem to glitter like a “black diamond.”
Still no luck in seeing color? Don’t worry. It does take a bit of practice! The cones in our eyes are the color receptors and when we go out in the dark, the color-blind rods take over. By intensifying the starlight with either a telescope or binoculars, we can usually excite the cones in our dark-adapted eyes to pick up on color.

Tonight is also the peak of the Sigma Hydrid meteor stream. Its radiant is near the head of the Serpent and the fall rate is also 12 per hour – but these are fast!

Until next week, ask for the Moon but keep reaching for the stars! May all your journeys be at light speed…. ~Tammy Plotner

New View of Space Weather Cold Fronts

Artist’s impression of Earth auroras. Image credit: NASA Click to enlarge
Scientists from NASA and the National Science Foundation discovered a way to combine ground and space observations to create an unprecedented view of upper atmosphere disturbances during space storms.

Large, global-scale disturbances resemble weather cold fronts. They form in the Earth’s electrified upper atmosphere during space storms. The disturbances result from plumes of electrified plasma that form in the ionosphere. When the plasma plumes pass overhead, they impede low and high frequency radio communications and delay Global Positioning System navigation signals.

“Previously, they seemed like random events,” said John Foster, associate director of the Massachusetts Institute of Technology’s Haystack Observatory. He is principal investigator of the Foundation supported Millstone Hill Observatory, Wesford, Mass.

“People knew there was a space storm that must have disrupted their system, but they had no idea why,” said Tony Mannucci, group supervisor of Ionospheric and Atmospheric Remote Sensing at NASA’s Jet Propulsion Laboratory, Pasadena, Calif. “Now we know it’s not just chaos; there is cause and effect. We are beginning to put together the full picture, which will ultimately let us predict space storms.”

Predicting space weather is a primary goal of the National Space Weather Program involving NASA, the foundation and several other federal agencies. The view researchers created allowed them to link movement of the plumes to processes that release plasma into space. “Discovering this link is like discovering the movement of cold fronts is responsible for sudden thunderstorms,” said Jerry Goldstein, principal scientist at the Southwest Research Institute, San Antonio.

Since the occurrence of plasma plumes in the ionosphere disrupts GPS signals, they provide a continuous monitor of these disturbances. Researchers discovered a link between GPS data and satellite images of the plasmasphere. The plasmasphere is a plasma cloud surrounding Earth above the ionosphere. It is being observed from NASA’s Imager for Magnetopause to Aurora Global Exploration satellite. The researchers discovered the motion of the ionospheric plumes corresponded to the ejection of plasma from the plasmasphere during space storms.

The combined observations allowed construction of an underlying picture of the processes during space storms, when the Earth’s magnetic field is buffeted by hot plasma from the sun. As the solar plasma blows by, it generates an electric field that is transmitted to the plasmasphere and ionosphere. This electric field propels the ionospheric and the plasmaspheric plasma out into space. For the first time, scientists can directly connect the plasma observed in the ionosphere with the plasmasphere plumes that extend many thousand of kilometers into space.

“We also know these disturbances occur most often between noon and dusk, and between mid to high latitudes, due to the global structure of the electric and magnetic fields during space storms,” said Anthea Coster of the Haystack Observatory. “Ground and space based, and in situ measurements are allowing scientists to understand the ionosphere-thermosphere-magnetosphere as a coupled system.”

The plumes degrade GPS signals in two primary ways. First, they cause position error by time delaying the propagation of GPS signals. Second, the turbulence they generate causes receivers to lose the signal through an effect known as scintillation. It is similar to the apparent twinkling of stars caused by atmospheric turbulence.

Researchers are presenting the findings today during the American Geophysical Union meeting in San Francisco, Calif. For information about space weather and other research on the Web, visit:
http://www.nasa.gov/vision/universe/solarsystem/cold_front.html

Original Source: NASA News Release

Oxygen Levels on Earth Rose Gradually

Earth. Image credit: NASA Click to enlarge
The history of life on Earth is closely linked to the appearance of oxygen in the atmosphere. The current scientific consensus holds that significant amounts of oxygen first appeared in Earth’s atmosphere some 2.4 billion years ago, with a second large increase in atmospheric oxygen occurring much later, perhaps around 600 million years ago.

However, new findings by University of Maryland geologists suggest that the second jump in atmospheric oxygen actually may have begun much earlier and occurred more gradually than previously thought. The findings were made possible using a new tool for tracking microbial life in ancient environments developed at Maryland. Funded by the National Science Foundation and NASA, the work appears in the December 2 issue of Science.

Graduate researcher David Johnston, research scientist Boswell Wing and colleagues in the University of Maryland’s department of geology and Earth System Science Interdisciplinary Center led an international team of researchers that used high-precision measurements of a rare sulfur isotope, 33S, to establish that ancient marine microbes known as sulfur disproportionating prokaryotes were widely active almost 500 million years earlier than previously thought.

The intermediate sulfur compounds used by these sulfur disproportionating bacteria are formed by the exposure of sulfide minerals to oxygen gas. Thus, evidence of widespread activity by this type of bacteria has been interpreted by scientists as evidence of increased atmospheric oxygen content.

“These measurements imply that sulfur compound disproportionation was an active part of the sulfur cycle by [1.3 million years ago], and that progressive Earth surface oxygenation may have characterized the [middle Proterozoic],” the authors write.

The Proterozoic is the period in Earth’s history from about 2.4 billion years ago to 545 million years ago.

“The findings also demonstrate that the new 33S-based research method can be used to uniquely track the presence and character of microbial life in ancient environments and provide a glimpse of evolution in action,” said Johnston. “This approach provides a significant new tool in the astrobiological search for early life on Earth and beyond.”

The Air That We Breathe

When our planet formed some 4.5 billion years ago, virtually all the oxygen on Earth was chemically bound to other elements. It was in solid compounds like quartz and other silicate minerals, in liquid compounds like water, and in gaseous compounds like sulfur dioxide and carbon dioxide. Free oxygen — the gas that allows us to breath, and which is essential to all advanced life — was practically non-existent.

Scientists have long thought that appearance of oxygen in the atmosphere was marked by two distinct jumps in oxygen levels. In recent years, researchers have used a method developed by University of Maryland geologist James Farquhar and Maryland colleagues to conclusively determine that significant amounts of oxygen first appeared in Earth’s atmosphere some 2.4 billion years ago. Sometimes referred to as the “Great Oxidation Event,” this increase marks the beginning of the Proterozoic period.

A general scientific consensus has also held that the second major rise in atmospheric oxygen occurred some 600 million years ago, with oxygen rising to near modern levels at that time. Evidence of multicellular animals first appears in the geologic around this time.

“There has been a lot of discussion about whether the second major increase in atmospheric oxygen was quick and stepwise, or slow and progressive,” said Wing. “Our results support the idea that the second rise was progressive and began around 1.3 billion years ago, rather than 0.6 billion years ago.”

In addition to Johnston, Wing’s Maryland co-authors on the Dec. 2 paper are geology colleagues James Farquhar and Jay Kaufman. Their group works to document links between sulfur isotopes and the evolution of Earth’s atmosphere using a combination of field research, laboratory analysis of rock samples, geochemical models, photochemical experiments with sulfur-bearing gases and microbial experiments.

“Active microbial sulfur disproportionation in the Mesoproterozoic” by David T. Johnston, Boswell A. Wing, James Farquhar and Alan J. Kaufman, University of Maryland; Harald Strauss, Universit?t M?nster; Timothy W. Lyons, University of California, Riverside; Linda C. Kah, University of Tennessee; Donald E. Canfield, Southern Denmark University: Science, Dec. 2, 2005.

Original Source: UM News Release

Chandra Views the Perseus Cluster

Perseus Cluster. Image credit: NASA Click to enlarge
An accumulation of 270 hours of Chandra observations of the central regions of the Perseus galaxy cluster reveals evidence of the turmoil that has wracked the cluster for hundreds of millions of years. One of the most massive objects in the universe, the cluster contains thousands of galaxies immersed in a vast cloud of multimillion degree gas with the mass equivalent of trillions of suns.

Enormous bright loops, ripples, and jet-like streaks are apparent in the image. The dark blue filaments in the center are likely due to a galaxy that has been torn apart and is falling into NGC 1275, a.k.a. Perseus A, the giant galaxy that lies at the center of the cluster.

Special processing designed to bring out low and high pressure regions in the hot gas has uncovered huge low pressure regions (shown in purple in the accompanying image overlay, and outlined with the white contour). These low pressure regions appear as expanding plumes that extend outward 300,000 light years from the supermassive black hole in NGC 1275.

The hot gas pressure is assumed to be low in the plumes because unseen bubbles of high-energy particles have displaced the gas. The plumes are due to explosive venting from the vicinity of the supermassive black hole.

The venting produces sound waves which heat the gas throughout the inner regions of the cluster and prevent the gas from cooling and making stars at a high rate. This process has slowed the growth of one of the largest galaxies in the Universe. It provides a dramatic example of how a relatively tiny, but massive, black hole at the center of a galaxy can control the heating and cooling behavior of gas far beyond the confines of the galaxy.

Original Source: Chandra X-ray Observatory

Dwarf Galaxies are Ablaze in Star Formation

Spitzer captured galaxy interaction in this image of NGC 5291. Image credit: NASA/JPL Click to enlarge
When galaxies collide (as our galaxy, the Milky Way, eventually will with the nearby Andromeda galaxy), what happens to matter that gets spun off in the collision’s wake?

With help from the Spitzer Space Telescope’s infrared spectrograph (IRS) and infrared array camera (IRAC), Cornell astronomers are beginning to piece together an answer to that question. Specifically, they are gaining new insight into how some ubiquitous dwarf galaxies form, interact, and arrange themselves into new systems.

Dwarf galaxies, with stellar masses around 0.1 percent that of the Milky Way, are far more common than their more massive spiral or starburst counterparts. Some may be primordial remnants of the Big Bang; but others — called tidal dwarfs — formed later as a result of gravitational interactions after galactic collisions.

To understand which dwarf galaxies are tidal in origin and how those galaxies differ from primordial dwarf galaxies, Cornell researcher Sarah Higdon and her colleagues studied a galactic merger called NGC 5291, which is 200 million light-years from Earth and roughly four times the size of the Milky Way. At the system’s center are two colliding galaxies; behind them trail a string of much smaller dwarfs.

The researchers focused on the system because they knew from earlier analyses that the trailing dwarfs were formed tidally as a result of the central collision. Until recently, though, they hadn’t been able to look closely enough at the tidal dwarfs to catalog their properties for comparison with those of similar galaxies.

Spitzer’s sharp eye has changed that. Using it to look for compounds that indicate star-forming activity, Higdon’s team found that when it comes to fostering new star formation, the colliding galaxies at the system’s center are fairly dull. The exciting place to be, they found, is in the tidal dwarfs at the system’s edges.

Specifically, the team found that the tidal dwarfs show strong emission from organic compounds, found in crude petroleum, burnt toast, and (more relevantly) stellar nurseries, known as PAHs — for polycyclic aromatic hydrocarbons. And for the first time, the researchers detected warm molecular hydrogen — another indicator of star formation, and one that has never before been directly measured in tidal dwarf galaxies.

“We know molecular hydrogen is out there. Now we have the sensitivity to measure it,” Higdon said.

Higdon and Cornell colleagues James Higdon and Jason Marshall describe the features of the NGC 5291 system in a forthcoming issue of the Astrophysical Journal.

“Nearly everything at some stage interacts,” Higdon said. “This is a part of the puzzle. But we’ve only just started looking. We don’t know how long lived [the tidal dwarf galaxies] will be, or how many formed like this.”

Next, the team plans to search for new tidal dwarf galaxies using the Spitzer surveys and compare their properties to the newly cataloged galaxies in NGC 5291.

Original Source:Spitzer Space Telescope

Giant Hubble Mosaic of the Crab Nebula

Crab Nebula. Image credit: Hubble. Click to enlarge
This is a mosaic image, one of the largest ever taken by NASA’s Hubble Space Telescope of the Crab Nebula, a six-light-year-wide expanding remnant of a star’s supernova explosion. Japanese and Chinese astronomers recorded this violent event nearly 1,000 years ago in 1054, as did, almost certainly, Native Americans.

The orange filaments are the tattered remains of the star and consist mostly of hydrogen. The rapidly spinning neutron star embedded in the center of the nebula is the dynamo powering the nebula’s eerie interior bluish glow. The blue light comes from electrons whirling at nearly the speed of light around magnetic field lines from the neutron star. The neutron star, like a lighthouse, ejects twin beams of radiation that appear to pulse 30 times a second due to the neutron star’s rotation. A neutron star is the crushed ultra-dense core of the exploded star.

The Crab Nebula derived its name from its appearance in a drawing made by Irish astronomer Lord Rosse in 1844, using a 36-inch telescope. When viewed by Hubble, as well as by large ground-based telescopes such as the European Southern Observatory’s Very Large Telescope, the Crab Nebula takes on a more detailed appearance that yields clues into the spectacular demise of a star, 6,500 light-years away.

The newly composed image was assembled from 24 individual Wide Field and Planetary Camera 2 exposures taken in October 1999, January 2000, and December 2000. The colors in the image indicate the different elements that were expelled during the explosion. Blue in the filaments in the outer part of the nebula represents neutral oxygen, green is singly-ionized sulfur, and red indicates doubly-ionized oxygen.

Original Source:HubbleSite News Release

Huygens Sunk Into Soft Ground

Huygens descent and landing overview. Image credit: ESA Click to enlarge
The Surface Science Package (SSP) revealed that Huygens could have hit and cracked an ice ?pebble? on landing, and then it slumped into a sandy surface possibly dampened by liquid methane. Had the tide on Titan just gone out?

The SSP comprised nine independent sensors, chosen to cover the wide range of properties that be encountered, from liquids or very soft material to solid, hard ice. Some were designed primarily for landing on a solid surface and others for a liquid landing, with eight also operating during the descent.

Extreme and unexpected motion of Huygens at high altitudes was recorded by the SSP?s two-axis tilt sensor tilt sensor, suggesting strong turbulence whose meteorological origin remains unknown.

Penetrometry and accelerometry measurements on impact revealed that the surface was neither hard (like solid ice) nor very compressible (like a blanket of fluffy aerosol). Huygens landed on a relatively soft surface resembling wet clay, lightly packed snow and either wet or dry sand.

The probe had penetrated about 10 cm into surface, and settling gradually by a few millimetres after landing and tilting by a fraction of a degree. An initial high penetration force is best explained by the probe striking one of the many pebbles seen in the DISR images after landing.

Acoustic sounding with SSP over the last 90 m above the surface revealed a relatively smooth, but not completely flat, surface surrounding the landing site. The probe?s vertical velocity just before landing was determined with high precision as 4.6 m/s and the touchdown location had an undulating topography of around 1 metre over an area of 1000 sq. metres.

Those sensors intended to measure liquid properties (refractometer, permittivity and density sensors) would have performed correctly had the probe landed in liquid. The results from these sensors are still being analysed for indications of trace liquids, since the Huygens GCMS detected evaporating methane after touchdown.

Together with optical, radar and infrared spectrometer images from Cassini and images from the DISR instrument on Huygens, these results indicate a variety of possible processes modifying Titan?s surface.

Fluvial and marine processes appear most prominent at the Huygens landing site, although aeolian (wind-borne) activity cannot be ruled out. The SSP and HASI impact data are consistent with two plausible interpretations for the soft material: solid, granular material having a very small or zero cohesion, or a surface containing liquid.

In the latter case, the surface might be analogous to a wet sand or a textured tar/wet clay. The ?sand? could be made of ice grains from impact or fluvial erosion, wetted by liquid methane. Alternatively it might be a collection of photochemical products and fine-grained ice, making a somewhat sticky ?tar?.

The uncertainties reflect the exotic nature of the materials comprising the solid surface and possible liquids in this extremely cold (?180 ?C) environment.

Original Source: ESA Portal