Evidence of Our Violent Early Solar System

Meteorite. Image credit: NASA/JPL/Cornell Click to enlarge
A U of T scientist has found unexpectedly ?young? material in meteorites ? a discovery that breaks open current theory on the earliest events of the solar system.

A paper published today in the August issue of Nature reports that the youngest known chondrules ? the small grains of mineral that make up certain meteorites ? have been identified in the meteorites known as Gujba and Hammadah al Hamra.

Researchers who have studied chondrules generally agree that most were formed as a sudden, repetitive heat, likely from a shock wave, condensed the nebula of dust floating around the early Sun. Thinking that an analysis of the chondrules in Gujba and Hammadah al Hamra would be appropriate for accurately dating this process, U of T geologist Yuri Amelin, together with lead author Alexander Krot of the University of Hawaii, studied the chondrules? mineralogical structure and determined their isotopic age. ?It soon became clear that these particular chondrules were not of a nebular origin,? says Amelin. ?And the ages were quite different from what was expected. It was exciting.?

Amelin explains that not only were these chondrules not formed by a shock wave, but rather emerged much later than other chondrules. ?They actually post-date the oldest asteroids,? he says. ?We think these chondrules were formed by a giant plume of vapour produced when two planetary embryos, somewhere between moon-size and Mars-size, collided.?

What does this mean in the grand scheme of things? The evolution of the solar system has traditionally been seen as a linear process, through which gases around the early sun gradually cooled to form small particles that eventually clumped into asteroids and planets. Now there is evidence of chondrules forming at two very distinct times, and evidence that embryo planets already existed when chondrules were still forming. ?It moves our understanding from order to disorder,? Amelin admits. ?But I?m sure that as new data is collected, a new order will emerge.?

Financial support for this project was provided by NASA and the Canadian Space Agency.

Original Source: University of Toronto

SOHO Gets Its 1,000th Comet

999th and 1000th comets identified in SOHO images. Image credit: ESA/NASA Click to enlarge
On 5 August 2005, the ESA/NASA SOHO spacecraft achieved an incredible milestone – the discovery of its 1000th comet!

The 1000th comet was a Kreutz-group comet spotted in images from the C3 coronagraph on SOHO’s LASCO instrument by Toni Scarmato, from Calabria, Italy.
Just five minutes prior to discovering SOHO’s 1000th comet, Toni had also spotted SOHO’s 999th comet! These comets take Toni’s personal number of SOHO discoveries to 15.

Many SOHO comet discoveries have been by amateurs using SOHO images on the internet, and SOHO comet hunters come from all over the world. Toni Scarmato, a high school teacher and astrophysics graduate of the University of Bologna, said: ?I am very happy for this special experience that is possible thanks to the SOHO satellite and NASA-ESA collaboration.

“I want to dedicate the SOHO 1000th comet to my wife Rosy and my son Kevin to compensate for the time that I have taken from them to search for SOHO comets.”

The SOHO team also held a contest over the internet to guess the time when the 1000th comet would be discovered. The contest winner is Andrew Dolgopolov of Dublin, Ireland, who guessed the time of the comet?s closest approach to the Sun (perihelion time) within 22 minutes.

SOHO, the Solar and Heliospheric Observatory , is a joint effort between NASA and ESA and is now in its tenth year of operation. Although it was originally planned as a solar and heliospheric mission, it was optimistically hoped that LASCO might observe at least a handful of ?sungrazer? comets, based on the success of the SOLWIND coronagraph in the late 1970s and 1980s, which discovered a small number of very bright Kreutz-group comets.
It was not long after SOHO began sending down a steady stream of data in 1996 that SOHO scientists spotted a Kreutz-group comet in LASCO images. Soon, several more comets had been found and word started to spread of SOHO?s potential as a comet discoverer.

In 2000, amateur astronomer Mike Oates started to search the SOHO images, which had recently became available via the internet. He soon revealed just how much potential SOHO had by quickly spotting over 100 comets in LASCO images.

Almost all SOHO’s comets are discovered using images from its LASCO instrument, the Large Angle and Spectrometric Coronagraph. LASCO is used to observe the faint, multimillion-degree outer atmosphere of the Sun, called the corona. A disk in the instrument is used to make an artificial eclipse, blocking direct light from the Sun so the much fainter corona can be seen. Sungrazing comets are discovered when they enter LASCO’s field of view as they pass close by the Sun.

As time passed, more professional astronomers, as well as amateur enthusiasts from all over the world, joined the search for SOHO comets. In August 2002, Rainer Kracht (now the leading SOHO comet discoverer, with over 150 SOHO comets) spotted SOHO?s 500th comet. This in itself was an achievement that none of the SOHO/LASCO scientists ever imagined would, or could, happen.

However, just three years later, SOHO, with 1000 comet discoveries, is responsible for almost half of all officially recorded comets in history! Add to this the fact that the SOHO mission has completely revolutionised solar physics and the understanding of the Sun, and it shows just how truly amazing the SOHO spacecraft is!

Original Source: ESA Portal

Next Shuttle Will Fly in March 2006

Discovery lifts off on the 26th, July. Image credit: NASA/Bill Ingalls Click to enlarge
NASA is targeting March for the next Space Shuttle mission (STS-121). The mission will be the second test flight to the International Space Station in the Shuttle Return to Flight sequence.

NASA Administrator Michael Griffin and Associate Administrator for Space Operations Bill Gerstenmaier made the announcement today at a news conference at the agency’s headquarters in Washington.

“We are giving ourselves what we hope is plenty of time to evaluate where we are,” said Administrator Griffin. “We don’t see the tasks remaining before us being as difficult as the path behind us.”

Based on NASA’s self-imposed optimum lighting requirements, the earliest possible launch opportunity for the STS-121 mission is March 4, 2006. The Space Shuttle Discovery will be used for the mission, instead of Space Shuttle Atlantis.

Moving toward a no earlier than March launch for STS-121 will allow engineering teams more time to properly evaluate the issue of large pieces of insulating foam that came off Discovery’s external fuel tank during launch last month.

Targeting March also allows the Space Shuttle Program to put itself into a better posture for future Shuttle missions to the Space Station. Changing Orbiters for the STS-121 mission enables use of Atlantis for the following mission, STS-115, which will resume assembly of the Station.

The switch frees Atlantis to fly the remaining Space Station truss segments, which are too heavy for Discovery, in 2006. By changing the Orbiter line up, the Shuttle program will not have to do two back-to-back missions with Atlantis, as previously scheduled.

“It really makes sense to move to the March timeframe,” Gerstenmaier said. “We’re looking at the Shuttle missions to support the most robust flight sequence for the Space Station and to make the whole sequence flow better. This extra time helps us make sure that all the work we need to do fits and that there are no other issues.”

Discovery’s recent mission, STS-114, and the STS-121 mission are test flights. They will enable NASA to evaluate new safety procedures and equipment, giving the agency greater confidence that the Shuttle can be flown safely through its planned retirement date of 2010.

The external fuel tanks at NASA’s Kennedy Space Center in Florida will be shipped back to the Michoud Assembly Facility in Louisiana for tests and potential modifications.

For information about the STS-114 Return to Flight mission and future Shuttle flights, visit: http://www.nasa.gov/returntoflight

Original Source: NASA News Release

Newborn Black Holes

Artist’s impression of Swift spacecraft. Image credit: Spectrum Astro/NASA Click to enlarge
Scientists using NASA’s Swift satellite say they have found newborn black holes, just seconds old, in a confused state of existence. The holes are consuming material falling into them while somehow propelling other material away at great speeds.

These black holes are born in massive star explosions. An initial blast obliterates the star, yet the chaotic black hole activity appears to re-energize the explosion several times in just a few minutes. This is a dramatically different view of star death, one that entails multiple explosive outbursts and not just a single bang, as previously thought.

“Stars are exploding two, three and sometimes four times in the first minutes following the initial explosion,” said Prof. David Burrows of Penn State, University Park, Pa. “First comes a blast of gamma rays followed by intense pulses of X-rays. The energies involved are much greater than anyone expected,” he added.

Scientists have seen this phenomenon in nearly half of the longer gamma-ray bursts detected by Swift. These gamma-ray bursts are the most powerful explosions known. They are forerunners of a massive star explosion called a hypernova, which is bigger than a supernova. Using Swift, scientists are finally able to see gamma-ray bursts within minutes after the trigger, instead of hours or days, and are privy to newborn black hole activity.

Until this latest Swift discovery, scientists assumed a simple scenario of a single explosion followed by a graceful afterglow of the dying embers. The new scenario of a blast followed by a series of powerful “hiccups” is particularly evident in a gamma-ray burst from May 2, 2005, named GRB 050502B. This burst lasted 17 seconds during the early morning hours in the constellation Leo. About 500 seconds later, Swift detected a spike in X-ray light about 100 times brighter than anything seen before.

Previously there had been hints of an “X-ray bump” between the burst and afterglow in previous gamma-ray bursts, coming a minute or so after the burst. Swift has seen more than one dozen clear cases of multiple explosions. There are several theories to describe this newly discovered phenomenon and most point to the presence of a newborn black hole.

“The newly formed black hole immediately gets to work,” said Prof. Peter Meszaros of Penn State, head of the Swift theory team. “We aren’t clear on the details yet, but it appears to be messy. Matter is falling into the black hole, which releases a great amount of energy. Other matter gets blasted away from the black hole and flies out into the interstellar medium. This is by no means a smooth operation,” he added.

Another theory is the jet of material shooting away from the dead star starts to fall back onto itself, creating shockwaves in the jet core that ram together blobs of gas and produce X-ray light.

“None of this was realized before simply because we couldn’t get to the scene of the explosion fast enough,” said Dr. Neil Gehrels of NASA Goddard Space Flight Center, Greenbelt, Md., Swift principal investigator. “Swift has the unique ability to detect bursts and turn its X-ray and ultraviolet-optical telescopes to the explosion’s embers within minutes. As such, Swift is detecting new burst details that might rewrite theory,” Gehrels said.

Swift carries three main instruments: the Burst Alert Telescope (BAT); X-ray Telescope (XRT); and the Ultraviolet/Optical Telescope (UVOT). Today’s announcement is based largely on XRT data. The XRT was built at Penn State with partners at the Brera Astronomical Observatory in Italy and the University of Leicester in England.

Swift was launched in November 2004. It is a NASA mission in partnership with the Italian Space Agency and the Particle Physics and Astronomy Research Council, United Kingdom. Swift is managed by Goddard. Penn State controls science and flight operations from the Mission Operations Center in University Park, Pa. The spacecraft was built in collaboration with national laboratories, universities and international partners.

A paper discussing these findings appears online today on Science Express and in the September 9 issue of Science. Burrows is lead author of the paper.

For more information about this research on the Web, visit:
http://www.nasa.gov/vision/universe/watchtheskies/double_burst.html

Original Source: NASA News Release

The Ends of the Earth

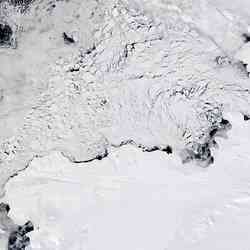
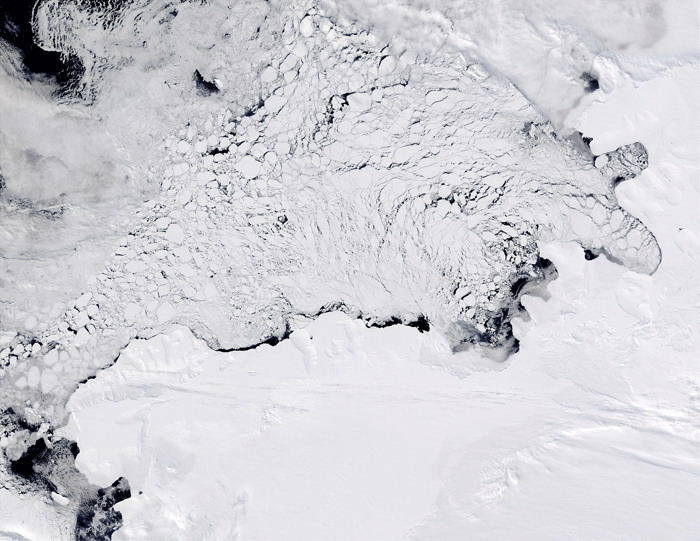
Antarctic ice sheets. Image credit: NASA Click to enlarge
Pamela Conrad, an astrobiologist with NASA’s Jet Propulsion Laboratory, has traveled to the ends of the Earth to study life. Conrad recently appeared in James Cameron’s 3-D documentary “Aliens of the Deep,” where she and several other scientists investigated strange creatures that inhabit the ocean floor.

On June 16, 2005, Conrad gave a lecture entitled, “A Bipolar Year: What We Can Learn About Looking for Life on Other Planets by Working in Cold Deserts.”

In part 1 of this edited transcript, Conrad describes what sort of signs we could look for to see if there is life in an alien environment.

“In the past three years, I’ve been engaged in a project with several of my colleagues that takes us to hot and cold deserts. We want to observe the signatures of life, and see if we can tell the difference between places where life is and where life isn’t. The reason we go to deserts is to cut down on the number of confounding variables that are introduced by all kinds of life. Basically, we don’t want to be scraping away the dog poop to find the bacteria in the dirt.

This past year we were privileged to go to both the Arctic and the Antarctic. So this is my bipolar year, and what we were doing there is relevant to space exploration because, like a desert, the conditions on the surface of other planets are very harsh.

We look at rocks because, if life had been and is already gone – in other words, it’s dead, or it’s so dead it’s been fossilized and altered – you can find that in the rock record.

To detect life anywhere, you need to be able to investigate the environment and find measurable clues. If it’s not something you can define in measurable terms, it’s not science. So by definition, we’re kind of out in the cold, so to speak.

One of the challenges is coming up with measurable terms by which you could define life. The terms have to be universal enough to not miss life on another planet, if it was unlike the life we have here. We have a sample set of one: the biosphere on the Earth. We try to use the knowledge we have about life here to come up with those terms, and so we try to think about life in the most general descriptive terms we can.

We look for life in places that are habitable; places that are capable of supporting life. But habitability is difficult to define, because we only have a vague notion of what makes an environment habitable. At NASA, we’re very big on looking for water as one of the facets of habitability.

Water is as important to life in the desert as it is to us. After a fresh snowfall, when rocks get heated up and melt the ice, you see a bloom of cyanobacteria on the surface of the rock. Yet they are able to maintain a minimal existence when there’s not much precipitation.

One reason metabolism has to slow down in the Antarctic winter is because the water is in a solid phase and it’s not accessible. Living things can only use ice when it melts and becomes a good solvent. Using ice is like using a mineral in the crystal phase — when it’s in the solid form, you’ve got to use some energy to bust up those bonds to do something with it. There are organisms in Antarctica that have antifreeze types of molecules in them, fish that possess molecules called glycoproteins. When an ice crystal forms in the fish, the molecule grabs hold of the ice crystal as it starts to grow, and doesn’t let it grow in the direction that its energetically most easily grown. Because it can’t grow, the ice crystal gives up the ghost and turns back into water.

Besides water, we think that certain kinds of chemical elements are important for life elsewhere. Life on Earth is made of carbon and hydrogen and phosphorus and a few other important things, and we need the oxygen in the air. But there are microbes on Earth that breathe metal, and they don’t care about oxygen.

So habitability is really habitable in the eyes of the beholder. When you’re defining it, you’ve got to think about the broadest set of terms you can in order to encompass any kind of life you might be able to imagine. The ultimate assessment of whether a place is habitable is, of course, to see if it is inhabited.

You ask one set of questions if you want to know, “Can I set up housekeeping here?” You might ask another set of questions if you want to know, “Is anybody home?” But at the heart of it all, whether or want to live there or just see if anyone’s home, you have to know something about the neighborhood. You’ve still got to do all the experiments that tell you about the geophysical, mineralogical, and atmospheric properties of the planet. If you’re looking for life, you’ve got to have some notion about what sort of thing you’re trying to support with that environment.

Erupting about 5 million years ago, from a series of fractures known as the Cerberus Fossae, the water flowed down in a catastrophic flood, collecting in an area 800 x 900 km and was initially an average of 45 meters deep. Click image for larger view.Credit: ESA/Mars Express

So what would constitute proof? If you want to say that something has been proven, you have to achieve a certain level of consensus in the scientific community, otherwise your peers will tear you into little bits and pieces in the literature. Of course, there is never a complete consensus: that’s why we nasty scientists fight with each other endlessly. But we have to at least come up with terms. We can agree or disagree with each other’s theories, but we have to agree on the terms and the measurements.

So what kind of measurements could we make if we were looking for life? Does a planet look different if life has been there? For example, if you go into my kitchen after I’ve eaten, you might see a plate or a crumb. That’s a clue that I was there. There are clues at the planetary level too. A biomarker – a clue that says life was there – can be anything that was produced by life. The clue can be chemical, because chemicals comprise everything. I am a sack of chemicals, just like this podium is a sack of chemicals. Just what chemicals there are, and in what proportion to each other, and how they’re arranged in 3-D, is what distinguishes me from this. It’s a simple way of distinguishing categories of things.

Chirality is a biomarker as well. What chirality means is that some molecules are mirror images of each other, and the living molecules tend to be a certain handedness. When it comes to amino acids, which are the constituents of the proteins that make up life, living things like to use the left-handed form. And when it comes to the sugars, living things like to use the right-handed form. There are exceptions to these, but that’s a general case.

Isotopes also can be a biomarker. Some molecules come in different isotopic flavors, where some are slightly heavier than others. Living things like the lighter variety, probably because it’s energetically less expensive to process.

Complex polymers also could be biomarkers. Of course, plastic is a complex polymer. The again, we made the plastic. So this whole distinction between natural and unnatural – if humans made it, it’s still biogenic. So think about that. My car is a biosignature. What kind, I’m not sure.

If you’re going to define life in measurable terms, I’d like to keep it really simple. You could define life by what it’s made of, or you could define life by what it does. I like to define life by what it’s made of, because as soon as you say the “does” word, you’re talking about a process. A process is something that happens through time. Then you’ve got to figure out what the sampling rate should be. How often should you look, and how long should the whole experiment take? A process is a little more problematic because it takes time, and you may be wrong about how often to look, or how long you should look for.

Processes – making stuff, reproducing, or evolving – can take place over different time scales. So if you’re only looking at processes, and you have two that are vastly different in their time scales, you won’t be able to do the same experiment to look at them both. So I like to look at life in terms of what it is. Not to say we couldn’t add in a little bit of process-based stuff, but when you look at what life is, it gets simple really fast. It’s unique chemistry, some kind of proportionate chemicals, arranged in some way, and the “arranged in some way” is what I call structure.

If I were looking for life on another planet or a moon, I would look for places where interesting chemistry could happen, so that the ultimate evolution of that chemistry could create a living system. I would think about places like Europa, which has an ocean beneath ice. I would think about other places where ice exists, like comets. I would think about Titan, Saturn’s moon. I would think about all those places where interesting chemistry occurs, because chemistry is clever. You can get all kinds of interesting molecules.

Original Source: NASA Astrobiology

Supernova Shockwave Slams into Stellar Bubble

X-ray image of SN 1987A. Image credit: NASA/CXC/PSU Click to enlarge
Recent Chandra observations have revealed new details about the fiery ring surrounding the stellar explosion that produced Supernova 1987A. The data give insight into the behavior of the doomed star in the years before it exploded, and indicate that the predicted spectacular brightening of the circumstellar ring has begun.

The supernova occurred in the Large Magellanic Cloud, a galaxy only 160,000 light years from Earth. The outburst was visible to the naked eye, and is the brightest known supernova in almost 400 years. The site of the explosion was traced to the location of a blue supergiant star called Sanduleak -69? 202 (SK -69 for short) that had a mass estimated at approximately 20 Suns.

Subsequent optical, ultraviolet and X-ray observations have enabled astronomers to piece together the following scenario for SK -69: about ten million years ago the star formed out of a dark, dense, cloud of dust and gas; roughly a million years ago, the star lost most of its outer layers in a slowly moving stellar wind that formed a vast cloud of gas around it; before the star exploded, a high-speed wind blowing off its hot surface carved out a cavity in the cool gas cloud.

The intense flash of ultraviolet light from the supernova illuminated the edge of this cavity to produce the bright ring seen by the Hubble Space Telescope. In the meantime the supernova explosion sent a shock wave rumbling through the cavity.

In 1999, Chandra imaged this shock wave, and astronomers have waited expectantly for the shock wave to hit the edge of the cavity, where it would encounter the much denser gas deposited by the red supergiant wind, and produce a dramatic increase in X-radiation. The latest data from Chandra and the Hubble Space Telescope indicate that this much-anticipated event has begun.

Optical hot-spots now encircle the ring like a necklace of incandescent diamonds (image on right). The Chandra image (left) reveals multimillion-degree gas at the location of the optical hot-spots.

X-ray spectra obtained with Chandra provide evidence that the optical hot-spots and the X-ray producing gas are due to a collision of the outward-moving supernova shock wave with dense fingers of cool gas protruding inward from the circumstellar ring (see illustration). These fingers were produced long ago by the interaction of the high-speed wind with the dense circumstellar cloud.

The dense fingers and the visible circumstellar ring represent only the inner edge of a much greater, unknown amount of matter ejected long ago by SK -69. As the shock wave moves into the dense cloud, ultraviolet and X-radiation from the shock wave will heat much more of the circumstellar gas.

Then, as remarked by Richard McCray, one of the scientists involved in the Chandra research, “Supernova 1987A will be illuminating its own past.”

Original Source: Chandra X-ray Observatory

Saturn’s Rings Have an Atmosphere of their Own

Spectrum indicating atmosphere over rings. Image credit: NASA/JPL/SSI/SWRI/UCL Click to enlarge
Data from the NASA/ESA/ASI Cassini spacecraft indicate that Saturn’s majestic ring system has its own atmosphere – separate from that of the planet itself.

During its close fly-bys of the ring system, instruments on Cassini have been able to determine that the environment around the rings is like an atmosphere, composed principally of molecular oxygen.
This atmosphere is very similar to that of Jupiter’s moons Europa and Ganymede.

The finding was made by two instruments on Cassini, both of which have European involvement: the Ion and Neutral Mass Spectrometer (INMS) has co-investigators from USA and Germany, and the Cassini Plasma Spectrometer (CAPS) instrument has co-investigators from US, Finland, Hungary, France, Norway and UK.

Saturn’s rings consist largely of water ice mixed with smaller amounts of dust and rocky matter. They are extraordinarily thin: though they are 250 000 kilometres or more in diameter they are no more than 1.5 kilometres thick.

Despite their impressive appearance, there is very little material in the rings – if the rings were compressed into a single body it would be no more than 100 kilometres across.

The origin of the rings is unknown. Scientists once thought that the rings were formed at the same time as the planets, coalescing out of swirling clouds of interstellar gas 4000 million years ago. However, the rings now appear to be young, perhaps only hundreds of millions of years old.

Another theory suggests that a comet flew too close to Saturn and was broken up by tidal forces. Possibly one of Saturn’s moons was struck by an asteroid smashing it to pieces that now form the rings.

Though Saturn may have had rings since it formed, the ring system is not stable and must be regenerated by ongoing processes, probably the break-up of larger satellites.

Water molecules are first driven off the ring particles by solar ultraviolet light. They are then split into hydrogen, and molecular and atomic oxygen, by photodissocation. The hydrogen gas is lost to space, the atomic oxygen and any remaining water are frozen back into the ring material due to the low temperatures, and this leaves behind a concentration of oxygen molecules.

Dr Andrew Coates, co-investigator for CAPS, from the Mullard Space Science Laboratory (MSSL) at University College London, said: “As water comes off the rings, it is split by sunlight; the resulting hydrogen and atomic oxygen are then lost, leaving molecular oxygen.

“The INMS sees the neutral oxygen gas, CAPS sees molecular oxygen ions and an ?electron view? of the rings. These represent the ionised products of that oxygen and some additional electrons driven off the rings by sunlight.”

Dr Coates said the ring atmosphere was probably kept in check by gravitational forces and a balance between loss of material from the ring system and a re-supply of material from the ring particles.

Last month, Cassini-Huygens mission scientists celebrated the spacecraft’s first year in orbit around Saturn. Cassini performed its Saturn Orbit Insertion (SOI) on 1 July 2004 after its six-year journey to the ringed planet, travelling over three thousand million kilometres.

The Cassini-Huygens mission is a co-operative project of NASA, ESA and ASI, the Italian space agency.

Original Source: ESA Science

Predicting Times for Clear Space Weather

Biggest solar flare recorded by SOHO. Image credit: SOHO Click to enlarge
Scientists funded by NASA have made big strides in learning how to forecast “all clear” periods, when severe space weather is unlikely. The forecasts are important because radiation from particles from the sun associated with large solar flares can be hazardous to unprotected astronauts, airplane occupants and satellites.

“We have a much better insight into what causes the strongest, most dangerous solar flares, and how to develop forecasts that can predict an ‘all clear’ for significant space weather, for longer periods,” said Dr. Karel Schrijver of the Lockheed Martin Advanced Technology Center (ATC), Palo Alto, Calif. He is lead author of a paper about the research published in the Astrophysical Journal.

Solar flares are violent explosions in the atmosphere of the sun caused by the sudden release of magnetic energy. Like a rubber band twisted too tightly, stressed magnetic fields in the sun?s atmosphere (corona) can suddenly snap to a new shape. They can release as much energy as one, 10 billion megaton nuclear bomb.

Predicting space weather is a complicated problem. Solar forecasters focus principally on the complexity of solar magnetic field patterns to predict solar storms. This method is not always reliable, because solar storms require additional ingredients to occur. It has long been known large electrical currents must be present to power flares.

Insight into the causes of the largest solar flares came in two steps. “First, we discovered characteristic patterns of magnetic field evolution associated with strong electrical currents in the solar atmosphere,” said ATC’s Dr. Marc DeRosa, co-author of the paper. “It is these strong electrical currents that drive solar flares.”

Subsequently, the authors discovered the regions most likely to flare had new magnetic fields merge into them that were clearly out of alignment with the existing field. This emerging field from the solar interior appears to induce even more current as it interacts with the existing field.

The team also found flares do not necessarily occur immediately upon the emergence of a new magnetic field. Apparently the electrical currents must build up over several hours before the fireworks start. Predicting exactly when a flare will happen is like studying avalanches. They occur only after enough snow built up. Once the threshold is reached, the avalanche can happen anytime by processes not yet completely understood.

“We found the current-carrying regions flare two to three times more often than the regions without large currents,” Schrijver said. “Also, the average flare magnitude is three times greater for the group of active regions with large current systems than for the other group.”

The researchers made the discovery by comparing data about magnetic fields on the sun?s surface to the sharpest extreme-ultraviolet images of the solar corona. The magnetic maps were from the Michelson Doppler Imager (MDI) instrument on board Solar and Heliospheric Observatory (SOHO) spacecraft. SOHO is operated under a cooperative mission between the European Space Agency and NASA.

The corona images were from the NASA Transition Region and Coronal Explorer spacecraft (TRACE). The team also used computer models of a three-dimensional solar magnetic field without electrical currents based on SOHO images. Differences between images and models indicated the presence of large electrical currents.

“This is a result that is more than the sum of two individual missions,” said Dr. Dick Fisher, Director of NASA’s Sun-Solar System Connection Division. “It’s not only interesting scientifically, but has broad implications for society.”

For imagery about the research on the Web, visit: NASA News Release

Rhea’s Southern Pole

Southern polar region of Rhea. Image credit: NASA/JPL/SSI Click to enlarge
Like the rest of Rhea’s surface, the southern polar region of this Saturn moon has been extensively re-worked by cratering over the eons. This close-up shows that most sizeable craters have smaller, younger impact sites within them. Near the left lies an intriguing gash.
The largest well-defined crater visible here is an oval-shaped impact toward the upper right. The crater is 115 by 91 kilometers (71 by 57 miles) in size.

Cassini acquired this view during a distant flyby of Rhea (1,528 kilometers, or 949 miles across) on July 14, 2005.

The image was taken in visible light with the Cassini spacecraft narrow-angle camera at a distance of approximately 239,000 kilometers (149,000 miles) from Rhea and at a Sun-Rhea-spacecraft, or phase, angle of 56 degrees. The image was obtained using a filter sensitive to wavelengths of infrared light centered at 930 nanometers. The image scale is about 1 kilometer (0.6 miles) per pixel.

The Cassini-Huygens mission is a cooperative project of NASA, the European Space Agency and the Italian Space Agency. The Jet Propulsion Laboratory, a division of the California Institute of Technology in Pasadena, manages the mission for NASA’s Science Mission Directorate, Washington, D.C. The Cassini orbiter and its two onboard cameras were designed, developed and assembled at JPL. The imaging operations center is based at the Space Science Institute in Boulder, Colo.

For more information about the Cassini-Huygens mission visit http://saturn.jpl.nasa.gov . The Cassini imaging team homepage is at http://ciclops.org .

Original Source: NASA/JPL/SSI News Release