Ancient Floods on Mars

Perspective view of an ancient floodplain on Mars. Image credit: ESA. Click to enlarge.
This image, taken by the High Resolution Stereo Camera (HRSC) aboard ESA?s Mars Express spacecraft, shows a large depression called Iani Chaos and the upper reaches of a large outflow channel called Ares Vallis.

Image strips were taken in October 2004, during three orbits from a 350-kilometre altitude, with a resolution of 15 metres per pixel. The strips have then been matched to a mosaic that covers an area from 17.5? western longitude to 3? North. The Iani Chaos depression ? 180 kilometres long and 200 kilometres wide ? is connected to the beginning of Ares Vallis by a 100-kilometre wide transition zone.

From here, Ares Vallis continues its course for about 1400 kilometres through the ancient Xanthe Terra highlands, bordered by valley flanks up to 2000 metres high. Eventually Ares Vallis empties into Chryse Planitia.

This image helps illuminate the complex geological history of Mars. Ares Vallis is one of several big outflow channels on Mars in this region that formed billions of years ago. Many surface features suggest that erosion of large water flows had carved Ares Vallis in the Martian landscape.

Most likely gigantic floods ran downhill, carving a deep canyon into Xanthe Terra. Rocks eroded from the valley flanks were milled into smaller fractions and transported in the running water.

Finally this sedimentary load was deposited far north at the mouth of Ares Vallis in the Chryse plains, where NASA?s Mars Pathfinder landed in 1997 to search for traces of water with its small Sojourner rover.

The scene displayed in the image shows the transition zone between Iani Chaos and Ares Vallis. A chaotic distribution of individual blocks of rock and hills forms a disrupted pattern. These ?knobs? are several hundred metres high. Scientists suggest that they are remnants of a preexisting landscape that collapsed after cavities had formed beneath the surface.

The elongated curvature of features extending from south to north along with terraces, streamlined ‘islands’ and the smooth, flat surface in the valley centre are strong hints that it was running water that carved the valley.

Ice stored in possible cavities in the Martian highland might have been melted by volcanic heat. Pouring out, the melting water would have followed the pre-existing topography to the northern lowlands.

A hundred kilometres further, a ten-kilometre-wide valley arm merges into Ares Vallis from the west. Large amounts of water originating from Aram Chaos (outside the image) joined the stream of Ares Vallis. Fan-shaped deposits on the valley floor are the remnants of landslides at the northern flanks.

At the freshly eroded cliffs possible lava layers are visible: such layers are found almost everywhere in Xanthe Terra. Further downstream, another valley branch enters Ares Vallis from the east after passing through an eroded impact crater in Xanthe Terra. West of Ares Vallis, a subtler riverbed is running parallel to the main valley.

The High Resolution Stereo Camera (HRSC) experiment on the ESA Mars Express Mission is led by Principal Investigator (PI) Prof. Dr. Gerhard Neukum who is also responsible for the technical design of the camera. The science team of the experiment consists of 45 Co-Investigators from 32 institutions and ten nations.

The camera was developed at the German Aerospace Centre (DLR) under the leadership of the PI and constructed in cooperation with industrial partners (EADS-Astrium, Lewicki Microelectronic GmbH and Jena-Optronik GmbH).

Original Source: ESA News Release

Measuring the Shape of Stars

Galaxy Cluster Abell 2218 distorting the light from several more distant galaxies. Image credit: ESO. Click to enlarge.
Fifty years after his death, Albert Einstein’s work still provides new tools for understanding our universe. An international team of astronomers has now used a phenomenon first predicted by Einstein in 1936, called gravitational lensing, to determine the shape of stars. This phenomenon, due to the effect of gravity on light rays, led to the development of gravitational optics techniques, among them gravitational microlensing. It is the first time that this well-known technique has been used to determine the shape of a star.

Most of the stars in the sky are point-like, making it very difficult to evaluate their shape. Recent progress in optical interferometry has made it possible to measure the shape of a few stars. In June 2003, for instance, the star Achernar (Alpha Eridani) was found to be the flattest star ever seen, using observations from the Very Large Telescope Interferometer (see ESO Press Release for details about this discovery). Until now, only a few measurements of stellar shape have been reported, partly due to the difficulty of carrying such measurements. It is important, however, to obtain further accurate determinations of stellar shape, as such measurements help to test theoretical stellar models.

For the first time, an international team of astronomers [1], led by N.J. Rattenbury (from Jodrell Bank Observatory, UK), applied gravitational lensing techniques to determine the shape of a star. These techniques rely on the gravitational bending of light rays. If light coming from a bright source passes close to a foreground massive object, the light rays will be bent, and the image of the bright source will be altered. If the foreground massive object (the ‘lens’) is point-like and perfectly aligned with the Earth and the bright source, the altered image as seen from the Earth will be a ring shape, the so-called ‘Einstein ring’. However, most real cases differ from this ideal situation, and the observed image is altered in a more complicated way. The image below shows an example of gravitational lensing by a massive galaxy cluster.

Gravitational microlensing, as used by Rattenbury and his colleagues, also relies on the deflection of light rays by gravity. Gravitational microlensing is the term used to describe gravitational lensing events where the lens is not massive enough to produce resolvable images of the background source. The effect can still be detected as the distorted images of the source are brighter than the unlensed source. The observable effect of gravitational microlensing is therefore a temporary apparent magnification of the background source. In some cases, the microlensing effect may increase the brightness of the background source by a factor of up to 1000. As already pointed out by Einstein, the alignments required for the microlensing effect to be observed are rare. Moreover, as all stars are in motion, the effect is transitory and non-repeating. Microlensing events occur over timescales from weeks to months, and require long-term surveys to be detected. Such survey programs have existed since the 1990s. Today, two survey teams are operating: a Japan/New Zealand collaboration known as MOA (Microlensing Observations in Astrophysics) and a Polish/Princeton collaboration known as OGLE (Optical Gravitational Lens Experiment). The MOA team observes from New Zealand and the OGLE team from Chile. They are supported by two follow-up networks, MicroFUN and PLANET/RoboNET, that operate about a dozen telescopes around the globe.

The microlensing technique has been applied to search for dark matter around our Milky Way and other galaxies. This technique has also been used to detect planets orbiting around other stars. For the first time, Rattenbury and his colleagues were able to determine the shape of a star using this technique. The microlensing event that was used was detected in July 2002 by the MOA group. The event is named MOA 2002-BLG-33 (hereafter MOA-33). Combining the observations of this event by five ground-based telescopes together with HST images, Rattenbury and his colleagues performed a new analysis of this event.

The lens of event MOA-33 was a binary star, and such binary lens systems produce microlensing lightcurves that can provide much information about both the source and lens systems. The particular geometry of the observer, lens and source systems during the MOA-33 microlensing event meant that the observed time-dependent magnification of the source star was very sensitive to the actual shape of the source itself. The shape of the source star in microlensing events is usually assumed to be spherical. Introducing parameters describing the shape of the source star into the analysis allowed the shape of the source star to be determined.

Rattenbury and his colleagues estimated the MOA-33 background star to be slightly elongated, with a ratio between the polar and equatorial radius of 1.02 -0.02/+0.04. However, given the uncertainties of the measurement, a circular shape of the star cannot be completely excluded. The figure below compares the shape of the MOA-33 background star with those recently measured for Altair and Achernar. While both Altair and Achernar are only a few parsecs from the Earth, the MOA-33 background star is a more distant star (about 5000 parsecs from the Earth). Indeed, interferometric techniques can only be applied to bright (thus nearby) stars. On the contrary, the microlensing technique makes it possible to determine the shape of much more distant stars. Indeed, there is currently no alternative technique to measure the shape of distant stars.

This technique, however, requires very specific (and rare) geometrical configurations. From statistical considerations, the team estimated that about 0.1% of all detected microlensing events will have the required configurations. About 1000 microlensing events are observed every year. They should become even more numerous in the near future. The MOA group is presently commissioning a new Japan-supplied 1.8m wide-field telescope that will detect events at an increased rate. Also, a US led group is considering plans for a space-based mission called Microlensing Planet Finder. This is being designed to provide a census of all types of planets within the Galaxy. As a by-product, it would also detect events like MOA-33 and provide information on the shapes of stars.

Original Source: Jodrell Bank Observatory

Soyuz Launches Foton-M Spacecraft

Russian Soyuz rocket launches carrying Foton-M. Image credit: ESA. Click to enlarge.
An unmanned Foton-M spacecraft carrying a mainly European payload was put into orbit by a Russian Soyuz-U launcher today at 14:00 Central European Time (18:00 local time) from the Baikonur Cosmodrome in Kazakhstan.

Following the launch and nine minutes of propelled flight, the Foton-M2 spacecraft is now in low-earth orbit where it will remain for 16 days before its reentry module lands close to the Russian/Kazakh border.

During the mission European experiments and equipment will be monitored by ESA’s Operations Team at the Payload Operations Centre based at Esrange near Kiruna, Sweden. They will be responsible for receiving, evaluating and disseminating scientific data generated by European payloads on Foton such as the Fluidpac and Agat experiment facilities. During 6 of the 16 daily orbits, the Foton spacecraft will be in a suitable orbital position for Kiruna to receive signals from it. Should any experiment parameters need adjustment, the commands will be sent direct from Kiruna to the specific experiment facility.

The European payload carried by Foton-M2 covers a scientific programme consisting of 39 experiments in fluid physics, biology, material science, meteoritics, radiation dosimetry and exobiology. The European Space Agency has been cooperating with the Russian Space Agency on this type of scientific mission for 18 years. With 385 kg of European experiments and equipment out of the overall payload of 600 kg, this mission constitutes the largest European contribution that has been put into orbit on such missions. The Foton-M2 mission provides reflight opportunities for almost the entire Foton-M1 experiment programme lost due to launcher failure on 15 October 2002.

Applied research plays a prominent role with heat transfer experiments in the European FluidPac facility, chemical diffusion experiments in the SCCO (Soret Coefficients in Crude Oil), and material science investigations in the Agat and Polizon furnaces. These experiments are expected to contribute, respectively, to new heat-exchanger designs, to more efficient oil exploration processes, and to better semiconductor alloys.

As on previous missions, biological research receives a great deal of attention, this time with the emphasis on fundamental questions about the origin and spread of life forms in the universe. Biopan, which is hosting most of these experiments, is making its fifth scientific flight on a Foton mission. Education is also playing a part in the mission with a germination experiment, which has come from ESA’s student programme.

“Foton is one of the very important platforms that ESA uses for experimentation in weightlessness,” said Daniel Sacotte, ESA’s Director of Human Spaceflight, Microgravity and Exploration Programmes, “and with more than half the total available payload being taken up by European experiments and hardware, this shows the efforts that Europe is making to expand the boundaries of research in space to help improve life on Earth.”

The mission is being carried out under an agreement signed between ESA and the Russian Space Agency Roskosmos on 21 October 2003 covering two Foton flights (Foton-M2 and Foton-M3, scheduled for 2007), which will have a combined total of 660 kg of ESA-supplied scientific payloads on board. The agreement also ties in two Russian partner companies: TsSKB-Progress in Samara and the Barmin Design Bureau for General Engineering (????) in Moscow.

“This was the first Foton launch from the Baikonur Cosmodrome in Kazakhstan as all previous launches have been from the Plesetsk Cosmodrome in Russia” explains Antonio Verga, ESA’s Project Manager for Foton missions. “The Foton-M2 reentry module is expected to reenter earth’s atmosphere on 16 June and land in an uninhabitated area near the town of Orenburg, Russia, close to the Russian/Kazakh border. The capsule and the experiments will be recovered within a few hours of the landing. Time-sensitive ESA experiments will be flown back immediately to Rotterdam via Samara and turned over to researchers for analysis at ESA/ESTEC in Noordwijk, the Netherlands.”

Original Source: ESA News Release

What’s Up This Week – May 30 – June 5, 2005

NGC 4038/39. Image credit: Astro Physics. Click to enlarge.
Monday, May 30 – Legend tells us the constellation of Crater is the cup of the gods – cup befitting the god of the skies, Apollo. Who holds this cup, dressed in black? It’s the Raven, Corvus. The tale is a sad one – a story of a creature sent to fetch water for his master, only to tarry too long waiting on a fig to ripen. When he realized his mistake, the sorry Raven returned to Apollo with his cup and brought along the serpent Hydra in his claws as well. Angry, Apollo tossed them into the sky for all eternity and it is in the south they stay until this day.

This week it will be our pleasure to study the Cup and the Raven. The galaxies I have chosen are done particularly for those of us who still star hop. I will start with a “marker” star that should be easily visible unaided on a night capable of supporting this kind of study. The field stars are quite recognizable in the finder and this is an area that takes some work. Because these galaxies approach magnitude 13, they are best suited to the larger telescope.

Now, let’s go between map and sky and identify both Zeta and Eta Crater and form a triangle. Our mark is directly south of Eta the same distance as between the two stars. At low power, the 12.7 magnitude NGC 3981 sits inside a stretched triangle of stars. Upon magnification, an elongated, near edge-on spiral structure with a bright nucleus appears. Patience and aversion makes this “stand up” galaxy appear to have a vague fading at the frontiers with faint extensions. A moment of clarity is all it takes to see tiny star caught at the edge.

Tuesday, May 31 – For early morning observers in the Middle East, you can enjoy an event as the Moon occults Psi 1 Aquarii. Please check this IOTA webpage for details in your area. For all observers, have a look this morning before dawn to see a very pleasing pairing of the waning Moon and Mars, but if you live in southern Africa or South America, you see this as an occultation! Please check this IOTA webpage so you don’t miss it.

Tonight’s study object, 12.7 magnitude NGC 3956 is about a degree due south of NGC 3981. When first viewed, it appears as edge-on structure at low power. Upon study. it takes on the form of a highly inclined spiral. A beautiful multiple star, and a difficult double star also reside with the NGC 3956 – appearing almost to triangulate with it. Aversion brings up a very bright core region which over the course of time and study appears to extend away from the center, giving this very sweet galaxy more structure than can be called from it with one observation.

Wednesday, June 1 – Our galaxy for tonight is a little more than two degrees further south of our last study. The 12.8 magnitude NGC 3955 is a very even, elongated spiral structure requiring a minimum of aversion once the mind and eye “see” its position. Not particularly an impressive galaxy, the NGC 3955 does, however, have a star caught at the edge as well. After several viewings, the best structure I can pull from this one is a slight concentration toward the core.

Thursday, June 2 – Tonight we’ll study an interacting pair and all that is required is that you find 31 Corvii, an unaided eye star west of Gamma and Epsilon Corvii. Now we’re ready to nudge the scope about one degree north. The 11th magnitude NGC 4038/39 is a tight, but superior pair of interacting galaxies. Often referred to as either the “Ringtail” or the “Antenna”, this pair deeply captured the public’s imagination when photographed by the Hubble. (Unfortunately, we don’t have the Hubble, but what we have is set of optics and the patience to find them.) At low power the pair presents two very stellar core regions surrounded by a curiously shaped nebulosity. Now, drop the power on it and practice patience – because it’s worth it! When that perfect moment of clarity arrives, we have crackling structure. Unusual, clumpy, odd arms appear at strong aversion. Behind all this is a galactic “sheen” that hints at all the beauty seen in the Hubble photographs. It’s a tight little fellow, but worth every moment it takes to find it.

Friday, June 3 – Tonight return to 31 Corvii and head one half degree northwest to discover 11.6 magnitude NGC 4027. Relatively large, and faint at low power, this one also deserves both magnification and attention. Why? Because it rocks! It has a wonderful coma shape with a single, unmistakable bold arm. The bright nucleus seems to almost curl along with this arm shape and during aversion a single stellar point appears at its tip. This one is a real treat!

While out tonight, stay on watch for the peak of the Tau Herculids meteor shower. The radiant is near Corona Borealis. We will be in this stream for about a month and you can catch about 15 per hour maximum. Most are quite faint, but sharp-eyed observers will enjoy it.

Saturday, June 4 – Tonight let’s look to the sky again and fixate on Eta Crater – our study lay one half degree southeast. The 12.8 magnitude NGC 4033 is a tough call even for a large scope. Appearing elliptical at low power, it does take on some stretch at magnification. It is smallish, even and quite unremarkable. It requires good aversion and a bit of patience to find. Good luck!

Sunday, June 5 – The last of our studies resides by a star, one degree west of Beta Corvii. In order to “see” anything even remotely called structure in NGC 4462, this one is a high power only galaxy that is best when the accompanying star is kept out of the field as much as possible. It holds a definite stellar nucleus and a concentration that pulls away from it making it almost appear barred. On an exceptional night with a large scope, wide aversion and moments of clarity show what may be three to four glints inside the structure. Ultra tiny pinholes in another universe? Or perhaps an unimaginably huge, bright globular clusters? While attention is focused on trying to draw out these points, you’ll notice this galaxy’s structure much more clearly. Another true beauty and fitting way to end this particular study field.

If you’re just in the mood to skywatch, the stay up a little later to catch the Scorpiid meteor shower peak. The radiant will be near Ophiuchus and the fall rate is about 20 per hour with some fireballs.

The constellations of both Crater and Corvus hold many, many more such fine galaxy studies. Perhaps another year we shall hunt them all down, eh? But for now, our eyes are on Virgo for next week’s new Moon study. I look forward to the galaxy fields again, but not half as much as I look forward to taking you there. Until next week? May all your journeys be at Light Speed… ~Tammy Plotner

Monstrous Stars Spawn a Community of Smaller Stars

Spitzer view of the Carina Nebula, a well known nebula containing newborn stars in the Milky Way. Image credit: Spitzer. Click to enlarge.
The saga of how a few monstrous stars spawned a diverse community of additional stars is told in a new image from NASA’s Spitzer Space Telescope.

The striking picture reveals an eclectic mix of embryonic stars living in the tattered neighborhood of one of the most famous massive stars in our Milky Way galaxy, Eta Carinae. Astronomers say that radiation and winds from Eta Carinae and its massive siblings ripped apart the surrounding cloud of gas and dust, shocking the new stars into being.

“We knew that stars were forming in this region before, but Spitzer has shown us that the whole environment is swarming with embryonic stars of an unprecedented multitude of different masses and ages,” said Dr. Robert Gehrz, University of Minnesota, Twin Cities, a member of the team that made the Spitzer observations.

The results were presented yesterday at the 206th meeting of the American Astronomical Society in Minneapolis by Dr. Nathan Smith, lead investigator of the Spitzer findings, University of Colorado, Boulder.

Previous visible-light images of this region, called the Carina Nebula, show cloudy finger-like pillars of dust, all pointing toward Eta Carinae at the center. Spitzer’s infrared eyes cut through much of this dust to expose incubating stars embedded inside the pillars, as well as new star-studded pillars never before seen.

Eta Carinae, located 10,000 light-years from Earth, was once the second brightest star in the sky. It is so massive, more than 100 times the mass of our Sun, it can barely hold itself together. Over the years, it has brightened and faded as material has shot away from its surface. Some astronomers think Eta Carinae might die in a supernova blast within our lifetime.

Eta Carinae’s home, the Carina Nebula, is also quite big, stretching across 200 light-years of space. This colossal cloud of gas and dust not only gave birth to Eta Carinae, but also to a handful of slightly less massive sibling stars. When massive stars like these are born, they rapidly begin to shred to pieces the very cloud that nurtured them, forcing gas and dust to clump together and collapse into new stars. The process continues to spread outward, triggering successive generations of fewer and fewer stars. Our own Sun may have grown up in a similar environment.

The new Spitzer image offers astronomers a detailed “family tree” of the Carina Nebula. At the top of the hierarchy are the grandparents, Eta Carinae and its siblings, and below them are the generations of progeny of different sizes and ages.

“Now we have a controlled experiment for understanding how one giant gas and dust cloud can produce such a wide variety of stars,” said Gehrz.

The false colors in the Spitzer picture correspond to different infrared wavelengths. Red represents dust features and green shows hot gas. Embryonic stars are yellow or white and foreground stars are blue. Eta Carinae itself lies just off the top of image. It is too bright for infrared telescopes to observe.

JPL manages the Spitzer Space Telescope mission for NASA’s Science Mission Directorate, Washington. Science operations are conducted at the Spitzer Science Center at the California Institute of Technology in Pasadena. JPL is a division of Caltech. Spitzer’s infrared array camera, which took the picture of the Carina Nebula, was built by NASA Goddard Space Flight Center, Greenbelt, Md.; its development was led by Dr. Giovanni Fazio, Smithsonian Astrophysical Observatory, Cambridge, Mass.

Additional information about the Spitzer Space Telescope is available at: http://www.spitzer.caltech.edu/spitzer.

Original Source: Spitzer News Release

Andromeda is Three Times Larger Than Previously Believed

One small corner of the massive Andromeda galaxy (M31). Image credit: Subaru. Click to enlarge.
The lovely Andromeda galaxy appeared as a warm fuzzy blob to the ancients. To modern astronomers millennia later, it appeared as an excellent opportunity to better understand the universe. In the latter regard, our nearest galactic neighbor is a gift that keeps on giving.

Scott Chapman, from the California Institute of Technology, and Rodrigo Ibata, from the Observatoire Astronomique de Strasbourg in France, have led a team of astronomers in a project to map out the detailed motions of stars in the outskirts of the Andromeda galaxy. Their recent observations with the Keck telescopes show that the tenuous sprinkle of stars extending outward from the galaxy are actually part of the main disk itself. This means that the spiral disk of stars in Andromeda is three times larger in diameter than previously estimated.

At the annual summer meeting of the American Astronomical Society today, Chapman will outline the evidence that there is a vast, extended stellar disk that makes the galaxy more than 220,000 light-years in diameter. Previously, astronomers looking at the visible evidence thought Andromeda was about 70,000 to 80,000 light-years across. Andromeda itself is about 2 million light-years from Earth.

The new dimensional measure is based on the motions of about 3,000 of the stars some distance from the disk that were once thought to be merely the “halo” of stars in the region and not part of the disk itself. By taking very careful measurements of the “radial velocities,” the researchers were able to determine precisely how each star was moving in relation to the galaxy.

The results showed that the outlying stars are sitting in the plane of the Andromeda disk itself and, moreover, are moving at a velocity that shows them to be in orbit around the center of the galaxy. In essence, this means that the disk of stars is vastly larger than previously known.

Further, the researchers have determined that the nature of the “inhomogeneous rotating disk”-in other words, the clumpy and blobby outer fringes of the disk-shows that Andromeda must be the result of satellite galaxies long ago slamming together. If that were not the case, the stars would be more evenly spaced.

Ibata says, “This giant disk discovery will be very hard to reconcile with computer simulations of forming galaxies. You just don’t get giant rotating disks from the accretion of small galaxy fragments.”

The current results, which are the subject of two papers already available and a third yet to be published, are made possible by technological advances in astrophysics. In this case, the Keck/DEIMOS multi-object spectrograph affixed to the Keck II Telescope possesses the mirror size and light-gathering capacity to image stars that are very faint, as well as the spectrographic sensitivity to obtain highly accurate radial velocities.

A spectrograph is necessary for the work because the motion of stars in a faraway galaxy can only be detected within reasonable human time spans by inferring whether the star is moving toward us or away from us. This can be accomplished because the light comes toward us in discrete frequencies due to the elements that make up the star.

If the star is moving toward us, then the light tends to cram together, so to speak, making the light higher in frequency and “bluer.” If the star is moving away from us, the light has more breathing room and becomes lower in frequency and “redder.”

If stars on one side of Andromeda appear to be coming toward us, while stars on the opposite side appear to be going away from us, then the stars can be assumed to orbit the central object.

The extended stellar disk has gone undetected in the past because stars that appear in the region of the disk could not be known to be a part of the disk until their motions were calculated. In addition, the inhomogeneous “fuzz” that makes up the extended disk does not look like a disk, but rather appears to be a fragmented, messy halo built up from many previous galaxies’ crashing into Andromeda, and it was assumed that stars in this region would be going every which way.

“Finding all these stars in an orderly rotation was the last explanation anyone would think of,” says Chapman.

On the flip side, finding that the bulk of the complex structure in Andromeda’s outer region is rotating with the disk is a blessing for studying the true underlying stellar halo of the galaxy. Using this new information, the researchers have been able to carefully measure the random motions of stars in the stellar halo, probing its mass and the form of the elusive dark matter that surrounds it.

Although the main work was done at the Keck Observatory, the original images that posed the possibility of an extended disk were taken with the Isaac Newton Telescope’s Wide-Field Camera. The telescope, located in the Canary Islands, is intended for surveys, and in the case of this study, served well as a companion instrument.

Chapman says that further work will be needed to determine whether the extended disk is merely a quirk of the Andromeda galaxy, or is perhaps typical of other galaxies.

The main paper with which today’s AAS news conference is concerned will be published this year in The Astrophysical Journal with the title “On the Accretion Origin of a Vast Extended Stellar Disk Around the Andromeda Galaxy.” In addition to Chapman and Ibata, the other authors are Annette Ferguson, University of Edinburgh; Geraint Lewis, University of Sydney; Mike Irwin, Cambridge University; and Nial Tanvir, University of Hertfordshire.

Original Source: Caltech News Release

Carbon/Oxygen Stars Could Explode as Gamma Ray Bursts

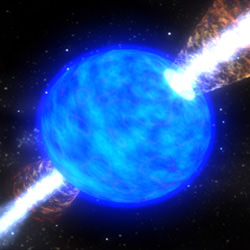
Artist illustration of a gamma-ray burst. Image credit: NASA. Click to enlarge.
Observations by two of the world’s largest telescopes provide strong evidence that a peculiar type of exploding star may be the origin of elusive gamma-ray bursts that have puzzled scientists for more than 30 years.

A team of astronomers from Italy, Japan, Germany and the United States, including the University of California, Berkeley, conclude from observations with the Keck and Subaru telescopes in Hawaii that naked carbon/oxygen stars that flatten as they collapse into a black hole are good candidates for the source of gamma-ray bursts.

Though astronomers have observed a couple of bursts associated with this type of supernova – a Type Ic supernova sometimes called a hypernova – the theory of how a hypernova produces gamma rays is still speculative. The new observations, though not a smoking gun, provide a major piece of evidence that the theory, called the collapsar model, is correct. The model explains how an asymmetric exploding star produces a tight beam of matter and energy out of each pole that generates an intense burst of gamma rays, while the absence of a hydrogen and helium envelope would allow the blast to escape.

“It appears that to produce a gamma-ray burst, a core-collapse supernova needs to be both asymmetric in its explosion mechanism, so that there is a natural axis along which matter can more easily squirt, and free of a hydrogen envelope, so that the jet doesn’t have to pummel through a lot of material,” said co-author Alex Filippenko, UC Berkeley professor of astronomy.

The team, led by Paolo Mazzali of the Trieste Observatory in Italy and the Max-Planck Institute for Astrophysics in Garching, Germany, reported its findings in a paper appearing in the May 27 issue of Science.

The fact that a gamma-ray burst was not observed in association with this supernova is actually in accord with predictions, said UC Berkeley graduate student Ryan Foley, a member of the team.

“These observations suggest that the collapsar model is probably correct and that some of these Type Ic supernovae appear to be off-axis gamma-ray bursts, in which the gamma-ray burst is pointing in some direction other than Earth,” Foley said.

Gamma-ray bursts are brief but bright flashes of X-rays and gamma rays that seem to go off randomly in the sky about once a day, briefly outshining the sun a million trillion times. It took until 1997 to establish that they originate outside our Milky Way Galaxy, and only within the past few years have astronomers gotten tantalizing hints that the bursts are associated with supernovae.

Because they are so bright, gamma-ray bursts have to be a collimated beam, similar to but tighter than the cone of light emitted by a lighthouse. Otherwise, the energy in the explosion would be equivalent to instantaneously converting the mass of several suns into a fireball of energy.

The most popular scenario is that a collapsing star generates two highly collimated beams or jets of particles and energy that flash outward from the poles. The particles and energy generate a shock wave when they hit gas and dust around the star, which in turn accelerates particles to energies at which they emit high-energy light: gamma rays and X-rays. The initial burst fades over a few seconds, but the resulting shock waves (the “afterglow”) can be visible to optical, radio and X-ray telescopes for days after the explosion.

A possible candidate for the type of supernova that could produce a gamma-ray burst is the Type Ic supernova. Type Ic supernovae result from massive stars whose winds have shed their outer envelopes of hydrogen and often all their helium, or that have lost these outer layers to a binary companion. Only the core is left, composed of the elements produced by fusion in the star’s center – mostly carbon and oxygen but other heavy elements as well, down to a solid iron center.

The collapsar theory proposes that the solid iron sphere at the very core of the star collapses under gravity to a black hole, but that the split-second collapse takes place in a unique way. As the iron and surrounding matter fall inward, the spin of the core increases, flattening the in-falling material into a disk that flows inward along the equator. The congestion of in-falling matter pushes some of it right back out along the path of least resistance – the two blowholes at either pole.

The matter shot out from the poles rams into the other layers of the star, which it may not be able to penetrate. The lack of a hydrogen and helium envelope presumably increases the chances the jet will punch through.

“It has so much energy that it pushes through these outer layers of the star, which are of relatively small density compared to the disk of in-falling material in the center of the star,” said Foley. “Eventually, if it punches out, you have a gamma-ray jet. Some Type Ic supernovae may be failed gamma-ray bursts, which means the jet tried to push out, but there was too much material in the way, and it never actually broke out. That would explain why we don’t see gamma-ray bursts associated with some of these objects.”

If the theory is true, astronomers should see different things depending on whether the jet is aimed toward Earth or away from it. If the jet is coming out perpendicular to our line of sight, for example, no gamma-ray burst would be visible, but other aspects of the expanding supernova blast wave should be observable. In particular, the spectrum of the supernova a year or so after its explosion should show emission lines of elements, such as oxygen, that are split, one shifted slightly to lower wavelengths and the other shifted to higher wavelengths. The two lines would come from opposite sides of the expanding disk around the equatorial region of the remnant black hole, one Doppler shifted toward the red because it is moving away from us, the other blueshifted because it is moving toward us. Such split or double lines would not be visible from a polar perspective.

About two years ago, on Oct. 25, 2003, UC Berkeley researchers had discovered a Type Ic supernova using Filippenko’s automated supernova search telescope, the Katzman Automatic Imaging Telescope (KAIT) at the University of California’s Lick Observatory. Called SN 2003jd, the supernova was about 260 million light years away in the constellation Aquarius. Though no associated gamma-ray burst was recorded, the supernova appeared to be as bright as the supernovae previously associated with gamma-ray bursts, so the international team reporting this week in Science decided to look again at the supernova, taking its spectrum in search of double-peaked emission lines.

“These observations were actually guided by our theoretical predictions,” Mazzali said. “The idea was that a bright Type Ic supernova, not accompanied by a gamma-ray burst, could be just what we were looking for: an off-axis event which could confirm our predictions.”

Koji Kawabata from Hiroshima University, Ken’ichi Nomoto of the University of Tokyo and his colleagues observed the remnant nebula with the 8.2-meter Subaru telescope on Sept. 12, 2004, about 330 days after it blew. Subsequently, Filippenko and Foley turned the 10-meter Keck telescope on the nebula on Oct. 19, 2004, about 370 days after the initial explosion, to obtain spectral images with the Low Resolution Imaging Spectrometer (LRIS). Both telescopes sit atop Mauna Kea volcano on the island of Hawaii. Subaru is operated by the National Astronomical Observatory of Japan, while the Keck Observatory is operated by the California Association for Research in Astronomy, whose board of directors includes representatives from the California Institute of Technology (Caltech) and UC.

Kawabata, Mazzali and his team analyzed the spectra, revealing that they exhibit split oxygen and magnesium emission lines exactly as would be expected if the collapsar model of gamma-ray production were correct. This was the first Type Ic supernova to show split oxygen lines.

“Jets are a signature of the model, which means that not all explosions will be pointed directly at us. If every time we looked at these objects they appeared to be pointing at us, that would mean the model is probably flawed,” Foley said. “The model predicts that a certain percentage of these objects should look like this supernova (SN 2003jd). Now that we’ve found one of these, the credibility of the model has increased.”

To see such double oxygen lines, the supernova nebula would have to be viewed within 20 degrees of the expanding disk, a rare situation that could explain why other Type Ic supernovae, including some associated with a gamma-ray burst, do not show the split oxygen line.

“(Our observations) strengthen the connection between gamma-ray bursts and Type Ic supernovae by showing that the Type Ic SN 2003jd appears to indeed have been an asymmetric explosion whose main axis of ejection happened not to be pointing at us,” Filippenko said.

Other coauthors of the paper are Keiichi Maeda, Jinsong Deng and Nozomu Tominaga of the University of Tokyo; Enrico Ramirez-Ruiz of the Institute for Advanced Study in Princeton, New Jersey; Stefano Benetti of the Astronomical Observatory of Padova, Italy; Elena Pian of the Trieste Observatory; Youichi Ohyama of the Subaru Telescope; Masanori Iye of Japan’s National Astronomical Observatory; Thomas Matheson of the National Optical Astronomy Observatory in Tuscon, Ariz.; Lifan Wang of Lawrence Berkeley National Laboratory; and Avishay Gal-Yam of Caltech.

The work was supported in part by the National Science Foundation, the Japan Society for the Promotion of Science and Japan’s Ministry of Education, Culture, Sports, Science and Technology.

Original Source: Berkeley News Release

Shuttle Getting an Upgraded Fuel Tank

Discovery rolls back to the Vehicle Assembly Building for an upgrade. Image credit: NASA. Click to enlarge.
The Space Shuttle Discovery is back in the Vehicle Assembly Building (VAB) at NASA’s Kennedy Space Center, Fla. The Shuttle will get a new, modified external fuel tank to ensure a safe Return to Flight mission (STS-114).

Discovery, carried by a Crawler Transporter, entered the VAB at 4:30 p.m. EDT. The 10-hour, 4.2 mile trip from Launch Pad 39B was briefly interrupted due to an over heated bearing on the Transporter. Today’s rollback was the 15th in Space Shuttle Program history.

“Rolling back Discovery was the right thing to do and demonstrates our commitment to a safe Return to Flight,” said Shuttle Program Manager Bill Parsons. “We will continue to focus on the processing milestones and complete the additional analysis we determined was required, so that we continue to move toward a launch during the July window.”

Technicians will de-mate Discovery from its External Tank (ET-120) and Solid Rocket Boosters on May 31. Discovery will be attached to ET-121 on June 7. ET-121 was originally scheduled to fly with the Shuttle Atlantis on the second Return to Flight mission (STS-121).

In the VAB, a new heater will be added to ET-121 on the feedline bellows. It is the part of the pipeline that carries liquid oxygen to the Shuttle’s main engines, to minimize potential ice and frost buildup. The tank also has several safety improvements, including an improved bipod fitting that connects it to the Orbiter.

In addition, NASA’s second redesigned tank has been outfitted with temperature sensors and accelerometers, used to measure vibration. These sensors will gather information about the tank’s performance during flight.

After the heater is added to ET-121 and the Shuttle is attached to its new propulsion elements, Discovery will roll back out to Launch Pad 39B in mid-June. Discovery’s payload, the Italian-built Multi-Purpose Logistics Module Raffaello, will be installed in the payload bay, while the Shuttle is on the pad.

Launch of Discovery for STS-114 is targeted for July 13. The launch window extends to July 31. During its 12-day mission, Discovery’s seven-person crew will test new hardware and techniques to improve Shuttle safety and deliver supplies to the International Space Station.

Video from the rollback will feed on NASA TV, available on the Web and via satellite in the continental U.S. on AMC-6, Transponder 9C, C-Band, at 72 degrees west longitude. The frequency is 3880.0 MHz. Polarization is vertical, and audio is monaural at 6.80 MHz. It’s available in Alaska and Hawaii on AMC-7, Transponder 18C, C-Band, at 137 degrees west longitude. The frequency is 4060.0 MHz. Polarization is vertical, and audio is monaural at 6.80 MHz. For NASA TV information and schedules on the Internet, visit: http://www.nasa.gov/ntv

Photos of the rollback are available on the Web at: http://mediaarchive.ksc.nasa.gov/index.cfm

For the latest information about NASA’s Return to Flight efforts, visit: http://www.nasa.gov/returntoflight

Original Source: NASA News Release

Dark Spots on the Moon Show a Turbulent Solar System

The Moon and its dark spots. Image credit: NASA. Click to enlarge.
People of every culture have been fascinated by the dark “spots” on the Moon, which seem to compose the figure of a rabbit, frogs or the face of a clown. With the Apollo missions, scientists found that these features are actually huge impact basins that were flooded with now-solidified lava. One surprise was that these basins formed relatively late in the history of the early solar system – approximately 700 million years after the formation of the Earth and Moon. Many scientists now believe that these lunar impact basins bear witness to a huge spike in the bombardment rate of the planets – called the late heavy bombardment (LHB). The cause of such an intense bombardment, however, is considered by many to be one of the best-preserved mysteries of solar system history.

In a series of three papers published in this week’s issue of the journal Nature, an international team of planetary scientists, Rodney Gomes (National Observatory of Brazil), Harold Levison (Southwest Research Institute, United States), Alessandro Morbidelli (Observatoire de la C?te d’Azur, France) and Kleomenis Tsiganis (OCA and University of Thessaloniki, Greece) – brought together by a visitor program hosted at the Observatoire de la C?te d’Azur in Nice – proposed a model that not only naturally solves the mystery of the origin of the LHB, but also explains many of the observed characteristics of the outer planetary system.

This new model envisions that the four giant planets, Jupiter, Saturn, Uranus and Neptune, formed in a very compact orbital configuration, which was surrounded by a disk of small objects made of ice and rock (known as “planetesimals”). Numerical simulations by the Nice team shows that some of these planetesimals slowly leaked out of the disk due to the gravitational effects of the planets. The planets scattered these smaller objects throughout the solar system, sometimes outward and sometimes inward.

“As Isaac Newton taught us, for every action there is an equal and opposite reaction,” says Tsiganis. “If a planet throws a planetesimal out of the solar system, the planet moves toward the Sun, just a tiny bit, in compensation. If, on the other hand, the planet scatters the planetesimal inward, the planet jumps slightly farther from the Sun.”

Numerical simulations show that, on average, Jupiter moved inward while the other giant planets moved outward.

Initially, this was a very slow process, taking millions of years for the planets to move a small amount. Then, according to this new model, after 700 million years, the situation suddenly changed. At that time, Saturn migrated through the point where its orbital period was exactly twice that of Jupiter’s. This special orbital configuration caused Jupiter’s and Saturn’s orbits to suddenly become more elliptical.

“This caused the orbits of Uranus and Neptune to go nuts,” says Gomes. “Their orbits became very eccentric and they started to gravitationally scatter off each other – and Saturn too.”

The Nice team argues that this evolution of Uranus’ and Neptune’s orbits caused the LHB on the Moon. Their computer simulations show that these planets very quickly penetrated the planetesimal disk, scattering objects throughout the planetary system. Many of these objects entered the inner solar system where they peppered the Earth and Moon with impacts. In addition, the whole process destabilized the orbits of asteroids, which then would have also contributed to the LHB. Finally, the gravitational effects of the planetesimal disk caused Uranus and Neptune to evolve onto their current orbits.

“It’s very convincing,” says Levison. “We have made several dozen simulations of this process, and statistically the planets ended up on orbits very similar to the ones that we see, with the correct separations, eccentricities and inclinations. So, in addition to the LHB, we can also explain the orbits of the giant planets. No other model has ever accomplished either thing before.”

However, there was one more hurdle to overcome. The solar system currently contains a population of asteroids that follow essentially the same orbit as Jupiter, but lead or trail that planet by an angular distance of roughly 60 degrees. Computer simulations show that these bodies, known as the “Trojan asteroids,” would have been lost as the giant planets’ orbits changed.

“We sat around for months worrying about this problem, which seemed to invalidate our model,” says Morbidelli, “until we realized that if a bird can escape from an open cage, another one can come and nest in it.”

The Nice team found that some of the very objects that were driving the planetary evolution, and which caused the LHB, would also have been captured into Trojan asteroid orbits. In the simulations, the trapped Trojans turned out to reproduce the orbital distribution of the observed Trojans, which was unexplained up to now. The total predicted mass of the trapped objects was also consistent with the observed population.

Taken in total, the Nice team’s new model naturally explains the orbits of the giant planets, the Trojan asteroids and the LHB to unprecedented accuracy. “Our model explains so many things that we believe it must be basically correct,” says Mordibelli. “The structure of the outer solar system shows that the planets probably went through a shake up well after the planet formation process ended.”

Original Source: SWRI News Release

Mysterious Spot on Titan Puzzles Astronomers

Titan and its strange spot viewed in different wavelengths. Image credit: NASA/JPL/SSI. Click to enlarge.
Saturn’s moon Titan shows an unusual bright spot that has scientists mystified. The spot, approximately the size and shape of West Virginia, is just southeast of the bright region called Xanadu and is visible to multiple instruments on the Cassini spacecraft.

The 483-kilometer-wide (300-mile) region may be a “hot” spot — an area possibly warmed by a recent asteroid impact or by a mixture of water ice and ammonia from a warm interior, oozing out of an ice volcano onto colder surrounding terrain. Other possibilities for the unusual bright spot include landscape features holding clouds in place or unusual materials on the surface.

“At first glance, I thought the feature looked strange, almost out of place,” said Dr. Robert H. Brown, team leader of the Cassini visual and infrared mapping spectrometer and professor at the Lunar and Planetary Laboratory, University of Arizona, Tucson. “After thinking a bit, I speculated that it was a hot spot. In retrospect, that might not be the best hypothesis. But the spot is no less intriguing.”

The Cassini spacecraft flew by Titan on March 31 and April 16. Its visual and infrared mapping spectrometer, using the longest, reddest wavelengths that the spectrometer sees, observed the spot, the brightest area ever observed on Titan.

Cassini’s imaging cameras saw a bright, 550-kilometer-wide (345-mile) semi-circle at visible wavelengths at this same location on Cassini’s December 2004 and February 2005 Titan flybys. “It seems clear that both instruments are detecting the same basic feature on or controlled by Titan’s surface,” said Dr. Alfred S. McEwen, Cassini imaging team scientist, also of the University of Arizona. “This bright patch may be due to an impact event, landslide, cryovolcanism or atmospheric processes. Its distinct color and brightness suggest that it may have formed relatively recently.”

Other bright spots have been seen on Titan, but all have been transient features that move or disappear within hours, and have different spectral (color) properties than this feature. This spot is persistent in both its color and location. “It’s possible that the visual and infrared spectrometer is seeing a cloud that is topographically controlled by something on the surface, and that this weird, semi-circular feature is causing this cloud,” said Dr. Elizabeth Turtle, Cassini imaging team associate, also from the Lunar and Planetary Laboratory.

“If the spot is a cloud, then its longevity and stability imply that it is controlled by the surface. Such a cloud might result from airflow across low mountains or outgassing caused by geologic activity,” said Jason Barnes, a postdoctoral researcher working with the visual and infrared mapping spectrometer team at the University of Arizona.

The spot could be reflected light from a patch of terrain made up of some exotic surface material. “Titan’s surface seems to be mostly dirty ice. The bright spot might be a region with different surface composition, or maybe a thin surface deposit of non-icy material,” Barnes added.

Scientists have also considered that the spot might be mountains. If so, they’d have to be much higher than the 100-meter-high (300-foot) hills Cassini’s radar altimeter has seen so far. Scientists doubt that Titan’s crust could support such high mountains.

The visual and infrared mapping spectrometer team will be able to test the hot spot hypothesis on the July 2, 2006, Titan flyby, when they take nighttime images of the same area. If the spot glows at night, researchers will know it’s hot.

For more information about the Cassini-Huygens mission visit http://saturn.jpl.nasa.gov. For additional images visit the visual and infrared mapping spectrometer page at http://wwwvims.lpl.arizona.edu and the Cassini imaging team homepage http://ciclops.org .

The Cassini-Huygens mission is a cooperative project of NASA, the European Space Agency and the Italian Space Agency. The Jet Propulsion Laboratory, a division of the California Institute of Technology in Pasadena, manages the mission for NASA’s Science Mission Directorate, Washington, D.C. The Cassini orbiter and its two onboard cameras were designed, developed and assembled at JPL. The visual and infrared mapping spectrometer team is based at the University of Arizona. The imaging team is based at the Space Science Institute in Boulder, Co.

Original Source: NASA/JPL News Release