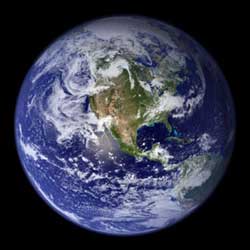
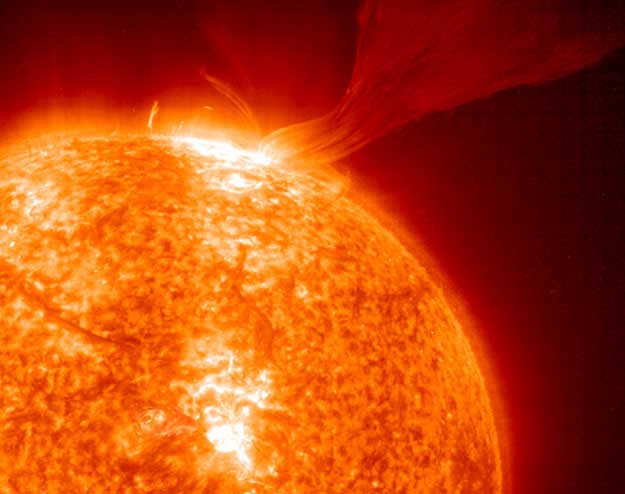
Plankton Bloom in the Bay of Biscay

Envisat image of a plankton bloom of the coast of Spain. Image credit: ESA. Click to enlarge.
A break in the clouds in an Envisat observation of the west coast of Europe this week reveals a striking marine phytoplankton bloom currently dominating the Bay of Biscay.

Phytoplankton are microscopic marine plants that drift on or near the surface of the sea, by far the most abundant type of life found in the ocean. Just like plants on land they employ green-pigmented chlorophyll for photosynthesis – the process of turning sunlight into chemical energy.

While individually microscopic, phytoplankton chlorophyll collectively tints the surrounding ocean waters, providing a means of detecting these tiny organisms from space with dedicated ‘ocean colour’ sensors.

As if dye had been placed in the water, the greenish colour highlights whirls of ocean currents. Floating freely in the water, phytoplankton are sensitive not just to available sunlight but also to local environmental variations such as nutrient levels, temperature, currents and winds. Favourable conditions lead to concentrated ‘blooms’ like the one we see here.

Monitoring phytoplankton is important because they form the base of the marine food web ? sometimes known as ‘the grass of the sea’.

On a local level, out-of-control blooms can devastate marine life, de-oxygenating whole stretches of water, while some species of phytoplankton and marine algae are toxic to both fish and humans. It is useful that fishermen, fish farmers and public health officials know about such events as soon as possible.

Globally, phytoplankton are a major influence on the amount of carbon in the atmosphere, and hence need to be modelled into calculations of future climate change.

Phytoplankton blooms occur frequently at this time of year in the Bay of Biscay. This ‘spring bloom’ takes place as cold, nutrient-rich waters are finally exposed to sufficient sunlight to trigger rapid phytoplankton growth. The bloom is signaling a new cycle of biological production, important for the local fishing industry – the Bay of Biscay being a rich fishery.

Envisat’s Medium Resolution Imaging Spectrometer (MERIS) instrument is optimised for ocean colour detection, but also returns detailed multispectral information on land cover, clouds and atmospheric aerosols.

MERIS acquires continuous daytime observations in Reduced Resolution mode as part of its background mission. This is a detail from a MERIS Reduced Resolution image was acquired on 2 May 2005. The full version, viewable by clicking the high-resolution image, has a spatial resolution of 1200 metres and covers an area of 838 by 2277 km.

Original Source: ESA News Release

Solar Minimum Doesn’t Mean a Calm Sun

A huge solar explosion in 2001. Image credit: SOHO. Click to enlarge.
There’s a myth about the sun. Teachers teach it. Astronomers repeat it. NASA mission planners are mindful of it.

Every 11 years solar activity surges. Sunspots pepper the sun; they explode; massive clouds of gas known as “CMEs” hurtle through the solar system. Earth gets hit with X-rays and protons and knots of magnetism. This is called solar maximum.

There’s nothing mythical about “Solar Max.” During the most recent episode in 2000 and 2001, sky watchers saw auroras as far south as Mexico and Florida; astronomers marveled at the huge sunspots; satellite operators and power companies struggled with outages.

Now the sun is approaching the opposite extreme of its activity cycle, solar minimum, due in 2006. We can relax because, around solar minimum, the sun is quiet. Right?

“That’s the myth,” says solar physicist David Hathaway of the NASA Marshall Space Flight Center. The truth is, solar activity never stops, “not even during solar minimum.”

To show that this is so, Hathaway counted the number of X-class solar flares each month during the last three solar cycles, a period spanning 1970 to the present. X-flares are the most powerful kind of solar explosions; they’re associated with bright auroras and intense radiation storms. “There was at least one X-flare during each of the last three solar minima,” says Hathaway.

This means astronauts traveling through the solar system, far from the protection of Earth’s atmosphere and magnetic field, can’t drop their guard–ever.

Recent events bear this out: Rewind to January 10, 2005. It’s four years since solar maximum and the sun is almost blank–only two tiny sunspots are visible from Earth. The sun is quiet.

The next day, with stunning rapidity, everything changes. On January 11th, a new ‘spot appears. At first no more than a speck, it quickly blossoms into a giant almost as big as the planet Jupiter. “It happened so quickly,” recalls Hathaway. “People were asking me if they should be alarmed.”

Between January 15th and 20th, the sunspot unleashed two X-class solar flares, sparked auroras as far south as Arizona in the United States, and peppered the Moon with high-energy protons. Lunar astronauts caught outdoors, had there been any, would’ve likely gotten sick.

So much for the quiet sun.

It almost happened again last month. On April 25, 2005, small sunspot emerged and–d?j? vu–it grew many times wider than Earth in only 48 hours. This time, however, there were no eruptions.

Why not? No one knows.

Sunspots are devilishly unpredictable. They’re made of magnetic fields poking up through the surface of the sun. Electrical currents deep inside our star drag these fields around, causing them to twist and tangle until they become unstable and explode. Solar flares and CMEs are by-products of the blast. The process is hard to forecast because the underlying currents are hidden from view. Sometimes sunspots explode, sometimes they don’t. Weather forecasting on Earth was about this good … 50 years ago.

Researchers like Hathaway study sunspots and their magnetic fields, hoping to improve the woeful situation. “We’re making progress,” he says.

Good thing. Predicting solar activity is more important than ever. Not only do we depend increasingly on sun-sensitive technologies like cell phones and GPS, but also NASA plans to send people back to the Moon and then on to Mars. Astronauts will be “out there” during solar maximum, solar minimum and all times in between.

Will the sun be quiet when it’s supposed to be? Don’t count on it.

Original Source: Science@NASA Article

More Sunlight is Hitting the Earth

Global map of brightness increases. Yellow represents an increase, brown is decreasing. Image credit: PNL. Click to enlarge.
Earth’s surface has been getting brighter for more than a decade, a reversal from a dimming trend that may accelerate warming at the surface and unmask the full effect of greenhouse warming, according to an exhaustive new study of the solar energy that reaches land.

Ever since a report in the late 1980s uncovered a 4 to 6 percent decline of sunlight reaching the planet’s surface over 30 years since 1960, atmospheric scientists have been trying out theories about why this would be and how it would relate to the greenhouse effect, the warming caused by the buildup of carbon dioxide and other gasses that trap heat in the atmosphere.

Meanwhile, a group led by Martin Wild at the Swiss Federal Institute of Technology in Zurich, home of the international Baseline Surface Radiation Network (BSRN) archive, had gone to work collecting surface measurements and crunching numbers.

“BSRN didn’t get started until the early ’90s and worked hard to update the earlier archive,” said Charles N. Long, senior scientist at the Department of Energy’s Pacific Northwest National Laboratory and co-author of a BSRN report in this week’s issue (Friday, May 6) of the journal Science.

“When we looked at the more recent data, lo and behold, the trend went the other way,” said Long, who conducted the work under the auspices of DOE’s Atmospheric Radiation Measurement (ARM) program.

Data analysis capabilities developed by ARM research were crucial in the study, which reveals the planet’s surface has brightened by about 4 percent the past decade. The brightening trend is corroborated by other data, including satellite analyses that are the subject of another paper in this week’s Science.

Sunlight that isn’t absorbed or reflected by clouds as it plunges earthward will heat the surface. Because the atmosphere includes greenhouse gasses, solar warming and greenhouse warming are related.

“The atmosphere is heated from the bottom up, and more solar energy at the surface means we might finally see the increases in temperature that we expected to see with global greenhouse warming,” Long said.

In fact, he said, many believe that we have already been seeing those effects in our most temperature-sensitive climates, with the melting of polar ice and high altitude glaciers.

The report’s authors stopped short of attributing a cause to the cycle of surface dimming and brightening, but listed such suspects as changes in the number and composition of aerosols?liquid and solid particles suspended in air?and how aerosols affect the character of clouds. Over the past decade, the ARM program has built a network of instrumentation sites to sample cloud characteristics and energy transfer in a variety of climates, from tropical to polar.

“The continuous, sophisticated data from these sites will be crucial for determining the causes,” Long said.

Long also pointed out that 70 percent of the planet’s surface is ocean, for which we have no long-term surface brightening or dimming measurements.

PNNL (www.pnl.gov) is a DOE Office of Science laboratory that solves complex problems in energy, national security, the environment and life sciences by advancing the understanding of physics, chemistry, biology and computation. PNNL employs more than 4,000 staff, has a $650 million annual budget, and has been managed by Ohio-based Battelle since the lab’s inception in 1965.

Original Source: PNL News Release

Artificial Gravity Will Help Astronauts Handle Spaceflight

The Short Radius Centrifuge will test human’s ability to withstand gravity. Image credit: NASA. Click to enlarge.
NASA will use a new human centrifuge to explore artificial gravity as a way to counter the physiologic effects of extended weightlessness for future space exploration.

The new research will begin this summer at the University of Texas Medical Branch (UTMB) at Galveston, overseen by NASA’s Johnson Space Center (JSC) in Houston. A NASA-provided Short-Radius Centrifuge will attempt to protect normal human test subjects from deconditioning when confined to strict bed rest.

Bed rest can closely imitate some of the detrimental effects of weightlessness on the body. For the first time, researchers will systematically study how artificial gravity may serve as a countermeasure to prolonged simulated weightlessness.

“The Vision for Space Exploration includes destinations beyond the moon,” said Dr. Jeffrey Davis, director of JSC’s Space Life Sciences Directorate. “This artificial gravity research is an important step in determining if spacecraft design options should include artificial gravity. The collaboration between NASA, the National Institutes of Health (NIH), UTMB and Wyle Laboratories demonstrates the synergy of government, academic and industry partnerships,” he added.

For the initial study this summer, 32 test subjects will be placed in a six-degree, head-down, bed-rest position for 21 days to simulate the effects of microgravity on the body. Half that group will spin once a day on the centrifuge to determine how much protection it provides from the bed-rest deconditioning. The “treatment” subjects will be positioned supine in the centrifuge and spun up to a force equal to 2.5 times Earth’s gravity at their feet for an hour and then go back to bed.

“The studies may help us to develop appropriate prescriptions for using a centrifuge to protect crews and to understand the side effects of artificial gravity on people,” said Dr. Bill Paloski, NASA principal scientist in JSC’s Human Adaptation and Countermeasures Office and principal investigator for the project. “In the past, we have only been able to examine bits and pieces. We’ve looked at how artificial gravity might be used as a countermeasure for, say, cardiovascular changes or balance disorders. This will allow us to look at the effect of artificial gravity as a countermeasure for the entire body,” he added.

The research will take place in UTMB’s NIH-sponsored General Clinical Research Center. The study supports NASA’s Artificial Gravity Biomedical Research Project.

“Physicians and scientists from all over the world will travel to UTMB to study the stresses that spaceflight imposes on cardiovascular function, bone density, neurological activity and other physiological systems,” said Dr. Adrian Perachio, executive director of strategic research collaborations at UTMB. “This is an excellent example of collaboration among the academic, federal and private sectors in research that will benefit the health of both astronauts and those of us on Earth,” he added.

The centrifuge was built to NASA specifications by Wyle Laboratories in El Segundo, Calif. It was delivered to UTMB in August 2004 and will complete design verification testing, validation of operational procedures and verification of science data this spring. The centrifuge has two arms with a radius of 10 feet (3 meters) each. The centrifuge can accommodate one subject on each arm.

Paloski has assembled a team of 24 investigators who designed the study. The first integrated research program is expected to end in the fall of 2006.

Original Source: NASA News Release

Eta Aquarid Meteor Shower Peaks on May 6

Look towards the Aquarius constellation in the early morning on May 6. Image credit: NASA. Click to enlarge.
The eta Aquarid meteor shower peaks on May 5th and 6th. The best time to look, no matter where you live, is during the hours before local sunrise on both days.

This is mainly a southern hemisphere shower, but northern observers can see it, too. In the United States, for example, observers far from city lights might see 5 to 10 meteors per hour. In Australia or South America, rates are better, between 15 and 60 meteors per hour.

This year (2005) the eta Aquarid meteors will be streaming from a point in the sky coincidentally close to Mars. The red planet, which is approaching Earth for a close encounter in October 2005, is already eye-catching.

Eta Aquarid meteors come from the most famous comet of all: Halley’s Comet. Our planet passes close to the orbit of Halley’s Comet twice a year. Although the comet itself is very far away [diagram] tiny pieces of Halley are still moving through the inner solar system. They’re leftovers from the comet’s many close encounters with the Sun. Each time Halley returns (every 76 years) solar heating evaporates about 6 meters of ice and rock from its nucleus! Debris particles called meteoroids, usually no bigger than grains of sand, gradually spread along the comet’s orbit forming an elongated stream of space dust. Earth passes through the debris stream once in May and again in October.

The eta Aquarids are named after a star in the constellation Aquarius. The star has nothing to do with the meteor shower except that the shower’s radiant happens to lie nearby. (The radiant of a meteor shower is a point in the sky from which the meteors appear to stream.) The eta Aquarid’s sister shower in October is called the Orionids, after the constellation Orion.

The eta Aquarid radiant never climbs very far above the horizon in the northern hemisphere. That’s why it is a better shower south of the equator. Most years northerners count about 10 eta Aquarid meteors per hour, while southerners see 3 to 6 times that many.

Northern sky watchers sometimes spot spectacular “Earth grazers,” while the active eta Aquarid radiant is low on the horizon. These are meteors that skim horizontally through the upper atmosphere. “Earth grazers” are typically slow and dramatic, streaking far across the sky. The best time to look for Earthgrazers is 2:00 to 2:30 a.m. local time.

Middle-latitude sky watchers in both hemispheres will see the eta Aquarid radiant rise over the eastern horizon at approximately 2:30 a.m. local time. Aquarius is a fairly dim constellation. The nearest bright star is 1st magnitude Fomalhaut in the constellation Piscis Austrini. Fomalhaut is a good finder star for sky watchers in the south, but it’s not much use to northerners because of its low altitude. In Sydney, Australia, for example, Fomalhaut will be visible at 4 a.m. at an elevation of +25 degrees, just above and westward of the shower’s radiant.

Experienced meteor watchers suggest the following viewing strategy: Dress warmly. Bring a reclining chair, or spread a thick blanket over a flat spot of ground. Lie down and look up somewhat toward the east. Meteors can appear in any part of the sky, although their trails will tend to point back toward the radiant.

Original Source: NASA Spaceweather

High Resolution Global Map in Development

Envisat will build up the most detailed map of the entire Earth. Image credit: ESA. Click to enlarge.
The most detailed portrait ever of the Earth’s land surface is being created with ESA’s Envisat environmental satellite. The GLOBCOVER project aims at producing a global land cover map to a resolution three times sharper than any previous satellite map.

It will be a unique depiction of the face of our planet in 2005, broken down into more than 20 separate land cover classes. The completed GLOBCOVER map will have numerous uses, including plotting worldwide land use trends, studying natural and managed ecosystems and modelling climate change extent and impacts.

Envisat’s Medium Resolution Imaging Spectrometer (MERIS) instrument is being systematically used in Full Resolution Mode for the project, acquiring images with a spatial resolution of 300 metres, with an average 150 minutes of acquisitions occurring daily.

The estimate is that up to 20 terabytes of imagery will be needed to mosaic together the final worldwide GLOBCOVER map ? an amount of data equivalent to the contents of 20 million books. The image acquisition strategy is based around regional climate patterns to minimise cloud or snow cover. Multiple acquisitions are planned for some regions to account for seasonal variations in land cover.

Other Envisat sensors will work in synergy with MERIS. The Advanced Synthetic Aperture Radar (ASAR) instrument will be used to differentiate between similar land cover classes, such as wetlands and humid tropical rainforests. And information from the satellite’s Advanced Along Track Scanning Radiometer will be used to correct for atmospheric distortion and to perform ‘cloud masking’, or the elimination of cloud pixels.

An international network of partners is working with ESA on the two-year GLOBCOVER project, which is taking place as part of the Earth Observation Data User Element (DUE).

Participants include the United Nations Environment Programme (UNEP), the Food and Agriculture Organisation (FAO), the European Commission’s Joint Research Centre (JRC), the International Geosphere-Biosphere Programme (IGBP) and the Global Observations of Forest Cover and Global Observations of Land Dynamics (GOFC-GOLD) Implementation Team Project Office.

“UNEP anticipates being able to put the GLOBCOVER map to good use within its programme of assessment and early warning of emerging environmental issues and threats, particularly those of a trans-boundary nature,” said Ron Witt of UNEP. “Changes in land cover patterns, effects of environmental pollution and loss of biodiversity often do not respect national or other artificial boundaries. “An updated view of such problems – or their effects – from interpreted space imagery should offer a large boost to UNEP’s effort to monitor the health of the planet and our changing environment.”

Located at Friedrich-Schiller University in Jena, Germany, the GOFC-GOLD Implementation Team Project Office is responsible for developing international standards and methodology for global observations, and is advising GLOBCOVER on classification issues.

The GLOBCOVER classification system is being designed to be compatible with the Global Land Cover map previously produced for the JRC for the year 2000, a one-kilometre resolution map produced from SPOT-4 Vegetation Instrument data and known as GLC 2000.

GLOBCOVER will also serve to update and improve the European Environment Agency’s CORINE 2000 database, a 300-metre resolution land cover map of the European continent based on a combination of updated land cover maps and satellite imagery.

Once worldwide MERIS Full Resolution coverage is achieved, there will actually be two GLOBCOVER maps produced. The first, GLOBCOVER V1, will be produced automatically by mosaicking images together in a standardised way.

The JRC is then utilising its GLC2000 experience to produce the more advanced GLOBCOVER V2 in the second year, taking a regionally-tuned approach to the data. Some 30 teams worldwide will participate in analysing and validating GLOBCOVER products.

Acquired in a standardised 15 bands, the MERIS images are going to be processed with an upgraded algorithm that includes an ortho-rectification fool, correcting for altitude based on a digital elevation model (DEM) derived from the Radar Altimeter-2 (RA-2), another Envisat instrument.

Original Source: ESA News Release

History of the Earth’s Atmosphere Written in Rocks

The Earth and its atmosphere today. Image credit: NASA. Click to enlarge.
Washington, D.C. ?CSI-like? techniques, used on minerals, are revealing the steps that led to evolution of the atmosphere on Earth. President of the Mineralogical Society of America, Douglas Rumble, III, of the Carnegie Institution?s Geophysical Laboratory, describes the suite of techniques and studies over the last five years that have led to a growing consensus by the scientific community of what happened to produce the protective ozone layer and atmosphere on our planet. His landmark paper on the subject appears in the May/June American Mineralogist.

?Rocks, fossils, and other natural relics hold clues to ancient environments in the form of different ratios of isotopes?atomic variants of elements with the same number of protons but different numbers of neutrons,? explained Rumble. ?Seawater, rain water, oxygen, and ozone, for instance, all have different ratios, or fingerprints, of the oxygen isotopes 16O, 17O, and 18O. Weathering, ground water, and direct deposition of atmospheric aerosols change the ratios of the isotopes in a rock revealing a lot about the past climate.? Rumble?s paper describes how geochemists, mineralogists, and petrologists are studying anomalies of isotopes of oxygen and sulfur to piece together what happened to our atmosphere from about 3.9 billion years ago, when the crust of our planet was just forming and there was no oxygen in the atmosphere, to a primitive oxygenated world 2.3 billion years ago, and then to the present.

The detective work involves a pantheon of scientists who have analyzed surface minerals from all over the globe, used rockets and balloons to sample the stratosphere, collected and studied ice cores from Antarctica, conducted lab experiments, and run mathematical models. The synthesis from the different fields and techniques points to ultraviolet (UV) light from the Sun as an important driving force in atmospheric evolution. Solar UV photons drive the production of ozone in the atmosphere and yield ozone that is enriched in 17O and 18O, thereby leaving a tell-tale isotopic signature. The ozone layer began to form as the atmosphere gained oxygen, and has since shielded our planet from harmful solar rays and made life possible on Earth?s surface.

The discovery of isotope anomalies, where none were previously suspected, adds a new tool to research on the relationships between shifts in atmospheric chemistry and climate change. Detailed studies of polar-ice cores and exposed deposits in Antarctic dry valleys may improve our understanding of the history of the ozone hole.

Original Source: Carnegie Institution News Release

Watching Gamma Rays from the Safety of Earth

Two of the four H.E.S.S. telescopes in Namibia. Image credit: HESS. Click to enlarge.
Our planet is exposed to almost four dozen octaves of electro-magnetic radiation from the Universe around us. Of those, half-a-dozen octaves can be detected from the Earth’s surface. During the 1990’s several extraordinary new octaves were added with the advent of high-sensitivity CCD imagers and modern computing systems. Today we can track super-high energy gamma rays back to their sources in space ? even while safely ensconced in the Earth?s protective mantle of air.

Well before the turn of the third millennium, it was realized that high-energy photons penetrating the air causes a secondary form of light known as Cherenkov Radiation (CR). CR was first observed by Pierre and Marie Curie when investigating radioactivity at the turn of the 20th century. It wasn’t until the mid-1930s that the hauntingly beautiful “blue-white” glow given off by glass in the presence of radioactivity was studied in detail.

CR was first fully investigated by the Russian experimentalist P. A. Cherenkov in 1936. Cherenkov found that whenever high-energy photons (or particles) pass through a transparent gas, liquid, or glass at velocities greater than the speed of light for that substance, a shower of secondary light is created. In terms of the Earth’s atmosphere, such showers typically occur as gamma rays approach within 10 km’s of sea level and the resulting luminosity projects a light cone (or “light pool”) roughly 250ms in diameter.

Enter the Max Plank Institute of Physics (MPIK) of Heidelberg, Germany in the early 1990s.

In 1992 MPIK tested the first in a series of prototypes intended to develop a full scale IACT (Imaging Atmospheric Cherenkov Telescopes) system. That instrument (CT1) proved that CR showers could be detected using CCDs. It also showed that computers could accurately log a CR shower’s time and position in the sky. A later instrument (CT2) increased CR sensitivity and resolution by adding aperture. Meanwhile improvements were made to associated imaging, data processing, and sky sensing components. By combining four CT2-class instruments together, the first full IACT system was developed in 1995 (CT3). Because of this progress, MPIK’s own website could later say that “Ground-based Imaging Atmospheric Cherenkov Telescopes have become the most efficient experimental technique for the observation of cosmic gamma rays in the TeV energy range.”

IACT systems monitor for CR showers using two or more widely spaced light-collecting mirror assemblies pointed at the same part of the sky. Because CR originates in the Earth’s atmosphere – not well-off in the Universe itself – each mirror sees a shower from a different perspective. The resulting “stereoscopic vision” works like eye and brain to precisely determine the path a gamma ray takes after entering the atmosphere. Based on that data – along with laws governing the way photons move – computers calculate the location of gamma ray source in space. Each ray effectively acts like a luminous finger pointing back toward a distant cosmic source.

By 1998 the first purely astronomical IACT (HEGRA – High Energy Gamma Ray Astronomy) was put into service by MPIK on La Palma in the Canary Islands. HEGRA confirmed dozens of high energy gamma ray sources – many hurling photons of more than 1 terra-electron-volts of energy (the amount of force stored in a single electron accelerated by a trillion volts of electricity). Among them were the Crab Nebula pulsar in Taurus and the giant elliptical galaxy M87 – regent of the Coma-Virgo galaxy cluster.

Today even more advanced IACT systems collect CR. One of the most sophisticated instruments (H.E.S.S – High Energy Stereoscopic System) was developed by MPIK along with a consortium of European scientific and educational organizations. Currently HESS consists of four separate 12m diameter IACTS gathering faint CR light in the dark skies above the 1.8km high Khomas Highlands of Namibia, Africa.

Named after Nobel Prize winning physicist Victor Hess (who discovered cosmic rays in 1912), HESS uses an array of four IACT mirror systems. Each spherical IACT mirror consists of 382, 60cm diameter individually-adjustable sub-mirrors reflecting CR light into a large electronic “camera”. Light focused on the camera is detected by a honeycomb of 960 “smartpixel” photo-multiplier tubes (PMTs). The four IACTs are placed in a square and spaced by 120 meters to give an optimally stereoscopic view of the sky within the 250m light pool caused by a CR event.

Each HESS IACT is ten times more sensitive than its corresponding HEGRA unit – and has to be, for the total amount of CR light in the sky is 10 stellar magnitudes fainter than starlight. HESS IACTS can resolve CR showers caused by photons as “weak” as .1 TeV while discriminating between high-energy particles and photons. Using a pair of IACTS, gamma ray sources can be isolated to less than 5 arc-minutes of angular resolution – roughly 1/6th the apparent size of the full moon. To simplify detection, HESS IACTS can scan 5 degrees of the sky at a time.

One of the fundamental questions before astrophysicists is to determine just how nature manages to pack so much punch into those mass-less, charge-less photons. Currently no terra-electron-volt particle accelerators are on line – and such devices only work with charged particles – not photons. It may fall to IACTS like HESS to lead the way.

In a paper entitled “Observation of the giant radio galaxy M87 at TeV energies using H.E.S.S”, M Beilicke of the Institute for Expermental Physics, Hamburg Germany and associates have used HESS to determine that the giant elliptical galaxy M87 is a strong and possibly periodically variable source of high-energy gamma ray photons.

According to the paper, “M87 is of particular interest for observations of TeV energies. The large jet angle makes it different from the so far observed TeV emitting AGN of the blazar type.” Using HESS, the team determined that high-energy photons originate from a point source centered in the midst of M87 – precisely where it’s AGN is thought to be. Unlike blazars however, M87’s relativistic jets do not point at the Earth.

Meanwhile the team may have also discovered that gamma ray output from M87’s AGN is variable “on time scales of years.” According to M. Bielecke et al, “Such a result would be very important since various models for the TeV gamma-ray production in M87 could be ruled out.” The team goes on to say that “Mechanisms correlated with cosmic rays, large scale jet structures, and exotic dark matter particle annihilation could not explain variability in the TeV gamma ray emission on these time-scales.”

As in many areas of contemporary astronomical investigation, observing M87 across a wide-range of the em band may be essential to understanding how those tiny mass-free wave-particles of light can carry so much ?weight?. There is no doubt that capturing the ‘blue-white” glow of Cherenkov radiation put off by our Earth’s very own atmosphere will play a critical role in making this possible.

Written by Jeff Barbour

Did Life Arrive Before the Solar System Even Formed?

Image credit: NASA
Things seem to start simple then get more complex. Life is like that. And perhaps nowhere is this notion truer than when we investigate the origins of life. Did the earliest single cell life-forms coalesce from organic molecules here on Earth? Or is it possible that – like dandelions wafting spore above spring grass – cosmic winds carry living things from world to world later to take root and flourish? And if this is the case, how precisely does such a “dia-spora” occur?

450 years before the common era, Greek philosopher Anaxagoras of Ionia proposed that all living things sprung from certain ubiquitous “seeds of life”. Today’s notion of such “seeds” is far more sophisticated than anything Anaxagoras could possibly envision – limited as he was to simple observations of living things such as budding plant & flowering tree, crawling & buzzing insect, loping animal or walking human; not too mention natural phenomena like sound, wind, rainbows, earthquakes, eclipses, Sun, and Moon. Surprisingly modern in thought, Anaxagoras could only guess as to the details…

Some 2300 hundreds years later – during the 1830s – Swedish chemist J?ns Jackob Berzelius confirmed that carbon compounds were found in certain meteorites “fallen from the heavens”. Berzelius himself however, held that these carbonates were contaminates originating with the Earth itself – but his finding contributed to theories propounded by later thinkers including the physician H.E. Richter and physicist Lord Kelvin.

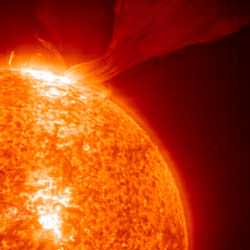
Panspermia received its first real treatment by Hermann von Helmholtz in 1879, but it was another Swedish chemist – 1903 Nobel Prize winning Svante Arrhenius – who popularized the concept of life originating from space in 1908. Perhaps surprisingly, that theory was based on the notion that radiation pressure from the Sun – and other stars – “blew” microbes about like tiny solar sails – and not as the result of finding carbon compounds in stony meteorite.

The theory that simple forms of life travel in ejecta from other worlds ? embedded in rock blasted from planetary surfaces by the impact of large objects – is the basis for “lithopanspermia”. There are numerous advantages to this hypothesis – simple, hardy forms of life are often found in mineral deposits on Earth in forbidding locales. Worlds – such as our own or Mars – are occasionally blasted by asteroids and comets large enough to hurl rock at speeds exceeding escape velocities. Mineral in rocks can shield microbes from shock and radiation (associated with impact craters) as well as hard radiation from the Sun as stony meteors move through space. The hardiest forms of life also have the ability to survive in a cold vacuum by going into stasis – reducing chemical interactions to zero while maintaining biological structure well enough to later thaw and multiply in more salubrious environs.

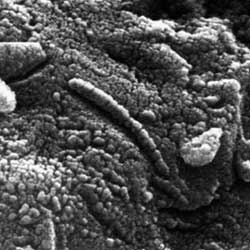
In fact several examples of such ejecta are now available on earth for scientific analysis. Stony meteors can include some very sophisticated forms of organic materials (carbonaceous chondrites have been found that include amino and carboxylic acids). Fossilized remnants from Mars in particular – though subject to various non-organic interpretations – are in the possession of institutions such as NASA. The theory and practice of “lithopanspermia” looks very promising – although such a theory can only explain where the simplest forms of life come from – and not how it originated to begin with.

In a paper entitled “Lithopanspermia in Star Forming Clusters” published April 29, 2005, cosmologists Fred C. Adams of the University of Michigan Center for Theoretical Physics and David Spergel of the Department of Astrophysical Sciences of Princeton University discuss the probability of carbonaceous chondrite distribution of microbial life within early star clusters. According to the duo, “the chances of biological material spreading from one system to another is greatly enhanced … due to the close proximity of the systems and low relative velocities.”

According to the authors, previous studies have looked into the likelihood that life-bearing rocks (typically exceeding 10 kgs in weight) play a role in the spread of life within isolated planetary systems and found “the odds of both meteroid and biological transfer are exceedingly low.” However “odds of transfer increase in more crowded environments” and “Since the time scale for planet formation and the time that young stars are expected to live in birth clusters are roughly comparable, about 10 – 30 million years, debris from planet formation has a good chance of being transferred from one solar system to another.”

Ultimately Fred and David conclude “young star clusters provide an efficient means of transferring rocky material from solar system to solar system. If any system in the birth aggregate supports life, then many other systems in the cluster can capture life bearing rocks.”

To arrive at this conclusion, the duo performed “a series of numerical calculations to estimate the distribution of ejection speeds for rocks” based on size and mass. They also considered the dynamics of early star forming groups and clusters. This was essential to help determine rock recapture rates by planets in neighboring systems. Finally they had to make certain assumptions about the frequency of life-encapsulated materials and the survivability of life-forms embedded within them. All this led up to a sense of “the expected number of successful lithopanspermia events per cluster.”

Based on methods used to arrive at this conclusion and thinking only in terms of present distances between solar systems, the duo estimated the probability that Earth has exported life to other systems. Over the age of life on Earth (some 4.0 Byr) Fred and David estimate that the Earth has ejected some 40 billion life-bearing stones. Of the estimated 10 bio-stones per annum, nearly 1 (0.9) will land on a planet suitable for further growth and proliferation.

Most cosmologists tend to address the “hard-science questions” of the origin of the Universe as a whole. Fred says that “exobiology is intrinsically interesting” to him and that he and “David were summer students together in New York in 1981” where they worked on “issues related to planetary atmospheres and climate, issues that are close to questions of exobiology.” Fred also says that he “spends a healthy fraction of research time on problems associated with star and planet formation.” Fred acknowledges David’s special role in thinking “up the idea of looking at panspermia in clusters; when we talked about it, it became clear that we had all the pieces of the puzzle. We just had to put them together.”

This interdisciplinary approach to cosmology and exobiology also led Fred and David to look at the question of lithopanspermia between clusters themselves. Again using methods developed to explore the proliferation of life within clusters, and later applied to the exportation of life from the Earth itself to other non-solar system planets, Fred and David were able to conclude that “a young cluster is more likely to capture life from outside than to give rise to life spontaneously.” And “Once seeded, the cluster provides an effective amplification mechanism to infect other members” within that cluster itself.

Ultimately however, Fred and David can not answer the question of where and under what conditions the first seeds of life took form. In fact, they are willing to admit that “if the spontaneous origin of life were sufficiently common, there would be no need for any panspermia mechanism to explain the presence of life.”

But according to Fred and David, once life gets a foothold somewhere, it manages to get around quite handily.

Written by Jeff Barbour

The Earth Through Rosetta’s Eyes

Rosetta’s view of Earth, taken during its March 2005 flyby. Image credit: ESA. Click to enlarge.
ESA?s comet chaser mission Rosetta took infrared and visible images of Earth and the Moon, during the Earth fly-by of 4/5 March 2005 while on its way to Comet 67P/Churyumov-Gerasimenko.

These images, now processed, are part of the first scientific data obtained by Rosetta. ?The Earth fly-by represented the first real chance to calibrate and validate the performance of the Rosetta?s instruments on a real space object, to make sure everything works fine at the final target,? said Angioletta Coradini, Principal Investigator for the Visible and Infrared Thermal Imaging Spectrometer (VIRTIS) instrument.

?Although we were just calibrating VIRTIS during the Earth fly-by last month, we obtained images of Earth and the Moon which have a high scientific content,? she added.

On 4 and 5 March, before closest approach to Earth and from a distance of 400 000 kilometres from our Moon, Rosetta?s VIRTIS took these images with high resolution in visible and infrared light. In these images, only a small portion of the Moon surface was illuminated (between 19% and 32%).

The spectral analysis (chemical ?finger-printing?) gives indications of the mineralogical differences between highlands and ?seas? or ?maria?. For instance, it was possible to see marked differences in the abundance of two kinds of rocks known as pyroxene and olivine.

On 5 March, after the closest approach to Earth, VIRTIS then took a series of high-resolution images of our planet in visible and infrared light from a distance of 250 000 kilometres. Only 49% of the Earth surface was visible from Rosetta.

Once at Comet 67P/Churyumov-Gerasimenko in 2014, VIRTIS will be used to determine the composition and the nature of the solid nucleus and the gases present in the comet?s coma.

In combination with the other Rosetta instruments, it will also help the selection of the ?touchdown? site for the Rosetta lander Philae.

Before then, Rosetta will make more cosmic loops to reach the comet, and its instruments will collect new data about planets, asteroids and comets. The next encounter with Earth is planned for November 2007.

VIRTIS as been developed by a large consortium of European scientists, with major contribution by Italy, France and Germany.

Original Source: ESA News Release