Venus Transit on June 8

Image credit: NASA/JPL
On Tuesday 8 June, observers throughout Europe, as well as most of Asia and Africa, will be able to witness a very rare astronomical phenomenon when the planet Venus lines up directly between Earth and the Sun. Seen as a small black disk against the bright Sun, Venus will take about 6 hours to complete its crossing of the Sun’s face – known as a ‘transit’. The whole event is visible from the UK, weather permitting.

The last transit of Venus took place on 6 December 1882, but the last one that could have been seen in its entirety from the UK, as on this occasion, was in 1283 (when no one knew it was happening) and the next will not be until 2247! (The transit of 6 June 2012 will not be visible from the UK). The first transit of Venus to be observed was on 24 November 1639 (Julian Calendar). Transits also occurred in 1761, 1769 and 1874.

Venus and Mercury both orbit the Sun closer than Earth. Both planets regularly line up roughly between Earth and the Sun (called ‘conjunction’) but on most occasions they pass above or below the disc of the Sun from our point of view. Since 1631, transits of Venus have been occurring at intervals of 8, 121.5, 8 then 105.5 years and this pattern will continue until the year 2984. Transits of Mercury are more common; there are 13 or 14 each century, the next being in November 2006.

WHEN AND WHERE
The Venus transit of 8 June begins shortly after sunrise at about 6.20 BST, when the Sun will be about 12 degrees above the eastern horizon. It will take about 20 minutes from ‘first contact’ until the planet is fully silhouetted against the Sun, roughly at the ‘8 o’clock’ position’. It will then cut a diagonal path across the southern part of the Sun. Mid-transit is at about 9.22 BST. Venus begins to leave the Sun near the ‘5 o’clock’ position at about 12.04 BST and the transit will be completely over around 12.24. Timings differ by a few seconds for different latitudes, but clouds permitting, the transit will be visible from any place where the Sun is up, including the whole of the UK and almost all of Europe.

For a diagram of Venus’s track across the Sun, see:

http://sunearth.gsfc.nasa.gov/eclipse/OH/tran/Transit2004-2a.GIF (hi-res)
http://sunearth.gsfc.nasa.gov/eclipse/OH/tran/Transit2004-2b.GIF (low-res)
http://www.transit-of-venus.org.uk/transit.htm

For map showing where transit is visible, see:

http://sunearth.gsfc.nasa.gov/eclipse/OH/tran/Transit2004-1b.GIF

HOW TO VIEW
Venus is large enough to be just visible to someone with normal eyesight without the help of binoculars or a telescope. Its diameter will appear about 1/32 the diameter of the Sun. However, NO ONE SHOULD EVER LOOK DIRECTLY AT THE SUN, WITH OR WITHOUT A TELESCOPE OR BINOCULARS WITHOUT USING A SAFE SOLAR FILTER. TO DO SO IS VERY DANGEROUS AND IS LIKELY TO RESULT IN PERMANENT BLINDNESS.

For safe viewing of the transit, much the same rules apply as those for observing an eclipse of the Sun. Eclipse viewers can be used (as long as they are undamaged), and observing is limited to a few minutes at a time. (Note that they must NOT be used with binoculars or a telescope.) For an enlarged view, an image of the Sun can be projected onto a screen by a small telescope. Pinhole projection, however, will not produce a sharp enough image to show Venus clearly.

More detailed information on safety from:

http://sunearth.gsfc.nasa.gov/eclipse/SEhelp/safety2.html
http://www.transit-of-venus.org.uk/safety.htm

IMPORTANCE OF THE TRANSIT
In the 18th and 19th centuries, transits of Venus presented rare opportunities to tackle a fundamental problem – finding an accurate value for the distance between Earth and the Sun. The unit astronomers use for distance measurements in the solar system is based closely on its average value and is called the astronomical unit (AU). It is approximately 93 million miles, or 150 million km.

In the end, though observations of transits produced rough answers, they were never as accurate as originally hoped (see more on this below). But the quest was the stimulus for unprecedented international scientific cooperation and for expeditions that produced discoveries far beyond their original intended scope. Today, distances in the solar system are known with great precision through very different means.

In the 21st century, the main interest in the transits of Venus of 2004 and 2012 is their rarity as astronomical phenomena, the educational opportunities they present, and the sense of a link with important events in scientific and world history.

However, astronomers are now particularly interested in the general principle of planet transits as a way of hunting for extrasolar planetary systems. When a planet crosses in front of its parent star, there is a minute dip in the star’s apparent brightness. Identifying such dips will be a useful method of finding planets orbiting other stars. Some astronomers intend to use the transit of Venus as a test to help design searches for extrasolar planets.

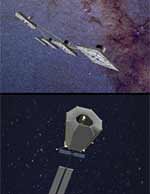
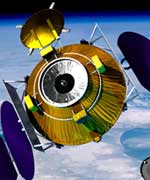
The transit will be observed by two solar observatories in space: TRACE and SOHO. From where SOHO is positioned, it will not see a transit across the visible disc of the Sun, but it will observe Venus’s passage across the Sun’s corona (its outer atmosphere).

VENUS TRANSITS OF THE PAST
The first person to predict a transit of Venus was Johannes Kepler, who calculated that one would take place on 6 December 1631, just a month after a transit of Mercury on 7 November. Though the transit of Mercury was observed, the transit of Venus was not visible from Europe and there is no record of anyone seeing it. Kepler himself died in 1630.

Jeremiah Horrocks (also spelled Horrox), a young English astronomer, studied Kepler’s planetary tables and discovered with just a month to go that a transit of Venus would occur on 24 November 1639. Horrocks observed part of the transit from his home at Much Hoole, near Preston, Lancashire. His friend William Crabtree also saw it from Manchester, having been alerted by Horrocks. As far as is known, they were the only people to witness the transit. Tragically, Horrocks’s promising scientific career was cut short when he died in 1641, aged about 22.

Edmond Halley (of comet fame) realised that observations of transits of Venus could in principle be used to find how far the Sun is from Earth. This was a major problem in astronomy at the time. The method involved observing and timing a transit from widely spaced latitudes from where Venus’s track across the Sun would appear slightly different. Halley died in 1742, but the transits of 1761 and 1769 were observed from many places around the world. Captain James Cook’s expedition to Tahiti in 1769 is one of the most famous and went on to become a world voyage of discovery. However, results on the Sun-Earth distance were disappointing. The observations were plagued by many technical difficulties.

Nevertheless, 105 years later, optimistic astronomers tried again. The results were equally disappointing and people began to realise that the practical problems with Halley’s simple idea were just too great to overcome. Even so, by the 1882 tr ansit, there was enormous public interest and it was mentioned on the front page of most newspapers. Thousands of ordinary people saw it for themselves.

In his 1885 book, “The Story of Astronomy” Professor Sir Robert Stawell Ball described his own feelings on watching the transit 3 years earlier:

“… To have seen even a part of a transit of Venus is an event to remember for a lifetime, and we felt more delight than can be easily expressed… Before the phenomenon had ceased, I spared a few minutes from the somewhat mechanical work at the micrometer to take a view of the transit in the more picturesque form which the large field of the finder presents. The sun was already beginning to put on the ruddy hues of sunset, and there, far in on its face, was the sharp, round, black disk of Venus. It was then easy to sympathize with the supreme joy of Horrocks, when, in 1639, he for the first time witnessed this spectacle. The intrinsic interest of the phenomenon, its rarity, the fulfilment of the prediction, the noble problem which the transit of Venus helps us to solve, are all present to our thoughts when we look at this pleasing picture, a repetition of which will not occur again until the flowers are blooming in the June of A.D. 2004.”

For an excellent historical summary, see:

Venus Transit

THE FAMOUS ‘BLACK DROP’ PROBLEM
One of the chief problems visual observers of transits faced was pinpointing the exact time when Venus was first fully on the visible face of the Sun. Astronomers call this point ‘second contact’. In practice, as Venus crossed onto the Sun, its black disc seemed to remain linked to the edge of the Sun for a short time by a dark neck, making it appear almost pear-shaped. The same happened in reverse when Venus began to leave the Sun. This so-called ‘black drop effect’ was the main reasons why timing the transits failed to produce consistent accurate results for the Sun-Earth distance. Halley expected second contact could be timed to within about a second. The black drop reduced the accuracy of timing to more like a minute.

The black drop effect is often mistakenly attributed to Venus’s atmosphere but Glenn Schneider, Jay Pasachoff and Leon Golub showed last year that the problem is due to a combination of two effects. One is the image blurring that naturally takes place when a telescope is used (described technically as ‘the point spread function’). The other is the way the brightness of the Sun diminishes close to its visible ‘edge’ (known to astronomers as ‘limb darkening’).

More experiments will be done on this phenomenon at the 8 June transit of Venus using the TRACE solar observatory in space.

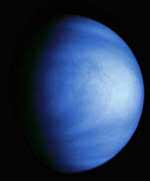
VENUS – THE PLANETARY EQUIVALENT TO HELL.
At first glance, if Earth had a twin, it would be Venus. The two planets are similar in size, mass and composition, and both reside in the inner part of the Solar System. Indeed, Venus comes closer to Earth than any of the other planets.

Before the advent of the Space Age, astronomers could only speculate over the nature of its hidden surface. Some thought that Venus might be a tropical paradise, covered in forests or oceans. Others believed that it was a totally barren, arid desert. After investigations by numerous American and Russian spacecraft, we now know that Earth’s planetary neighbour is the most hellish, hostile world imaginable. Any astronaut unlucky enough to land there would be simultaneously crushed, roasted, choked and dissolved.

Unlike Earth, Venus has no ocean, no satellites and no intrinsic magnetic field. It is covered by thick, yellowish clouds – made of sulphur and droplets of sulphuric acid – that act like a blanket to trap surface heat. The upper cloud layers move faster than hurricane-force winds on Earth, sweeping all the way around the planet in just four days. These clouds also reflect most of the incoming sunlight, helping Venus to outshine everything in the night sky (apart from the Moon). At the present time, Venus dominates the western sky after sunset.

Atmospheric pressure is 90 times that of Earth, so an astronaut standing on Venus would be crushed by pressure equivalent to that at a depth of 900 m (more than half a mile) in the Earth’s oceans. The dense atmosphere consists mainly of carbon dioxide (the greenhouse gas that we breathe out every time we exhale) and virtually no water vapour. Since the atmosphere allows the Sun’s heat in but does not allow it to escape, surface temperatures soar to more than 450 deg. C – hot enough to melt lead. Indeed, Venus is hotter than Mercury, the planet closest to the Sun.

Venus rotates sluggishly on its axis once every 243 Earth days, while it orbits the Sun every 225 days – so its day is longer than its year! Just as peculiar is its retrograde, or “backwards” rotation, which means that a Venusian would see the Sun rise in the west and set in the east.

Earth and Venus are similar in density and chemical composition, and both have relatively young surfaces, with Venus appearing to have been completely resurfaced 300 to 500 million years ago.

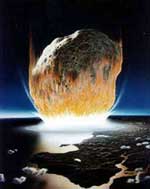
The surface of Venus comprises about 20 per cent lowland plains, 70 per cent rolling uplands, and 10 per cent highlands. Volcanic activity, impacts, and deformation of the crust have shaped the surface. More than 1,000 volcanoes larger than 20 km (12.5 mls) in diameter dot the surface of Venus. Although much of the surface is covered by vast lava flows, no direct evidence of active volcanoes has been found. Impact craters smaller than 2 km (1 ml) across do not exist on Venus because most meteorites burn up in the dense atmosphere before they can reach the surface.

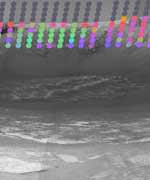
Venus is drier than the driest desert on Earth. Despite the absence of rainfall, rivers or strong winds, some weathering and erosion does occur. The surface is brushed by gentle winds, no stronger than a few kilometres per hour, enough to move grains of sand, and radar images of the surface show wind streaks and sand dunes. In addition, the corrosive atmosphere probably chemically alters rocks.

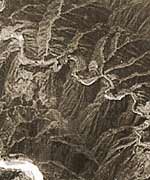
Radar images sent back by orbiting spacecraft and ground-based telescopes have revealed several elevated “continents”. In the north is a region named Ishtar Terra, a high plateau larger than the continental United States and bounded by mountains almost twice as high as Everest. Near the equator, the Aphrodite Terra highlands, more than half the size of Africa, extend for almost 10,000 km (6,250 miles). Volcanic lava flows have also produced long, sinuous channels extending for hundreds of kilometres.

Original Source: RAS News Release

Rover Analyzing Ejected Rock

Image credit: NASA/JPL
NASA’s Mars Exploration Rover Opportunity has begun sampling rocks blasted out from a stadium-sized impact crater the rover is circling, and the very first one may extend our understanding about the region’s wet past.

Opportunity is spending a few weeks examining the crater, informally named “Endurance,” from the rim, providing information NASA will use for a decision about whether to send the rover down inside. That decision will take into account both the scientific allure of rock layers in the crater and the operational safety of the rover. Opportunity has completed observations from the first of three planned viewpoints located about one-third of the way around the rim from each other. Mission controllers at NASA’s Jet Propulsion Laboratory, Pasadena, Calif., are sending the rover around the crater’s rim counterclockwise.

“As we were proceeding from our first viewpoint toward our second viewpoint, we saw a rock that looked like nothing we’d ever seen before,” said Dr. Steve Squyres of Cornell University, Ithaca, N.Y., principal investigator for the science instruments on both Mars Exploration Rovers. The rock appears to have come from below the area’s current surface level, tossed up by the impact that excavated Endurance Crater.

This rock, dubbed “Lion Stone,” is about 10 centimeters tall and 30 centimeters long (4 inches by 12 inches). In some ways it resembles rocks that provided evidence of past water at the smaller crater, “Eagle Crater,” in which Opportunity landed. Like them, it has a sulfur-rich composition, fine layering and spherical concretions, and likely formed under wet conditions.

“However,” Squyres said, “it is different in subtle ways from what we saw at Eagle Crater: a little different in mineralogy, a little different in color. It may give us the first hint of what the environment was like before the conditions that produced the Eagle Crater rocks.”

Inside Endurance Crater are multiple layers of exposed rocks that might provide information about a much longer period of environmental history. From the viewpoints around the rim, Opportunity’s miniature thermal emission spectrometer is returning data for mapping the mineral composition of the rocks exposed in the crater’s interior.

“We see the coarse hematite grains on the upper slopes and basaltic sand at the bottom,” said Dr. Phil Christensen of Arizona State University, Tempe, lead scientist for that spectrometer. “Most exciting is the basalt signature in the layered cliffs.” Basalt is volcanic in origin, but the thinness of the layers visible in the cliffs suggests they were emplaced some way other than as flows of lava, he said.

“Our working hypothesis is that volcanically erupted rock was broken down into particles that were then transported and redeposited by wind or by liquid water,” Christensen said.

At a press conference today in Montreal, Canada, Christensen and Squyres presented previews of rover-science reports scheduled this week at a joint meeting of the American Geophysical Union and the Canadian Geophysical Union.

Although the stack of rock layers at Endurance is more than 10 times thicker than the bedrock exposure at Eagle Crater, it is still only a small fraction of the 200-meter-thick (650- foot-thick) stack seen from orbit at some other locations in Mars’ Meridian Planum region. A close-up look at the Endurance Crater rocks could help with interpreting the other exposures seen from orbit. “It’s possible that the whole stack was deposited in water — some particles washed in by flowing water and others chemically precipitated out of the water,” Christensen said. “An alternative is that wind blew sand in.”

Halfway around Mars from Opportunity, Spirit is driving toward highlands informally named “Columbia Hills,” where scientists hope to find older rocks than the ones on the plain the rover has been crossing. The rover could reach the edge of the hills by mid-June. “Spirit is making breathtaking progress,” Squyres said. “The other day it covered 124 meters [407 feet] in one day. And that’s not a parking lot we’re crossing. It’s hilly, rock-strewn terrain. This kind of pace bodes well for having lots of rover capability left when we get to the hills.”

JPL, a division of the California Institute of Technology in Pasadena, manages the Mars Exploration Rover project for NASA’s Office of Space Science, Washington, D.C. Images and additional information about the project are available from JPL at http://marsrovers.jpl.nasa.gov and from Cornell University at http://athena.cornell.edu.

Original Source: NASA/JPL News Release

Asteroid That Nearly Ended Life on Earth

Image credit: NASA
An impact crater believed to be associated with the “Great Dying,” the largest extinction event in the history of life on Earth, appears to be buried off the coast of Australia. NASA and the National Science Foundation (NSF) funded the major research project headed by Luann Becker, a scientist at the University of California, Santa Barbara (UCSB). Science Express, the electronic publication of the journal Science, published a paper describing the crater today.

Most scientists agree a meteor impact, called Chicxulub, in Mexico’s Yucatan Peninsula, accompanied the extinction of the dinosaurs 65 million years ago. But until now, the time of the Great Dying 250 million years ago, when 90 percent of marine and 80 percent of land life perished, lacked evidence and a location for a similar impact event. Becker and her team found extensive evidence of a 125-mile-wide crater, called Bedout, off the northwestern coast of Australia. They found clues matched up with the Great Dying, the period known as the end-Permian. This was the time period when the Earth was configured as one primary land mass called Pangea and a super ocean called Panthalassa.

During recent research in Antarctica, Becker and her team found meteoric fragments in a thin claystone “breccia” layer, pointing to an end-Permian event. The breccia contains the impact debris that resettled in a layer of sediment at end-Permian time. They also found “shocked quartz” in this area and in Australia. “Few Earthly circumstances have the power to disfigure quartz, even high temperatures and pressures deep inside the Earth’s crust,” explains Dr. Becker.

Quartz can be fractured by extreme volcanic activity, but only in one direction. Shocked quartz is fractured in several directions and is therefore believed to be a good tracer for the impact of a meteor. Becker discovered oil companies in the early 70’s and 80’s had drilled two cores into the Bedout structure in search of hydrocarbons. The cores sat untouched for decades. Becker and co-author Robert Poreda went to Australia to examine the cores held by the Geological Survey for Australia in Canberra. “The moment we saw the cores, we thought it looked like an impact breccia,” Becker said. Becker’s team found evidence of a melt layer formed by an impact in the cores.

In the paper, Becker documented how the Chicxulub cores were very similar to the Bedout cores. When the Australian cores were drilled, scientists did not know exactly what to look for in terms of evidence of impact craters. Co-author Mark Harrison, from the Australian National University in Canberra, determined a date on material obtained from one of the cores, which indicated an age close to the end-Permian era. While in Australia on a field trip and workshop about Bedout, funded by the NSF, co-author Kevin Pope found large shocked quartz grains in end-Permian sediments, which he thinks formed as a result of the Bedout impact. Seismic and gravity data on Bedout are also consistent with an impact crater.

The Bedout impact crater is also associated in time with extreme volcanism and the break-up of Pangea. “We think that mass extinctions may be defined by catastrophes like impact and volcanism occurring synchronously in time,” Dr. Becker explains. “This is what happened 65 million years ago at Chicxulub but was largely dismissed by scientists as merely a coincidence. With the discovery of Bedout, I don’t think we can call such catastrophes occurring together a coincidence anymore,” Dr. Becker adds.

Two Planet Finding Missions

Image credit: NASA/JPL
Included in the nation’s new vision for space is a plan for NASA to “conduct advanced telescope searches for Earth-like planets and habitable environments around other stars.” To meet this challenge, NASA has chosen to fly two separate missions with distinct and complementary architectures to achieve the goal of the Terrestrial Planet Finder. The purpose will be to take family portraits of stars and their orbiting planets, and to study those planets to see which, if any, might be habitable, or might even have life. Both missions would launch within the next 10 to 15 years.

The two missions are:

* Terrestrial Planet Finder-C: a moderate-sized visible-light telescope, similar to the 4- by 6-meter (13.1- by 19.6-foot) version currently under study, to launch around 2014. Onboard coronagraph instrumentation will use a central disc and other specialized techniques to block the glare of a star, allowing detection and characterization of dimmer planets around it.

* Terrestrial Planet Finder-I: multiple spacecraft carrying 3 to 4 meter (9 to 13 foot) infrared telescopes flying in precise formation, to launch before 2020, and to be conducted jointly with the European Space Agency. Combining the infrared, or heat radiation gathered by the multiple telescopes, using a technique called interferometry, will simulate a much larger telescope. This will enable the mission to detect and study individual planets orbiting a parent star observed by TPF-C and also new ones beyond the reach of TPF-C.

Observing extra-solar planets in both visible and infrared light allows scientists to obtain a rich set of data to understand what chemical processes may be going on at various levels in a planet’s atmosphere and surface. That leads to understanding of whether a planet ever could or actually does harbor life. A review of these two plans will be conducted over the summer by NASA and the National Academy of Sciences Committee on Astronomy and Astrophysics. Two other architectures that were studied, the large visible coronagraph and the structurally connected infrared interferometer, will be documented and further studies concluded this summer.

Terrestrial Planet Finder is managed by NASA’s Jet Propulsion Laboratory, Pasadena, Calif., for NASA’s Office of Space Science, Washington, D.C. It is part of NASA’s Origins program, a series of missions and studies designed to answer the questions: Where did we come from? Are we alone?

Original Source: NASA/JPL News Release

SpaceShipOne Soars to 65 km on Test Flight

The privately built SpaceShipOne completed another powered flight test on Thursday, this time achieving an altitude of 65 km. Built by Scaled Composites, and backed by Microsoft co-founder Paul Allen, SpaceShipOne is considered to be the top contender to win the $10 million Ansari X Prize which will be awarded to the first private reusable rocket capable of reaching an altitude of 100 km. Allen hinted that the space plane will begin attempts to win the prize next month.

Space Tug Set to Launch in 2007

Image credit: Orbital Recovery
Orbital Recovery Ltd. today signed a long-term, exclusive launch services contract for the ConeXpress Orbital Life Extension Vehicle (CX OLEV?) – a unique spacecraft that will be deployed by Ariane 5 to serve as an orbital space tug.

This agreement – inked with Arianespace at the Berlin Air Show – covers the initial flight of a CX OLEV? in 2007, followed by four additional launches beginning in 2008. Orbital Recovery Ltd. will order further flights in sets of three missions.

The ConeXpress Orbital Life Extension Vehicle will be carried as a secondary payload on Ariane 5. Its liftoff mass will be approximately 1,200-1,400 kg. Developed by European industry, CX OLEV is designed to extend the useful lifetime of multi-million dollar telecommunications satellites by 10 years or more, and also is capable of rescuing satellites stranded in incorrect orbits.

“Ariane is known for setting the standards in commercial launch services, and we look forward to using Ariane 5 for our CX OLEV – which will set the standards for the in-orbit servicing of telecommunications satellites,” said Phil Braden, Chief Executive Officer of Orbital Recovery Ltd.

Operating as an orbital “tugboat,” the CX OLEV will supply propulsion, navigation and guidance to maintain a telecom satellite in its proper orbital slot for many years. Currently, telecommunications spacecraft are placed in a graveyard orbit as they deplete their on-board propellant loads near the end of the typical 10-15-year operation lifetimes – even though the satellites’ revenue-generating communications relay payloads continue to function.

Orbital Recovery Limited has identified more than 40 telecommunications satellites in orbit today that are candidates for life extension using the CX OLEV. In addition, the CX OLEV can be deployed to rescue spacecraft that have been placed in a wrong orbit, or which have become stranded in an incorrect orbital location during positioning maneuvers.

“We are pleased to provide launch services for this very innovative spacecraft, which continues Arianespace’s policy of working with promising new payloads and their operators,” said Arianespace Chief Executive Officer Jean-Yves Le Gall. “The mission flexibility of Ariane 5, combined with our experience in handling multi-satellite payloads, will enable the CX OLEV to be launched when needed to serve Orbital Recovery Ltd.’s mission requirements.”

In an original approach to spacecraft design, the CX OLEV is manufactured from the payload adapter that is used on every Ariane 5 mission. This allows flight-proven hardware to serve as the CX OELV structure, and opens regular launch opportunities for the space tug on Ariane 5.

Shaped like a truncated cone, the CX OLEV will continue to serve as a payload adapter for Ariane 5 missions, with the launcher’s primary satellite payload mounted atop it. Once the primary payload has been released, the CX OLEV will be deployed from the launcher to begin its own mission as an independent space tug.

The industry team developing CX OLEV is led by the Netherlands’ Dutch Space, and includes Germany’s DLR German Aerospace Center and Kayser-Threde. Aon Space is providing insurance brokering and risk management services.

Orbital Recovery Ltd. recently initiated the B1 Phase of its program, which is funded by the company and the European Space Agency under its ARTES 4 Public-Private Partnership initiative.

Original Source: Orbital Recovery News Release

High Mass Stars Form From Discs Too

Image credit: ESO
Based on a large observational effort with different telescopes and instruments, mostly from the European Southern Observatory (ESO), a team of European astronomers [1] has shown that in the M 17 nebula a high mass star [2] forms via accretion through a circumstellar disc, i.e. through the same channel as low-mass stars.

To reach this conclusion, the astronomers used very sensitive infrared instruments to penetrate the south-western molecular cloud of M 17 so that faint emission from gas heated up by a cluster of massive stars, partly located behind the molecular cloud, could be detected through the dust.

Against the background of this hot region a large opaque silhouette, which resembles a flared disc seen nearly edge-on, is found to be associated with an hour-glass shaped reflection nebula. This system complies perfectly with a newly forming high-mass star surrounded by a huge accretion disc and accompanied by an energetic bipolar mass outflow.

The new observations corroborate recent theoretical calculations which claim that stars up to 40 times more massive than the Sun can be formed by the same processes that are active during the formation of stars of smaller masses.

The M 17 region
While many details related to the formation and early evolution of low-mass stars like the Sun are now well understood, the basic scenario that leads to the formation of high-mass stars [2] still remains a mystery. Two possible scenarios for the formation of massive stars are currently being studied. In the first, such stars form by accretion of large amounts of circumstellar material; the infall onto the nascent star varies with time. Another possibility is formation by collision (coalescence) of protostars of intermediate masses, increasing the stellar mass in “jumps”.

In their continuing quest to add more pieces to the puzzle and help providing an answer to this fundamental question, a team of European astronomers [1] used a battery of telescopes, mostly at two of the European Southern Observatory’s Chilean sites of La Silla and Paranal, to study in unsurpassed detail the Omega nebula.

The Omega nebula, also known as the 17th object in the list of famous French astronomer Charles Messier, i.e. Messier 17 or M 17, is one of the most prominent star forming regions in our Galaxy. It is located at a distance of 7,000 light-years.

M 17 is extremely young – in astronomical terms – as witnessed by the presence of a cluster of high-mass stars that ionise the surrounding hydrogen gas and create a so-called H II region. The total luminosity of these stars exceeds that of our Sun by almost a factor of ten million.

Adjacent to the south-western edge of the H II region, there is a huge cloud of molecular gas which is believed to be a site of ongoing star formation. In order to search for newly forming high-mass stars, Rolf Chini of the Ruhr-Universit?t Bochum (Germany) and his collaborators have recently investigated the interface between the H II region and the molecular cloud by means of very deep optical and infrared imaging between 0.4 and 2.2 ?m.

This was done with ISAAC (at 1.25, 1.65 and 2.2 ?m) at the ESO Very Large Telescope (VLT) on Cerro Paranal in September 2002 and with EMMI (at 0.45, 0.55, 0.8 ?m) at the ESO New Technology Telescope (NTT), La Silla, in July 2003. The image quality was limited by atmospheric turbulence and varied between 0.4 and 0.8 arcsec. The result of these efforts is shown in PR Photo 15a/04.

Rolf Chini is pleased: “Our measurements are so sensitive that the south-western molecular cloud of M 17 is penetrated and the faint nebular emission of the H II region, which is partly located behind the molecular cloud, could be detected through the dust.”

Against the nebular background of the H II region a large opaque silhouette is seen associated with an hourglass shaped reflection nebula.

The silhouette disc
To obtain a better view of the structure, the team of astronomers turned then to Adaptive Optics imaging using the NAOS-CONICA instrument on the VLT.

Adaptive optics is a “wonder-weapon” in ground-based astronomy, allowing astronomers to “neutralize” the image-smearing turbulence of the terrestrial atmosphere (seen by the unaided eye as the twinkling of stars) so that much sharper images can be obtained. With NAOS-CONICA on the VLT, the astronomers were able to obtain images with a resolution better than one tenth of the “seeing”, that is, as what they could observe with ISAAC.

PR Photo 15b/04 shows the high-resolution near-infrared (2.2 ?m) image they obtained. It clearly suggests that the morphology of the silhouette resembles a flared disc, seen nearly edge-on.

The disc has a diameter of about 20,000 AU [3] – which is 500 times the distance of the farthest planet in our solar system – and is by far the largest circumstellar disc ever detected.

To study the disc structure and properties, the astronomers then turned to radio astronomy and carried out molecular line spectroscopy at the IRAM Plateau de Bure interferometer near Grenoble (France) in April 2003. The astronomers have observed the region in the rotational transitions of the 12CO, 13CO and C18O molecules, and in the adjacent continuum at 3 mm. Velocity resolutions of 0.1 and 0.2 km/s, respectively, were achieved.
Dieter N?rnberger, member of the team, sees this as a confirmation: “Our 13CO data obtained with IRAM indicate that the disc/envelope system slowly rotates with its north-western part approaching the observer.” Over an extent of 30,800 AU a velocity shift of 1.7 km/s is indeed measured.

From these observations, adopting standard values for the abundance ratio between the different isotopic carbon monoxide molecules (12CO and 13CO) and for the conversion factor to derive molecular hydrogen densities from the mesured CO intensities, the astronomers were also able to derive a conservative lower limit for the disc mass of 110 solar masses.

This is by far the most massive and largest accretion disc ever observed directly around a young massive star. The largest silhouette disc so far is known as 114-426 in Orion and has a diameter of about 1,000 AU; however, its central star is likely a low-mass object rather than a massive protostar. Although there are a small number of candidates for massive young stellar objects (YSOs) some of which are associated with outflows, the largest circumstellar disc hitherto detected around these objects has a diameter of only 130 AU.

The bipolar nebula
The second morphological structure that is visible on all images throughout the entire spectral range from visible to infrared (0.4 to 2.2 ?m) is an hourglass-shaped nebula perpendicular to the plane of the disc.

This is believed to be an energetic outflow coming from the central massive object. To confirm this, the astronomers went back to ESO’s telescopes to perform spectroscopic observations. The optical spectra of the bipolar outflow were measured in April/June 2003 with EFOSC2 at the ESO 3.6 m telescope and with EMMI at the ESO 3.5 m NTT, both located on La Silla, Chile.
The observed spectrum is dominated by the emission lines of hydrogen (H?), calcium (the Ca II triplet 849.8, 854.2 and 866.2 nm), and helium (He I 667.8 nm). In the case of low-mass stars, these lines provide indirect evidence for ongoing accretion from the inner disc onto the star.

The Ca II triplet was also shown to be a product of disc accretion for both a large sample of low and intermediate-mass protostars, known as T Tauri and Herbig Ae/Be stars, respectively. Moreover, the H? line is extremely broad and shows a deep blue-shifted absorption typically associated with accretion disc-driven outflows.

In the spectrum, numerous iron (Fe II) lines were also observed, which are velocity-shifted by ? 120 km/s. This is clear evidence for the existence of shocks with velocities of more than 50 km/s, hence another confirmation of the outflow hypothesis.

The central protostar
Due to heavy extinction, the nature of an accreting protostellar object, i.e. a star in the process of formation, is usually difficult to infer. Accessible are only those that are located in the neighbourhood of their elder brethren, e.g. next to a cluster of hot stars (cf. ESO PR 15/03). Such already evolved massive stars are a rich source of energetic photons and produce powerful stellar winds of protons (like the “solar wind” but much stronger) which impact on the surrounding interstellar gas and dust clouds. This process may lead to partial evaporation and dispersion of those clouds, thereby “lifting the curtain” and allowing us to look directly at young stars in that region.

However, for all high-mass protostellar candidates located away from such a hostile environment there is not a single direct evidence for a (proto-)stellar central object; likewise, the origin of the luminosity – typically about ten thousand solar luminosities – is unclear and may be due to multiple objects or even embedded clusters.

The new disc in M 17 is the only system which exhibits a central object at the expected position of the forming star. The 2.2 ?m emission is relatively compact (240 AU x 450 AU) – too small to host a cluster of stars.

Assuming that the emission is due solely to the star, the astronomers derive an absolute infrared brightness of about K = -2.5 magnitudes which would correspond to a main sequence star of about 20 solar masses. Given the fact that the accretion process is still active, and that models predict that about 30-50% of the circumstellar material can be accumulated onto the central object, it is likely that in the present case a massive protostar is currently being born.

Theoretical calculations show that an initial gas cloud of 60 to 120 solar masses may evolve into a star of approximately 30-40 solar masses while the remaining mass is rejected into the interstellar medium. The present observations may be the first to show this happening.

Original Source: ESO News Release

Saturn’s Bands Becoming Clearer

Image credit: NASA/JPL/Space Science Institute
As Cassini nears its rendezvous with Saturn, new detail in the banded clouds of the planet’s atmosphere are becoming visible. Cassini took this narrow angle camera image on April 16, 2004 when it was 38.5 million kilometers (23.9 million miles) from Saturn. The image scale is approximately 231 kilometers (144 miles) per pixel. Contrast has been enhanced to aid visibility of features in the atmosphere.

This image was taken using a filter sensitive to light near 727 nanometers, which is one of the near-infrared absorption bands of methane gas, one of the constituents of Saturn’s atmosphere. Dark locales are generally areas of strong methane absorption, relatively free of high clouds. The bright areas are places with high, thick clouds which shield the methane below.

The clouded bands follow lines of constant latitude, and reflect the dominant effect of the planet’s rotation on the dynamics of its atmosphere. Bands move at different speeds, and the irregularities at their edges may be due to either the differential motion between them or to disturbances originating below the visible cloud layer. Such disturbances might be powered by the planet’s internal heat: Saturn radiates more energy than it receives from the Sun.

The dark spot at the south pole is remarkable because it is so small and well-centered. The spot could be affected by Saturn’s magnetic field, which is nearly aligned with the planet’s rotation axis, unlike the magnetic fields of Jupiter and Earth. From south to north, other notable features are the two white spots at roughly the same longitude but different latitudes, and the large dark oblong-shaped feature that extends into the bright equatorial band. The darker band beneath the bright equatorial region has begun to show a lacy pattern of lighter-colored, high altitude clouds, indicative of turbulent atmospheric conditions.

The moon Mimas (396 kilometers, 245 miles across) is visible to the left of the south pole. Saturn currently has 31 known moons, and Cassini scientists hope to discover new ones, perhaps embedded within the planet’s magnificent rings.

The Cassini-Huygens mission is a cooperative project of NASA, the European Space Agency and the Italian Space Agency. The Jet Propulsion Laboratory, a division of the California Institute of Technology in Pasadena, manages the Cassini-Huygens mission for NASA’s Office of Space Science, Washington, D.C. The Cassini imaging team is based at the Space Science Institute, Boulder, Colorado.

For more information about the Cassini-Huygens mission, visit http://saturn.jpl.nasa.gov and the Cassini imaging team home page, http://ciclops.org.

Original Source: CICLOPS News Release

Searching for a Way to Test String Theory

Image credit: Hubble
Scientists studying the Big Bang say that it is possible that string theory may one day be tested experimentally via measurements of the Big Bang’s afterglow.

Richard Easther, assistant professor of physics at Yale University will discuss the possibility at a meeting at Stanford University Wednesday, May 12, titled “Beyond Einstein: From the Big Bang to Black Holes.” Easther’s colleagues are Brian Greene of Columbia University, William Kinney of the University at Buffalo, SUNY, Hiranya Peiris of Princeton University and Gary Shiu of the University of Wisconsin.

String theory attempts to unify the physics of the large (gravity) and the small (the atom). These are now described by two theories, general relativity and quantum theory, both of which are likely to be incomplete.

Critics have disdained string theory as a “philosophy” that cannot be tested. However, the results of Easther and his colleagues suggest that observational evidence supporting string theory may be found in careful measurements of the Cosmic Microwave Background (CMB), the first light to emerge after the Big Bang.

“In the Big Bang, the most powerful event in the history of the Universe, we see the energies needed to reveal the subtle signs of string theory,” said Easther.

String theory reveals itself only over extreme small distances and at high energies. The Planck scale measures 10-35 meters, the theoretical shortest distance that can be defined. In comparison, a tiny hydrogen atom, 10-10 meters across, is ten trillion trillion times as wide. Similarly, the largest particle accelerators generate energies of 1015 electron volts by colliding sub-atomic particles. This energy level can reveal the physics of quantum theory, but is still roughly a trillion times lower than the energy required to test string theory.

Scientists say that the fundamental forces of the Universe — gravity (defined by general relativity), electromagnetism, “weak” radioactive forces and “strong” nuclear forces (all defined by quantum theory) — were united in the high-energy flash of the Big Bang, when all matter and energy was confined within a sub-atomic scale. Although the Big Bang occurred nearly 14 billion years ago its afterglow, the CMB, still blankets the entire universe and contains a fossilized record of the first moments of time.

The Wilkinson Microwave Anisotropy Probe (WMAP) studies the CMB and detects subtle temperature differences, within this largely uniform radiation, glowing at only 2.73 degrees Celsius above absolute zero. The uniformity is evidence of “inflation,” a period when the expansion of the Universe accelerated rapidly, around 10-33 seconds after the Big Bang. During inflation, the Universe grew from an atomic scale to a cosmic scale, increasing its size a hundred trillion trillion times over. The energy field that drove inflation, like all quantum fields, contained fluctuations. These fluctuations, locked into the cosmic microwave background like waves on a frozen pond, may contain evidence for string theory.

Easther and his colleagues compare the rapid cosmic expansion that occurred just after the Big Bang to enlarging a photograph to reveal individual pixels. While physics at the Planck scale made a “ripple” 10-35 meters across, thanks to the expansion of the Universe the fluctuation might now span many light years.

Easther stressed it is a long shot that string theory might leave measurable effects on the microwave background by subtly changing the pattern of hot and cold spots. However, string theory is so hard to test experimentally that any chance is worth trying. Successors to WMAP, such as CMBPol and the European mission, Planck, will measure the CMB with unprecedented accuracy.

The modifications to the CMB arising from string theory could deviate from the standard prediction for the temperature differences in the cosmic microwave background by as much as 1%. However, finding a small deviation from a dominant theory is not without precedent. As an example, the measured orbit of Mercury differed from what was predicted by Isaac Newton’s law of gravity by around seventy miles per year. General relativity, Albert Einstein’s law of gravity, could account for the discrepancy caused by a subtle warp in spacetime from the Sun’s gravity speeding Mercury’s orbit.

Refer to http://www-conf.slac.stanford.edu/einstein/ for more information on the “Beyond Einstein” meeting.

Original Source: Yale University News Release

Great Wall From Space

Image credit: ESA
ESA’s Proba satellite here shows a winding segment of the 7240-km long Great Wall of China situated just northeast of Beijing. The Great Wall’s relative visibility or otherwise from orbit has inspired much recent debate.

The 21 hours spent in space last October by Yang Liwei – China’s first ever space traveller – were a proud achievement for his nation. The only disappointment came as Liwei informed his countrymen he had not spotted their single greatest national symbol from orbit.

“The Earth looked very beautiful from space, but I did not see our Great Wall,” Liwei told reporters after his return.

China has cherished for decades the idea that the Wall was just about the only manmade object visible to astronauts from space, and the news disappointed many. A suggestion was made that the Wall be lit up at night so it can definitely be seen in future, while others called for school textbooks to be revised to take account of Liwei’s finding.

However such revisions may be unnecessary, according to American astronaut Eugene Cernan, speaking during a visit to Singapore: “In Earth’s orbit at a height of 160 to 320 kilometres, the Great Wall of China is indeed visible to the naked eye.”

Liwei may well have been unlucky with the weather and local atmospheric or light conditions ? with sufficiently low-angled sunlight the Wall’s shadow if not the Wall itself could indeed be visible from orbit.

What is for sure is that what the human eye may not be able to see, satellites certainly can. Proba’s High Resolution Camera (HRC) acquired this image of the Wall from 600 km away in space. The HRC is a black and white camera that incorporates a miniature Cassegrain telescope, giving it far superior spatial resolution to the human eye.

So while the HRC resolves mad-made objects down to five square metres, astronauts in low Earth orbit looking with the naked eye can only just make out such large-scale artificial features as field boundaries between different types of crops or the grid shape formed by city streets. They require binoculars or a zoom lens to make out individual roads or large buildings.

China’s Great Wall
Proba (Project for On Board Autonomy) is an ESA micro-satellite built by an industrial consortium led by the Belgian company Verhaert, launched in October 2001 and operated from ESA’s Redu Ground Station (Belgium).

Orbiting 600 km above the Earth?s surface, Proba was designed to be a one-year technology demonstration mission of the Agency but has since had its lifetime extended as an Earth Observation mission. It now routinely provides scientists with detailed environmental images thanks to CHRIS – a Compact High Resolution Imaging Spectrometer developed by UK-based Sira Electro-Optics Ltd – one of the main payloads on the 100 kg spacecraft.

Also aboard is the HRC, a small-scale monochromatic camera made up of a miniature Cassegrain telescope and a 1024 x 1024 pixel Charge-Coupled Device (CCD), as used in ordinary digital cameras, taking 25-km square images to a resolution of five metres. Proba boasts an ‘intelligent’ payload and has the ability to observe the same spot on Earth from a number of different angles and different combinations of optical and infra-red spectral bands. A follow-on mission, Proba-2, is due to be deployed by ESA around 2005.

Original Source: ESA News Release