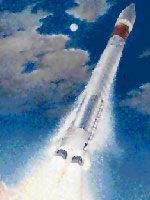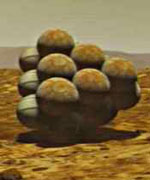
Image credit: NASA/JPL
Here I was: 26 years old, I had never worked on a flight project before, and all eyes were on me. Every time I walked by the Pathfinder project office, Tony Spear, the project manager, would throw his arm around me and announce, “Hey everybody, the whole mission is riding on this guy right here.”
Our task was to design and build airbags for Pathfinder’s landing on Mars an approach that had never been used on any mission. Airbags may seem like a simple, low-tech product, but it was eye-opening to discover just how little we knew about them. We knew that the only way to find out what we needed to learn was to build prototypes and test them. We just didn’t know how ignorant we were going to be.
Airbags seemed like a crazy idea to a lot of people. Nobody ever said that, mind you, but there seemed to be a widespread feeling that the airbags weren’t going to work. “We’ll let you guys go off and fool around until you fall flat on your faces.” That was the unspoken message I received day after day.
Everyone’s main fear about using these giant airbags was that the lander would be buried in an ocean of fabric when the airbags deflated. I began the search for a solution by building scale models of the airbags and lander, and I played with them in my office for a couple of months.
I built the models out of cardboard and plastic, and taped them up with packing tape I got from the hardware store and ribbon from the fabric store. I used a small raft inflator that I had at home to pump up my model airbags. Over and over again, I filled the miniature airbags and then let them deflate, watching what happened.
I fooled around with a dozen or more approaches before I finally came up with something that I thought worked. Slowly but surely, I came up with the idea of using cords that zigzag through belt loops inside the airbags. Pull the cords a certain way, and the cords would draw in all of the fabric and contain it. Wait to open the lander until after all of the airbags had retracted, and the fabric would be tucked neatly underneath.
Testing on another scale
Once we built large-scale models to conduct drop tests, we started by doing simple vertical drops, first at 30 feet, and then up to 70 feet. The bags performed well, although the way they bounced like a giant ball was interesting to observe. People began to realize that the concept might just be reasonably sound. But we still had our doubters. Even after we had the mechanics figured out for the airbags, a big question remained: What about the rocky Martian terrain?
Landing on Mars, we had to accept whatever Mother Nature gave us. The Pathfinder wouldn’t have a landing strip. To simulate conditions on Mars, we brought in large lava rocks the size of a small office desk. They were real lava rocks that our geologists had gone out and picked; if you tried to handle one of them, you would cut up your hands.
The more landscape simulations we tested, the more we started tearing up the airbags. Things were not looking good. Once again, we realized that this was an area that we just didn’t understand. The challenge was to protect the bladder layer, essentially the inner tube of the airbag system, with as little fabric as possible because the project could not afford to just throw mass at the problem. We tried material after material heavy duty Kevlars and Vectrans among them applying them in dozens of different configurations to the outside of the airbag.
Ultimately, we knew that we could just throw on more and more material and come up with a reasonably performing airbag system, but the weight of that solution would have come at the expense of something else another component of Pathfinder would have to be sacrificed. We weren’t, however, going to Mars just to land there and take a few pictures. We wanted to go there and do science and we needed instruments to do that science. So there was a lot of motivation to come up with the lowest-mass, highest-performance airbag system that we could.
5, 4, 3, 2, 1
Each test became like a ritual, because it took between eight and ten hours to prepare the system including transporting the airbags into the vacuum chamber, getting all of the instrumentation wired up, raising the airbags up to the top of the chamber, making sure all the rocks were in the right place, and preparing the nets.
The vacuum chamber where we did the drop tests used so much power that we were only able to test in the middle of the night. Once the doors of the vacuum chamber were closed, it took three or four hours just to pump down the chamber. At that point, everybody either broke for dinner or went to relax for a while, before coming back at midnight or whatever the appointed hour was. Then we had another 45 minutes of going over all of the instrumentation, going through checklists, and then ultimately the countdown.
The last 30 seconds of the countdown were excruciating. All of that anticipation, and then the whole impact lasted less than one second.
When we finished a drop test, we knew right away whether it was a success or failure. Brian Muirhead, the flight systems manager, was always insistent that I call him immediately-no matter how late it was. At 4 a.m., I would call him at his home and have to give him the news, “Brian, we failed another test.”
Each test was followed by a high-pressure rush to figure out what went wrong, what test to run next, how to fix the extensively damaged bags, and how to simultaneously incorporate whatever new “experimental fix” we came up with. As a team, we agreed upon a course of action, usually in a surly, sleep-deprived mood over a greasy breakfast at a local diner. Then the ILC Dover folks would figure out any new patterns that needed to be generated as well as the detailed engineering to ensure the seams and stitch designs could handle the test loads. Our hero was our lead sewer, who incidentally sewed Neil Armstrong and Buz Aldren’s moon suits. She worked under less-than-ideal conditions while we slept and turned our sometimes unusual ideas into reality. Usually by the next day we were ready to do it all over again.
Tony Spear and Brian understood the challenges we were facing. They knew we had a solid team working on this, and I always kept them informed on the technical progress. They were always understanding, but that’s not to say they were always happy.
Back to the drawing board
We said, “Okay, let’s start doing analysis, computer modeling of the airbags and the impact against the rocks.” At the same time, we expanded our test program to understand how to optimize this airbag abrasion layer.
It turned out that the time, money, and effort we expended on the computer modeling didn’t pay off. Though we ran the most sophisticated programs available back in 1993 and 1994, the results didn’t help us design the abrasion layer. We had to rely on our prototypes.
After doing dozens of drop tests, looking at the data, and studying what was happening, we started to realize that a single layer of heavy material wasn’t the solution. Multiple layers of lightweight material might prove stronger.
We were forced to decide on the final abrasion layer design in order to meet our scheduled Qualification drop tests. In spacecraft terms, this is supposed to be the last test that you run in order to qualify your final design. By the time you get to that point, there is supposed to be no question whatsoever that you have a fully functioning system that meets all of the mission requirements. It is supposed to be a check-the-box process that the system is ready for flight. The problem was that at that point we had still only experienced partial success; we’d never had that A+, 100% grade on any of our drop tests.
Flying in to watch that last drop test, my plane was delayed. One of my colleagues at the test facility called and asked me, “Do you want us to wait for you?” I told him, “No, go ahead.”
When I got to the facility, the test crew wasn’t there. I went into the control room and ran into the guy who processes the videotapes. “So what happened?” I asked him. “Did you guys do the test?” He pointed at a VCR and said, “The video is in there. Just go ahead and press play.”
So, I hit play. Down comes the airbag in the video it hits the platform and explodes catastrophically. My heart sank. We weren’t going to make it. But then I realized that there was something strangely familiar about the video I had just watched. In an instant it came to me; they had put in the videotape from our worst drop test. The practical joke could mean only one thing: We had had a successful drop test, and were finally good to go.
Original Source: NASA/JPL Story