I'm a long-time amateur astronomer and member of the American Association of Variable Star Observers (AAVSO). My observing passions include everything from auroras to Z Cam stars. I also write a daily astronomy blog called Astro Bob. My new book, "Wonders of the Night Sky You Must See Before You Die", a bucket list of essential sky sights, will publish in April. It's currently available for pre-order at Amazon and BN.
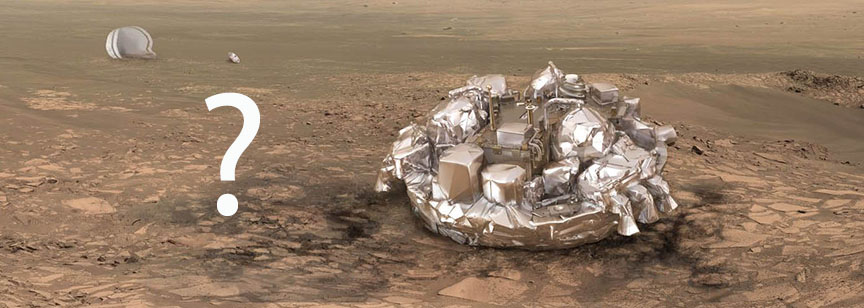
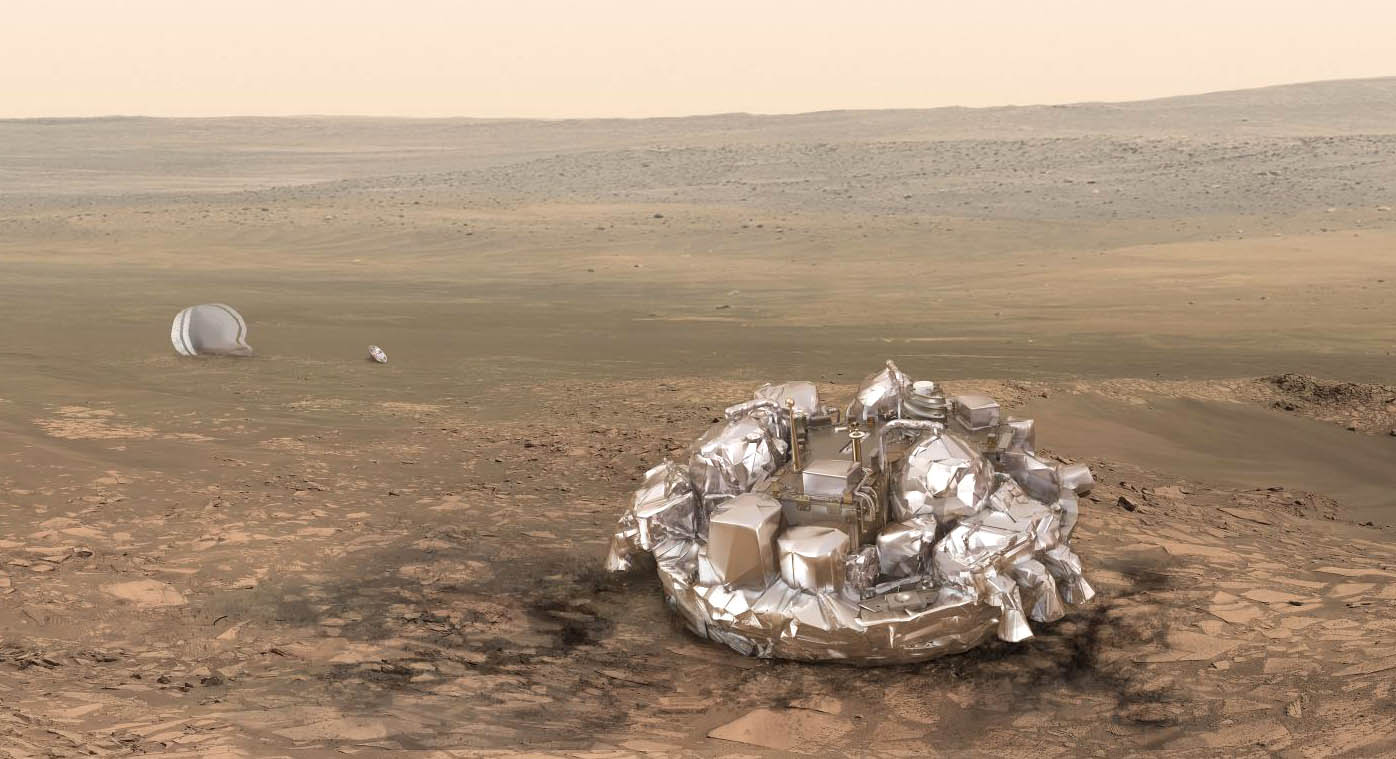
This artist's view shows the European Space Agency's Schiaparelli lander on Mars. It's unclear whether the landing was successful. Signals were received during its descent but then suddenly cut off. Mission control is working on the data now and will have an update on the status of the probe tomorrow morning Oct. 20. Credit: ESA/ATG medialab
This artist’s view shows the European Space Agency’s Schiaparelli lander on Mars. It’s unclear whether the landing was successful. Signals were received during its descent but then suddenly cut off. Mission control is working on the data now and will have an update on the status of the probe tomorrow morning Oct. 20. Credit: ESA/ATG medialab
Good news and bad news. First the good. After a seven-month and 300 million mile (483 million km) journey, the Trace Gas Orbiter (TGO) successfully achieved orbit around Mars today. A signal spike appeared out of the noise about 12:35 p.m. EDT to great applause and high-fives at ESA’s European Space Operations Center in Darmstadt, Germany.
Joy in the control room when the signal from the Trace Gas Orbiter was received this morning, signaling that the spacecraft had achieved orbit around Mars. Credit: ESA Livestream
Two hours later, news of the lander arrived. Not so good but to be fair, it’s still too early to tell. Schiaparelli broadcast a signal during its descent to the Red Planet that was received here on Earth and by the orbiting Mars Express. All well and good. But then mid-transmission, the signal cut out.
Paolo Ferri, head of ESA’s mission operations department, called the news “not good signs” but promised that his team would be analyzing the data through the night to determine the status of the lander. Their findings will be shared around mid-morning Friday Central European Time (around 5 a.m. EDT).
Three days ago, Schiaparelli separated from the orbiter and began a three-day coast to Mars. It entered the atmosphere today at an altitude of 76 miles (122 km) and speed of 13,049 mph (21,000 km/hr), protected from the hellish heat of re-entry by an aerodynamic heat shield.
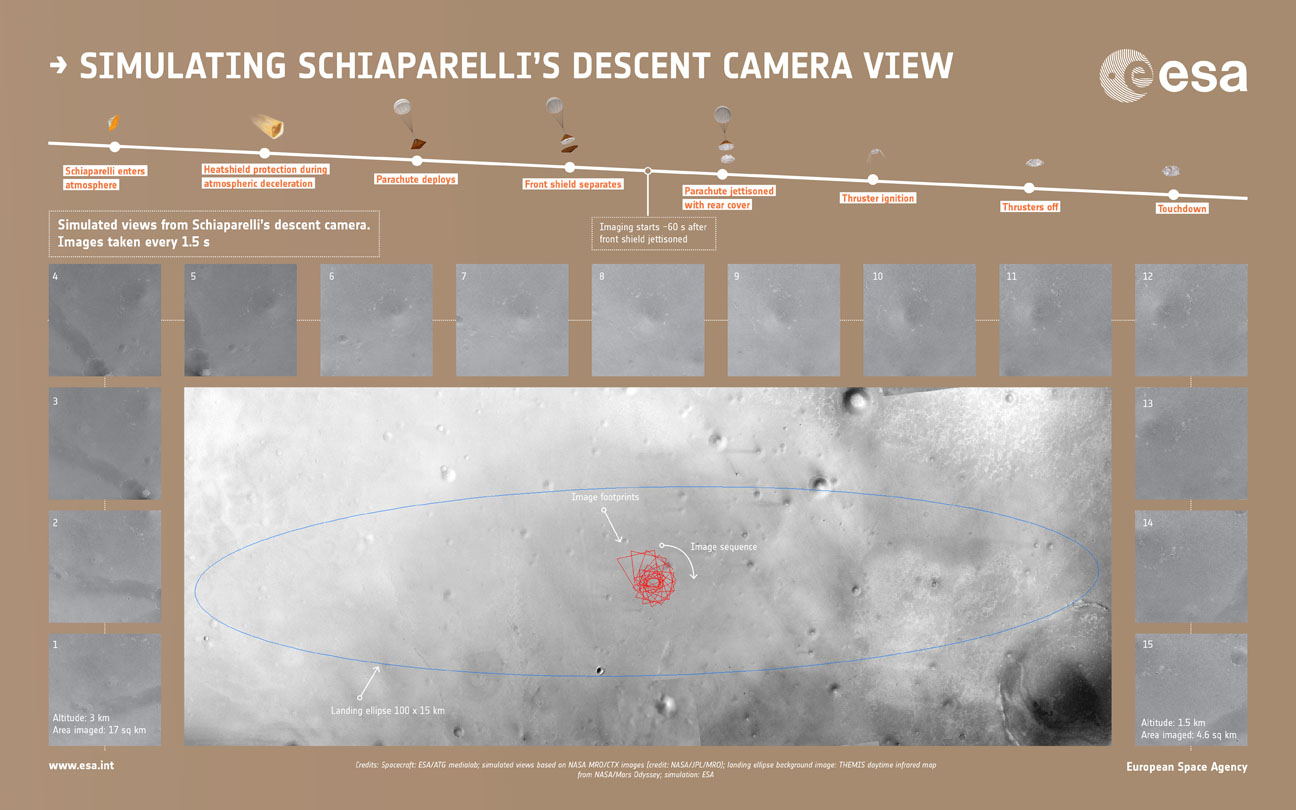
Simulated sequence of the 15 images that the descent camera Schiaparelli module should have taken during its descent to Mars this morning. In the simulated images shown here, the first was made from 3 km up. The camera had planned to take images every 1.5 seconds with the final image in this at ~1.5 km. Depending on Schiaparelli’s actual descent speed, the final image may have been snapped closer to the surface. The views were generated from images taken by NASA’s Mars Reconnaissance Orbiter of the center of Schiaparelli’s landing ellipse, and represent the views expected at each altitude. Copyright spacecraft: ESA/ATG medialab; simulated views from NASA images (credit: NASA/JPL/MRO); landing ellipse background image: Mars Odyssey; simulation: ESA
If all went well, at 6.8 miles (11 km) altitude, it would have deployed its parachute and moments later, dropped the heat shield. At 0.7 miles (1.2 km) above the surface, the lander would have jettisoned the chute and rear protective cover and fired its nine retrorockets while plummeting to the surface at 155 mph (255 mph). 29 seconds later, the thrusters would have shut off with Schiaparelli dropping the remaining 6.5 feet (2 meters) to the ground. Total elapsed time: just under 6 minutes.
For now, have hope. Given that Schiaparelli was primarily a test of landing technologies for future Mars missions, whatever happened, everything we learn from this unexpected turn of events will be invaluable. You can continue to follow updates on ESA’s Livestream.
** Update Oct. 20: It appears that the thrusters on Schiaparelli may have cut out too soon, causing the lander to drop from a higher altitude. In addition, the ejection of the parachute and back heat shield may have happened earlier than expected.
This from ESA:
“The data have been partially analyzed and confirm that the entry and descent stages occurred as expected, with events diverging from what was expected after the ejection of the back heat shield and parachute. This ejection itself appears to have occurred earlier than expected, but analysis is not yet complete.
The thrusters were confirmed to have been briefly activated although it seems likely that they switched off sooner than expected, at an altitude that is still to be determined.”
A brand new crater on the Moon! This new 12 meter (39 foot) diameter impact crater formed between 25 October 2012 and 21 April 2013 Credit: NASA/GSFC/Arizona State University].
Animation of a temporal pair of the new 39-foot (12-meter) impact crater on the moon photographed by NASA’s Lunar Reconnaissance Orbiter Credit: NASA/GSFC/Arizona State University
We often hear how the Moon’s appearance hasn’t changed in millions or even billions of years. While micrometeorites, cosmic rays and the solar wind slowly grind down lunar rocks, the Moon lacks erosional processes such as water, wind and lurching tectonic plates that can get the job done in a hurry.
One of a series of photos Apollo 11 astronaut Edwin Aldrin made of his bootprint in the dusty, sandy lunar soil, called regolith. Based on a newy study, the impression may disappear in a few tens of thousands of years instead a few million. Credit: NASA
Remember Buzz Aldrin’s photo of his boot print in the lunar regolith? It was thought the impression would last up to 2 million years. Now it seems that estimate may have to be revised based on photos taken by the Lunar Reconnaissance Orbiter (LRO) that reveal that impacts are transforming the surface much faster than previously thought.
This map shows the distribution of new impact craters (yellow dots) discovered by analyzing 14,000 narrow-angle camera (NAC) temporal pairs. The two red dots mark the location of the March 17, 2013 and September 11, 2013 impacts that were recorded by Earth-based video monitoring. LRO’s mission was recently extended an addition two years through September 2018. Credit: NASA/GSFC/ASUThe LRO’s high resolution camera, which can resolve features down to about 3 feet (1-meter) across, has been peering down at the Moon from orbit since 2009. Taking before and after images, called temporal pairs, scientists have identified 222 impact craters that formed over the past 7 years. The new craters range from 10 feet up to 141 feet (3-43 meters) in diameter.
By analyzing the number of new craters and their size, and the time between each temporal pair, a team of scientists from Arizona State University and Cornell estimated the current cratering rate on the Moon. The result, published in Nature this week, was unexpected: 33% more new craters with diameters of at least 30 feet (10 meters) were found than anticipated by previous cratering models.
LRO before and after images of an impact event on March 17, 2013. The newly formed crater is 59 feet (18 meters) in diameter. Subsurface regolith not exposed to sunlight forms a bright halo around the new crater. There also appears to be a larger nimbus of darker reflectance material visible much further beyond but centered on the impact. Credit: NASA/GSFC/Arizona State University
Similar to the crater that appeared on March 17, 2013 (above), the team also found that new impacts are surrounded by light and dark reflectance patterns related to material ejected during crater formation. Many of the larger impact craters show up to four distinct bright or dark reflectance zones. Nearest to the impact site, there are usually zone of both high and low reflectance. These two zones likely formed as a layer of material that was ejected from the crater during the impact shot outward to about 2½ crater diameters from the rim.
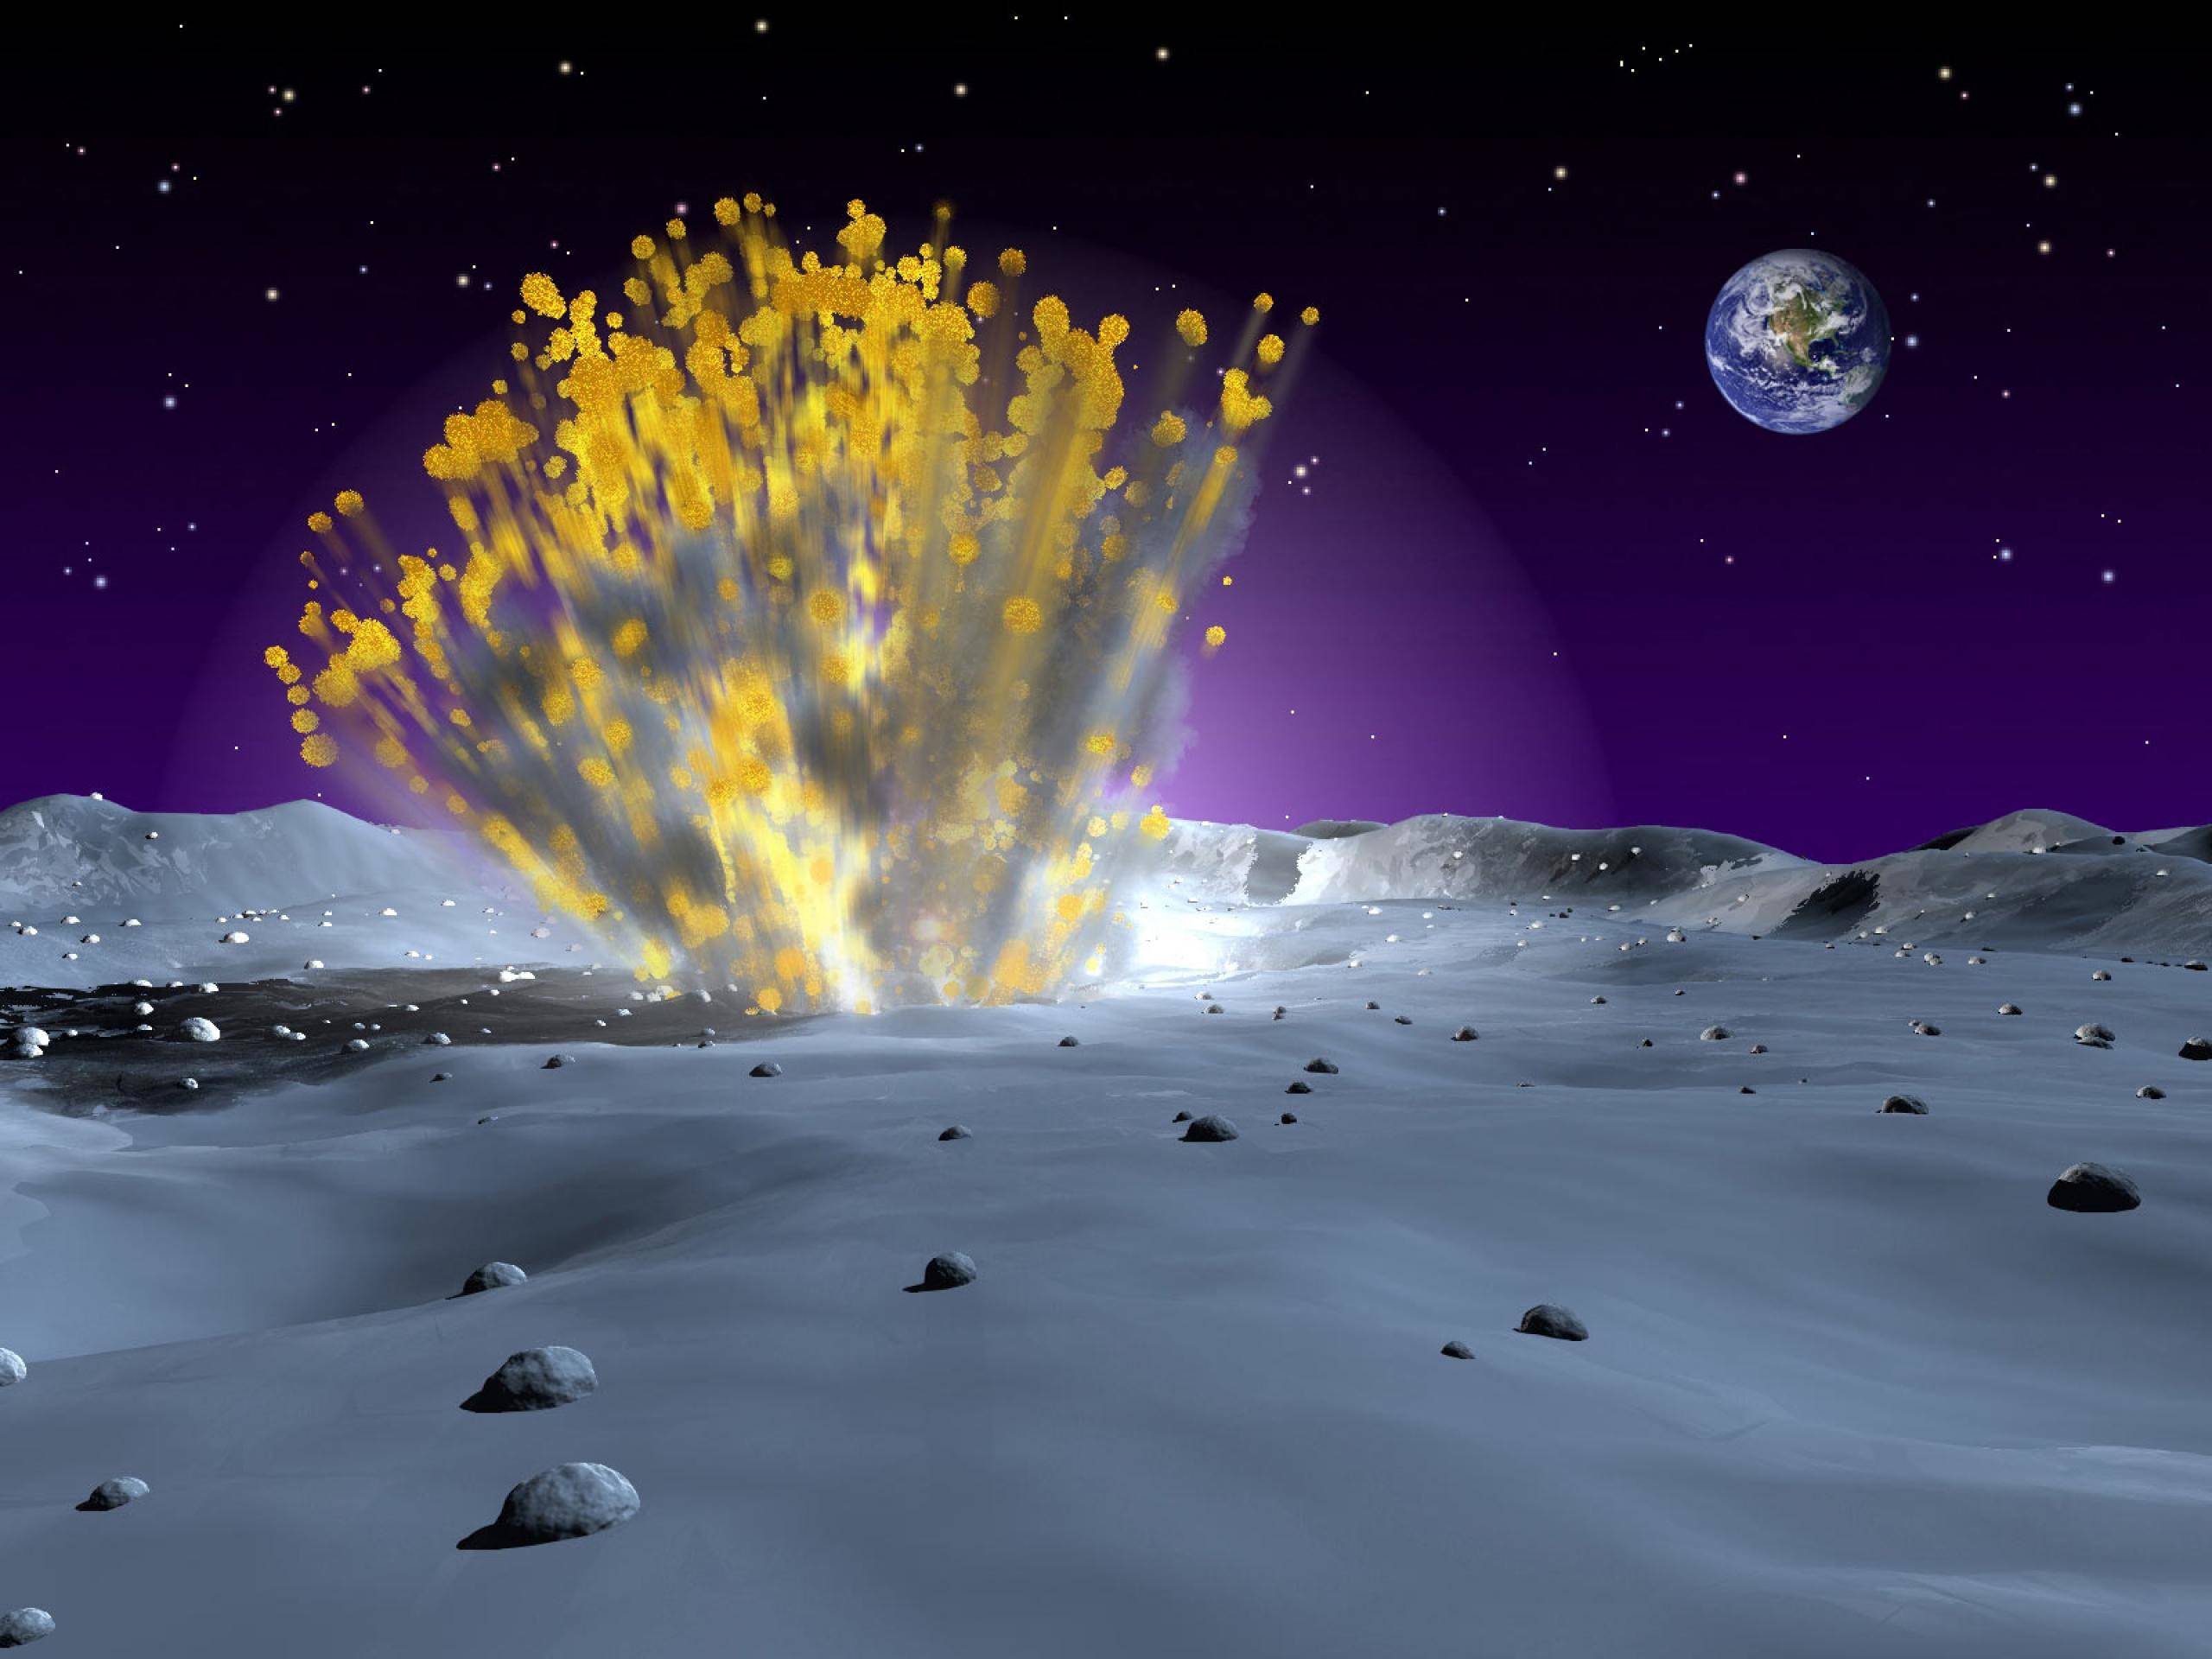
An artist’s illustration of a meteoroid impact on the Moon. Impacts dig up fresh material from below as well as send waves of hot rock vapor and molten rock across the lunar landscape, causing a much faster turnover of the moon soil than previously thought. Credit: NASA
From analyzing multiple impact sites, far flung ejecta patterns wrap around small obstacles like hills and crater rims, indicating the material was traveling nearly parallel to the ground. This kind of path is only possible if the material was ejected at very high speed around 10 miles per second or 36,000 miles per hour! The jet contains vaporized and molten rock that disturb the upper layer of lunar regolith, modifying its reflectance properties.
How LRO creates temporal pairs and scientists use them to discover changes on the moon’s surface.
In addition to discovering impact craters and their fascinating ejecta patterns, the scientists also observed a large number of small surface changes they call ‘splotches’ most likely caused by small, secondary impacts. Dense clusters of these splotches are found around new impact sites suggesting they may be secondary surface changes caused by material thrown out from a nearby primary impact. From 14,000 temporal pairs, the group identified over 47,000 splotches so far.
Here are two examples of a low reflectance (top) and high reflectance (bottom) splotch created either by a small impactor or more likely from secondary ejecta. In either case, the top few inches of the regolith (soil) was churned Credit: NASA/GSFC/Arizona State UniversityBased on estimates of size, depth and frequency of formation, the group estimated that the relentless churning caused by meteoroid impacts will turn over 99% of the lunar surface after about 81,000 years. Keep in mind, we’re talking about the upper regolith, not whole craters and mountain ranges. That’s more than 100 times faster than previous models that only took micrometeorites into account. Instead of millions of years for those astronaut boot prints and rover tracks to disappear, it now appears that they’ll be wiped clean in just tens of thousands!
Artist's view of the Schiaparelli lander descending to Mars on October 19. Credit: ESA
Watch how Schiaparelli will land on Mars. Touchdown will occur at 10:48 a.m. EDT (14:48 GMT) Wednesday Oct. 19.
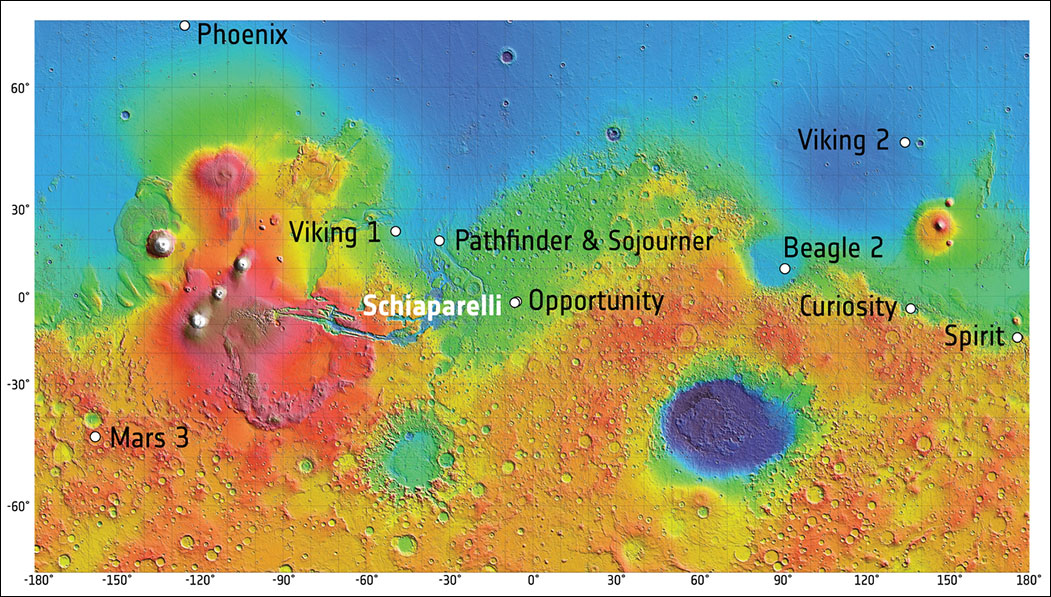
Cross your fingers for good weather on the Red Planet on October 19. That’s the day the European Space Agency’s Schiaparelli lander pops open its parachute, fires nine, liquid-fueled thrusters and descends to the surface of Mars. Assuming fair weather, the lander should settle down safely on the wide-open plains of Meridiani Planum near the Martian equator northwest of NASA’s Opportunity rover. The region is rich in hematite, an iron-rich mineral associated with hot springs here on Earth.
On Wednesday, October 19, the ExoMars 2016 entry, descent and landing demonstrator module, named Schiaparelli, will land on Mars in Meridiani Planum not far from the Opportunity rover. The map shows the seven rovers and landers that have reached the surface of Mars and successfully operated there. The background image is a shaded relief map of Mars created using data from NASA’s Mars Global Surveyor spacecraft.
The 8-foot-wide probe will be released three days earlier from the Trace Gas Orbiter (TGO) and coast toward Mars before entering its atmosphere at 13,000 mph (21,000 km/hr). During the 6-minute-long descent, Schiaparelli will decelerate gradually using the atmosphere to brake its speed, a technique called aerobraking. Not only is Meridiani Planum flat, it’s low, which means the atmosphere is thick enough to allow Schiaparelli’s heat shield to reduce its speed sufficiently so the chute can be safely deployed. The final firing of its thrusters will ensure a soft and controlled landing.
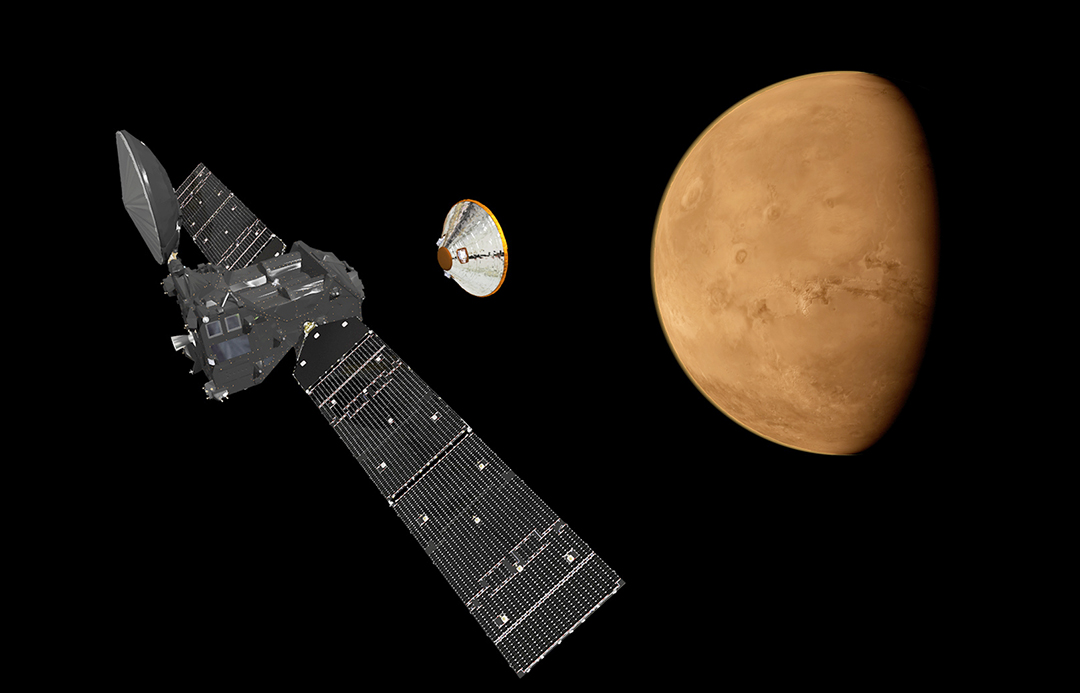
Artist’s impression showing Schiaparelli separating from the Trace Gas Orbiter and heading for Mars. The lander is named for late 19th century Italian astronomer Giovanni Schiaparelli, who created a detailed telescopic map of Mars. The orbiter will sniff out potentially biological gases such as methane in Mars’ atmosphere and track its sources and seasonal variations. Credit: ESA/ATG medialab
The lander is one-half of the ExoMars 2016 mission, a joint venture between the European Space Agency and Russia’s Roscosmos. The Trace Gas Orbiter (TGO) will fire its thrusters to place itself in orbit about the Red Planet the same day Schiparelli lands. Its job is to inventory the atmosphere in search of organic molecules, methane in particular. Plumes of methane, which may be biological or geological (or both) in origin, have recently been detected at several locations on Mars including Syrtis Major, the planet’s most prominent dark marking. The orbiter will hopefully pinpoint the source(s) as well as study seasonal changes in locations and concentrations.
This image, taken by ESA’s Express spacecraft, shows what appears to be a dust-covered frozen sea near the Martian equator. Located in Elysium Planitia, the flat plain is covered with irregular blocky shapes. They look just like the rafts of fragmented sea ice that lie off the coast of Antarctica on Earth. Raised levels of methane were detected here by ESA’s Mars Express orbiter. Copyright: ESA/DLR/FU Berlin (G. Neukum)
Methane (CH4) has long been associated with life here on Earth. More than 90% of the colorless, odorless gas is produced by living organisms, primarily bacteria. Sunlight breaks methane down into other gases over a span of about 300 years. Because the gas relatively short-lived, seeing it on Mars implies an active, current source. There may be several:
Long-extinct bacteria that released methane that became trapped in ice or minerals in the upper crust. Changing temperature and pressure could stress the ice and release that ancient gas into today’s atmosphere.
Bacteria that are actively producing methane to this day.
Abiological sources. Iron can combine with oxygen in terrestrial hot springs and volcanoes to create methane. This gas can also become trapped in solid forms of water or ‘cages’ called clathrate hydrates that can preserve it for a long time. Olivine, a common mineral on Earth and Mars, can react with water under the right conditions to form another mineral called serpentine. When altered by heat, water and pressure, such in environments such as hydrothermal springs, serpentine can produce methane.
Will it turn out to be burping bacteria or mineral processes? Let’s hope TGO can point the way.
This image illustrates possible ways methane might get into Mars’ atmosphere and also be removed from it: microbes (left) under the surface that release the gas into the atmosphere, weathering of rock (right) and stored methane ice called a clathrate. Ultraviolet light can work on surface materials to produce methane as well as break it apart into other molecules (formaldehyde and methanol) to produce carbon dioxide. Credit: NASA/JPL-Caltech/SAM-GSFC/Univ. of Michigan
The Trace Gas Orbiter will also use the Martian atmosphere to slow its speed and trim its orbital loop into a 248-mile-high (400 km) circle suitable for science observations. But don’t expect much in the way of scientific results right away; aerobraking maneuvers will take about a year, so TGO’s job of teasing out atmospheric ingredients won’t begin until December 2017. The study runs for 5 years.
The orbiter will also examine Martian water vapor, nitrogen oxides and other organics with far greater accuracy than any previous probe as well as monitor seasonal changes in the atmosphere’s composition and temperature. And get this — its instruments can map subsurface hydrogen, a key ingredient in both water and methane, down to a depth of a meter (39.4 inches) with greater resolution compared to previous studies. Who knows? We may discover hidden ice deposits or methane sinks that could influence where future rovers will land. Additional missions to Mars are already on the docket, including ExoMars 2020. More about that in a minute.
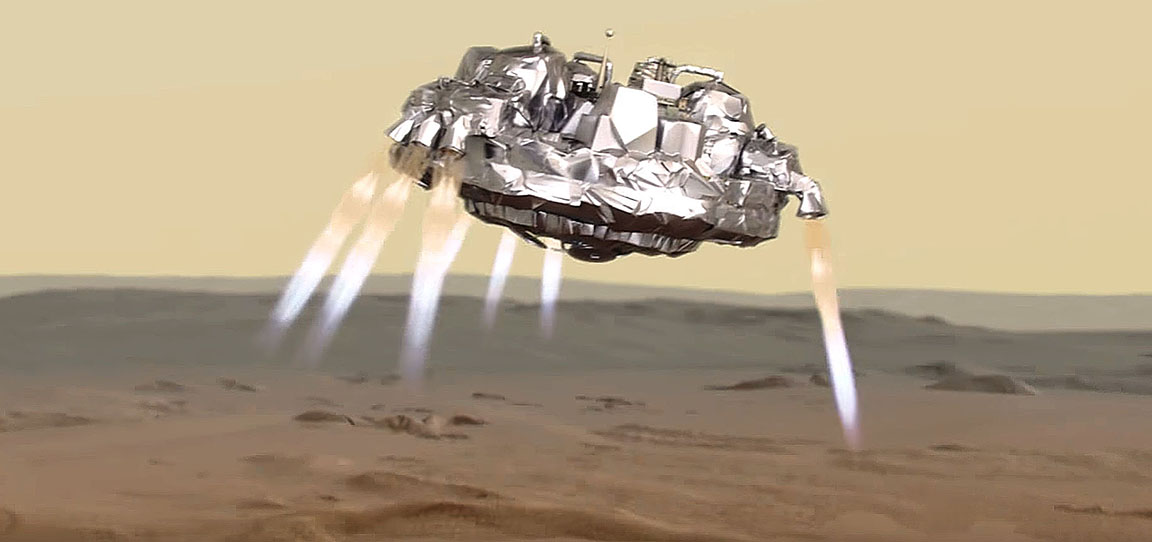
This artist’s view shows Schiaparelli, the entry, descent and landing demonstrator module, using its thrusters to make a soft landing on Mars on October 19 at 10:48 a.m. EDT (14:48 GMT). Credit: ESA/ATG medialab
While TGO’s mission will require years, the lander is expected to survive for only four Martian days (called ‘sols’) by using the excess energy capacity of its batteries. A set of scientific sensors will measure wind speed and direction, humidity, pressure and electric fields on the surface. A descent camera will take pictures of the landing site on the way down; we’ll should see those photos the very next day. Data and imagery from the lander will be transmitted to ESA’s Mars Express and a NASA Relay Orbiter, then relayed to Earth.
This animation shows the paths of the Trace Gas Orbiter and Schiaparelli lander on Oct. 19 when they arrive at Mars.
If you’re wondering why the lander’s mission is so brief, it’s because Schiaparelli is essentially a test vehicle. Its primary purpose is to test technologies for landing on Mars including the special materials used for protection against the heat of entry, a parachute system, a Doppler radar device for measuring altitude and liquid-fueled braking thrusters.
Martian dust storms can be cause for concern during any landing attempt. Since it’s now autumn in the planet’s northern hemisphere, a time when storms are common, there’s been some finger-nail biting of late. The good news is that storms of recent weeks have calmed and Mars has entered a welcome quiet spell.
To watch events unfold in real time, check out ESA’s live stream channel,Facebook pageand Twitter updates. The announcement of the separation of the lander from the orbiter will be made around 11 a.m. Eastern Time (15:00 GMT) Sunday October 16. Live coverage of the Trace Gas Orbiter arrival and Schiaparelli landing on Mars runs from 9-11:15 a.m. Eastern (13:00-15:15 GMT) on Wednesday October 19.Photos taken by Schiaparelli’s descent camera will be available starting at 4 a.m. Eastern (8:00 GMT) on October 20. More details here.We’ll also keep you updated on Universe Today.
The ExoMars 2016 mission will pave the way for a rover mission to the Red Planet in 2020. Credit: ESA
Everything we learn during the current mission will be applied to planning and executing the next — ExoMars 2020, slated to launch in 2020. That venture will send a rover to the surface to search and chemically test for signs of life, present or past. It will collect samples with a drill at various depths and analyze the fines for bio-molecules. Getting down deep is important because the planet’s thin atmosphere lets through harsh UV light from the sun, sterilizing the surface.
Are you ready for adventure? See you on Mars (vicariously)!
This is the cover of my new book “Night Sky with the Naked Eye”, a non-technical guide to all the great things visible with the naked eye at night. It’s published by Page Street Publishing and distributed by Macmillan and currently available for pre-order on Amazon and Barnes and Noble. Publication date is November 8. Look for it here on Universe Today soon!
If you’re like a lot of people, you don’t own a telescope but still have a passionate curiosity for what’s going on over your head. Good news! There’s lots to see up there without any equipment at all. This is the premise of my new book titled Night Sky with the Naked Eye, a guide to the wonders of the night sky that anyone can enjoy and understand whether you live in an apartment in the city or cabin 50 miles from nowhere.
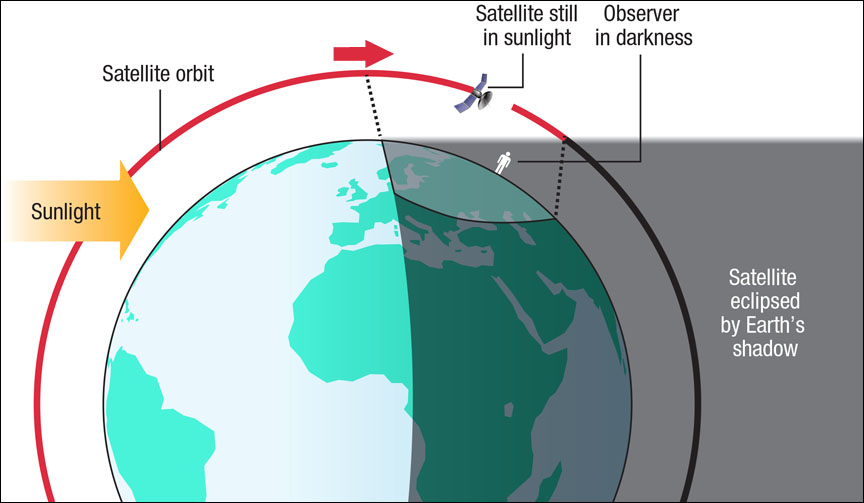
This diagram from the book depicts why many satellites are visible during twilight before they’re eclipsed by Earth’s shadow. Credit: Gary Meader
I’ve always been amazed at how accessible the universe is. To make that personal connection to the cosmos we only need acquire the habit looking up. Total eclipses, monster auroras and rich meteor showers get a lot of coverage and rightly so, but there’s a lot of other stuff up there. Little things that stoke our sense of wonder happen all the time: Earth’s rising shadow at sunset, nightly satellite flyovers, the beauty of an earth-lit crescent moon or seeing your shadow by the light of Venus.
Skywatching not only informs and delights, it has the power to expand our perspective and sense of place in the scheme of things. Gazing up at the Milky Way on a dark summer night, we feel both humbled and fortunate to be alive. The night sky’s elixir of beauty, timelessness and possibility feeds an inner quietude that can be our strength in stressful times.
Night sky observing sometimes means pleasant surprises like seeing this rare Venus pillar and corona. The book explores both celestial and atmospheric phenomena. Credit: Bob King
While the book touches on the contemplative aspects of skywatching, the bulk of it is activity-oriented, intended to inspire you to get outside. I’ve got tips on weather-watching and making the most of online resources like Clear Dark Sky and satellite imagery to help you find clear skies for that must-see special event. And if light pollution is a problem where you live, we explore ways to make a difference in reducing it as well as using online atlases to find a dark observing site.
The book covers the basics of celestial and planetary motions, how to find the brighter constellations and naked-eye deep sky objects along with suggested night sky viewing activities to share with friends and family. There are 1o chapters in all:
Chapter 1: Wave “Hi!” to the Astronauts
Chapter 2: Anticipating the Night
Chapter 3: Rockin’ N’ Rollin’ Earth
Chapter 4: Dive Into the Dippers
Chapter 5: Four Seasons of Starlight
Chapter 6: Meet the Rabbit in the Moon
Chapter 7: Face to Face with the Planets
Chapter 8: Wish Upon a Shooting Star
Chapter 9: Awed by Aurora
Chapter 10: Curiosities of the Night
This is back of the Night Sky with the Naked Eye book jacket. My book will appear back to back with another space book, titled Incredible Stories from Space: A Behind-the-Scenes Look at the Missions Changing Our View of the Cosmos, by Universe Today contributing editor Nancy Atkinson. Watch for her announcement shortly.
Not everything is a billion miles away. We also take time to examine and appreciate closer-to-home phenomena that are part of the nighttime experience like lunar halos, light pillars and the aurora borealis. No observers’ guide would be complete without challenges. How about seeing craters on the moon with no optical aid or spotting the gegenschein? It’s all here.
Because the Internet has become an integral part of our lives, the book includes numerous online resources as well as useful mobile phone apps related to constellation finding and aurora tracking and tips on night sky photography.
Whether for yourself or to give as a holiday gift for a budding skywatcher, I hope you check out my book, which will be featured in a special promotion here at Universe Today. It would be my privilege to serve as your night sky guide.
ESA/Rosetta/MPS for OSIRIS Team MPS/UPD/LAM/IAA/SSO/INTA/UPM/DASP/IDA
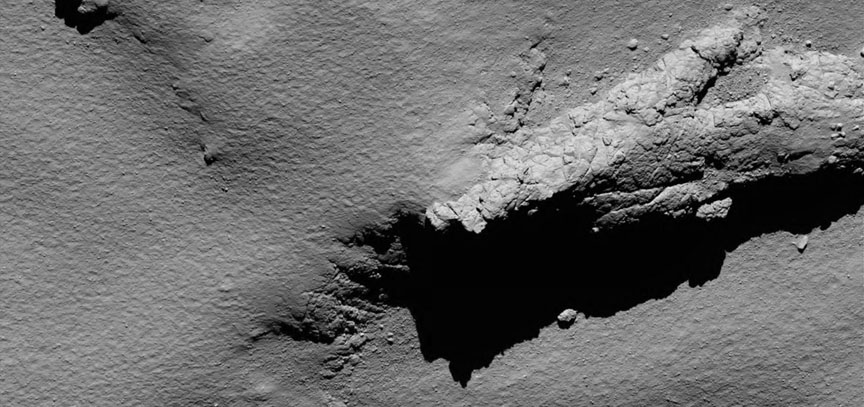
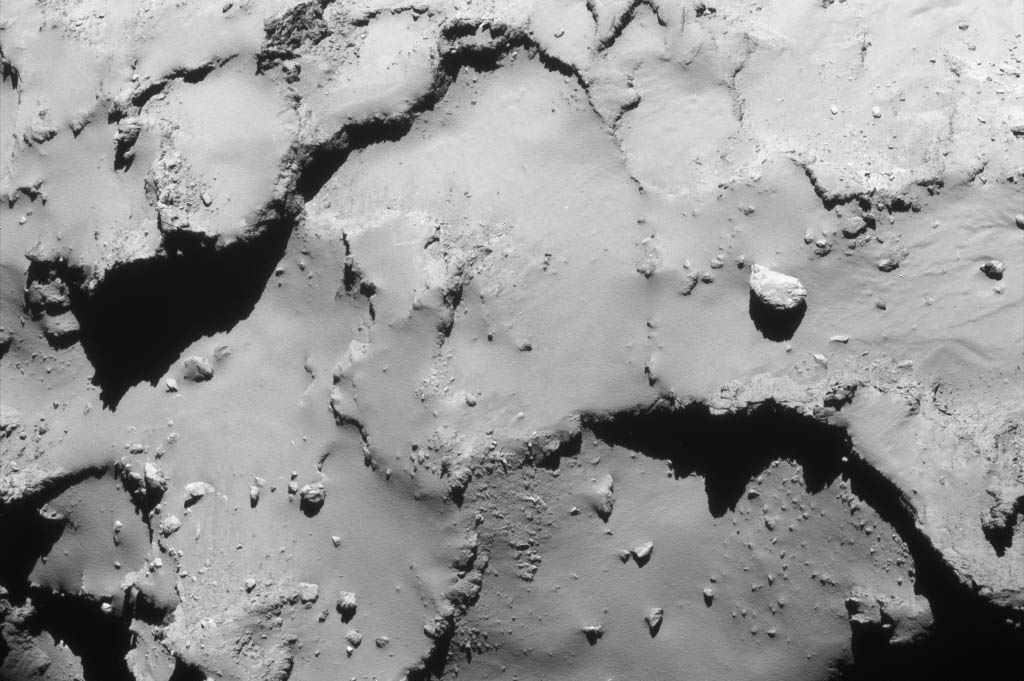
Craggy hills meet dust-covered plains in this landscape on Comet 67P taken from 10 miles (16 km) up late Thursday evening during Rosetta’s free fall . The image measures 2,014 feet (614 meters) across or just under a half-mile. At typical walking speed, you could walk from one side to the other in 10 minutes. This and all the photos below are copyright ESA/Rosetta/MPS for OSIRIS Team MPS/UPD/LAM/IAA/SSO/INTA/UPM/DASP/IDA
Rosetta fell silent moments after 6:19 a.m. Eastern Time (12:19 UT) this morning, when it gently crashed into 67P/C-G 446 million miles (718 million km) from Earth. As the probe descended to the comet’s bouldery surface of the comet in free fall, it snapped a series of ever-more-detailed photographs while gathering the last bits data on the density and composition of cometary gases, surface temperature and gravity field before the final curtain was drawn.
Let’s take the trip down, shall we?
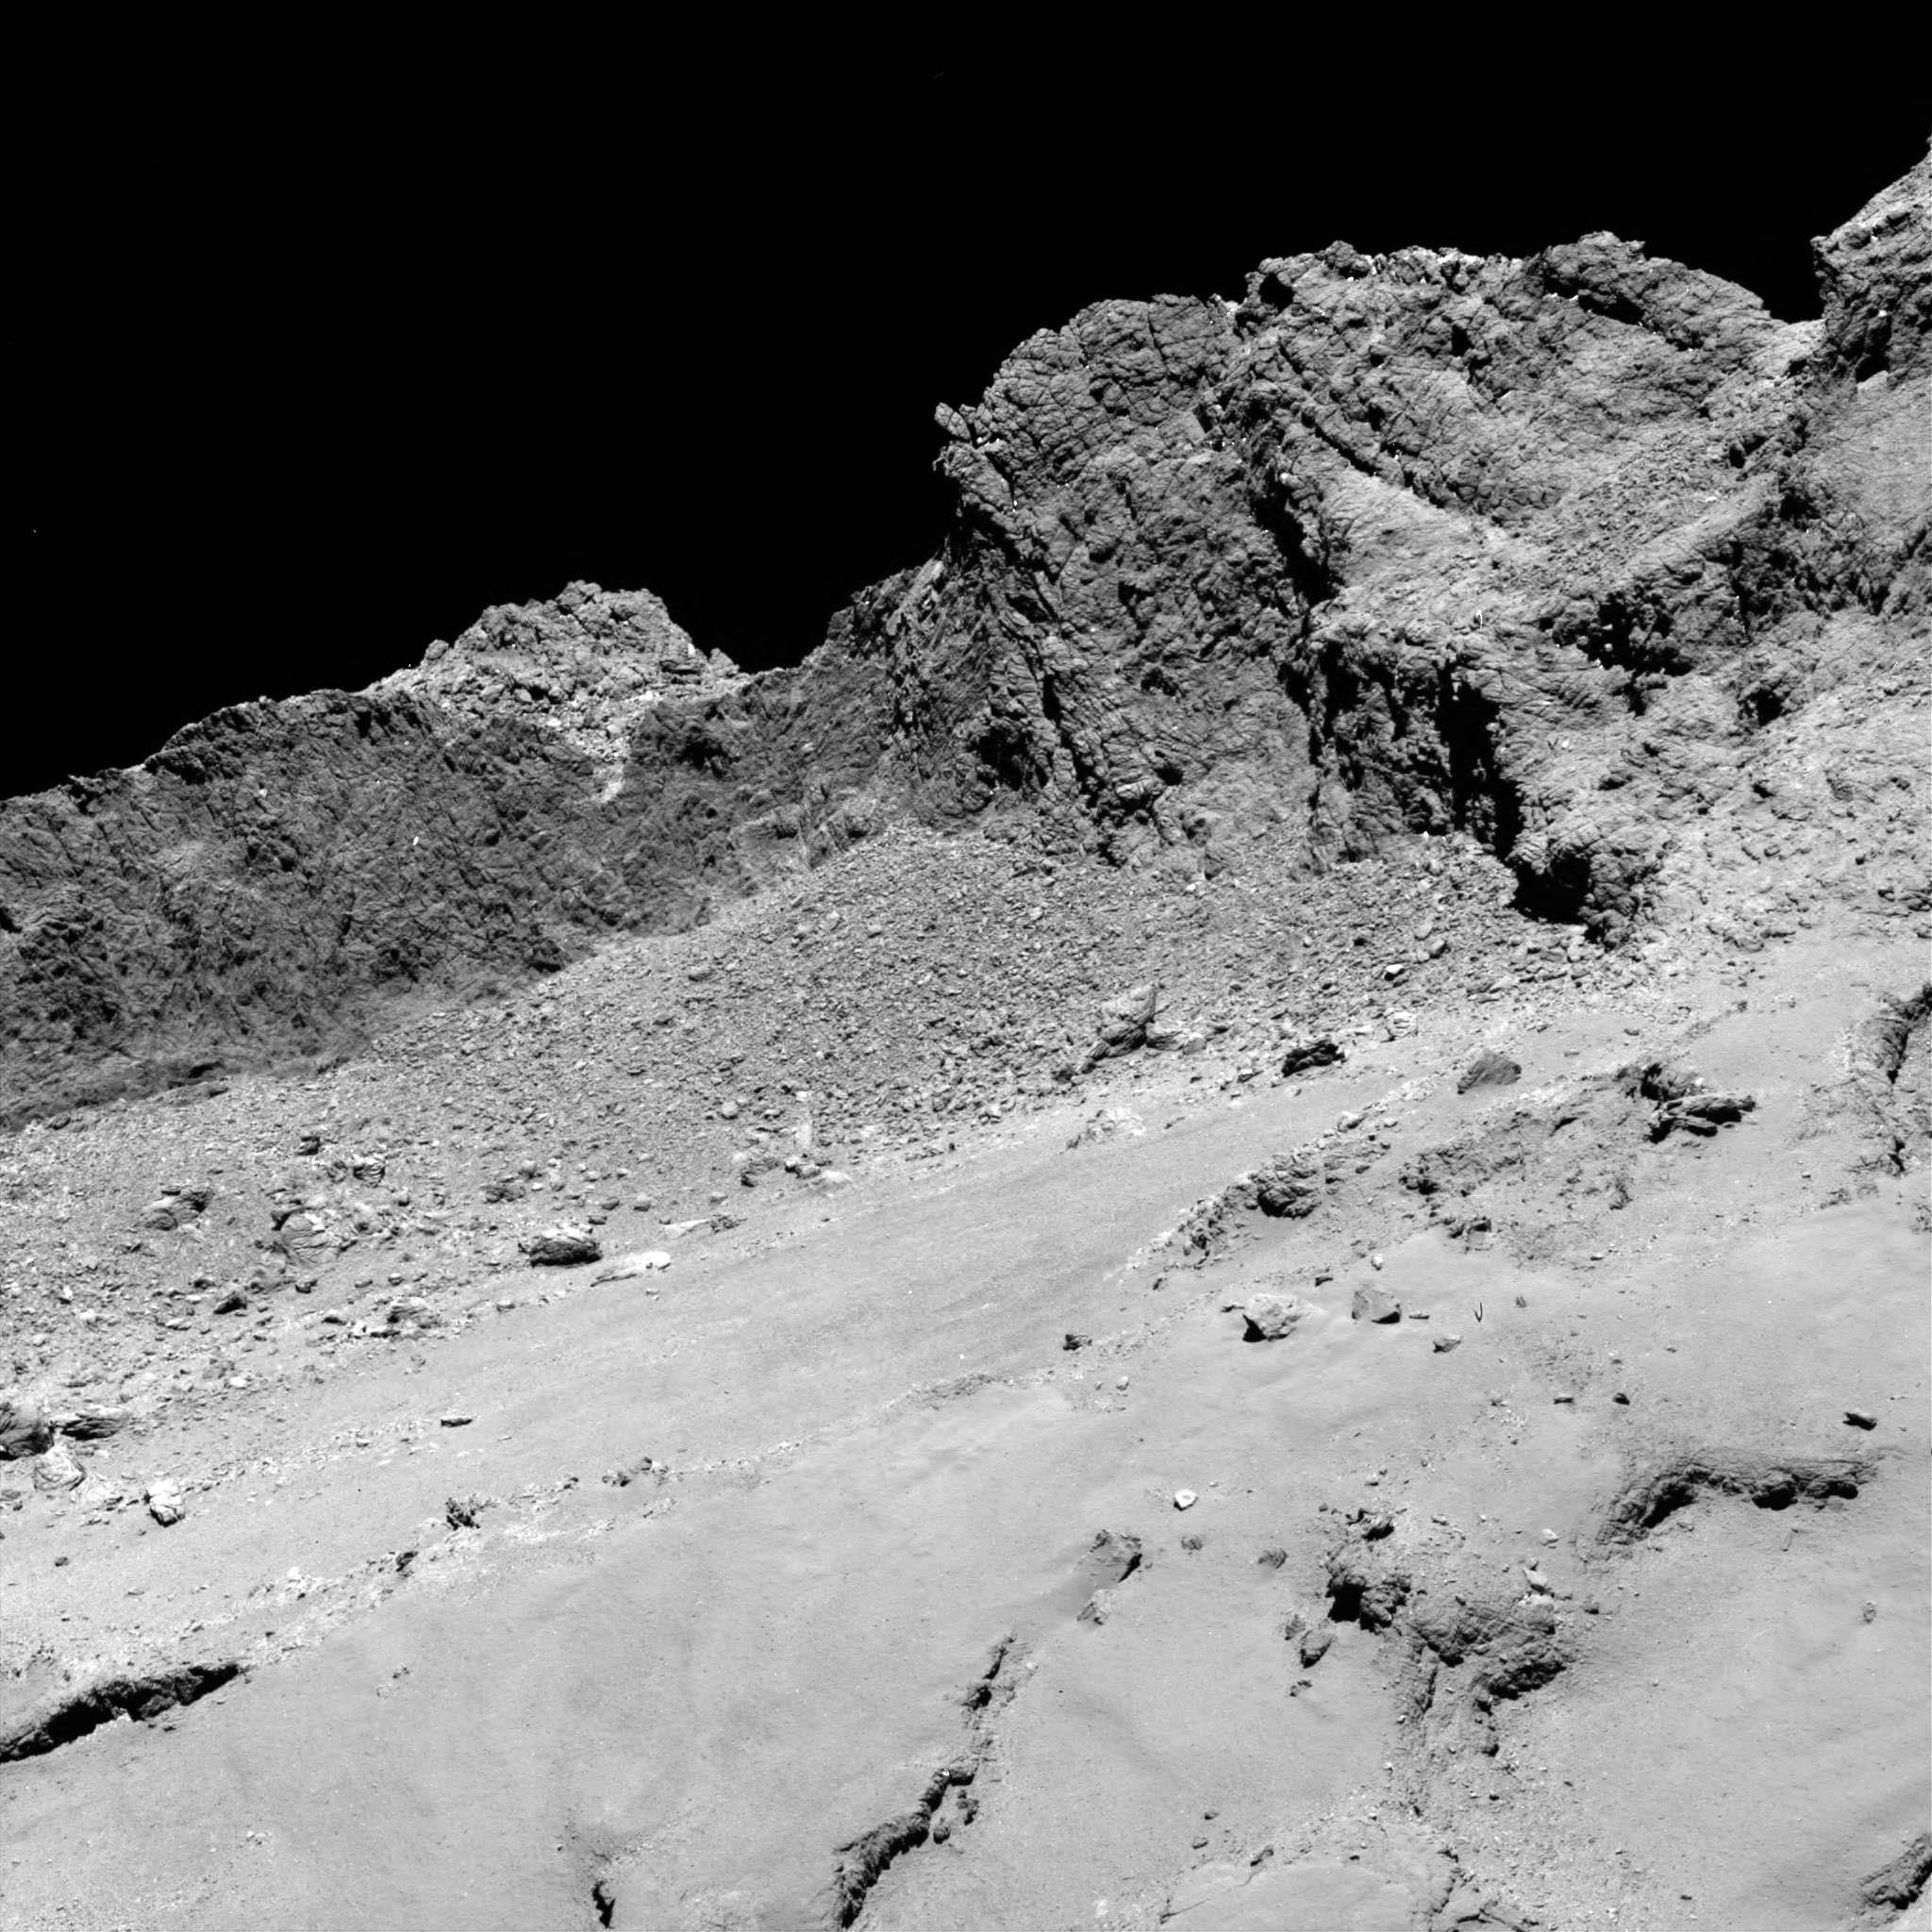
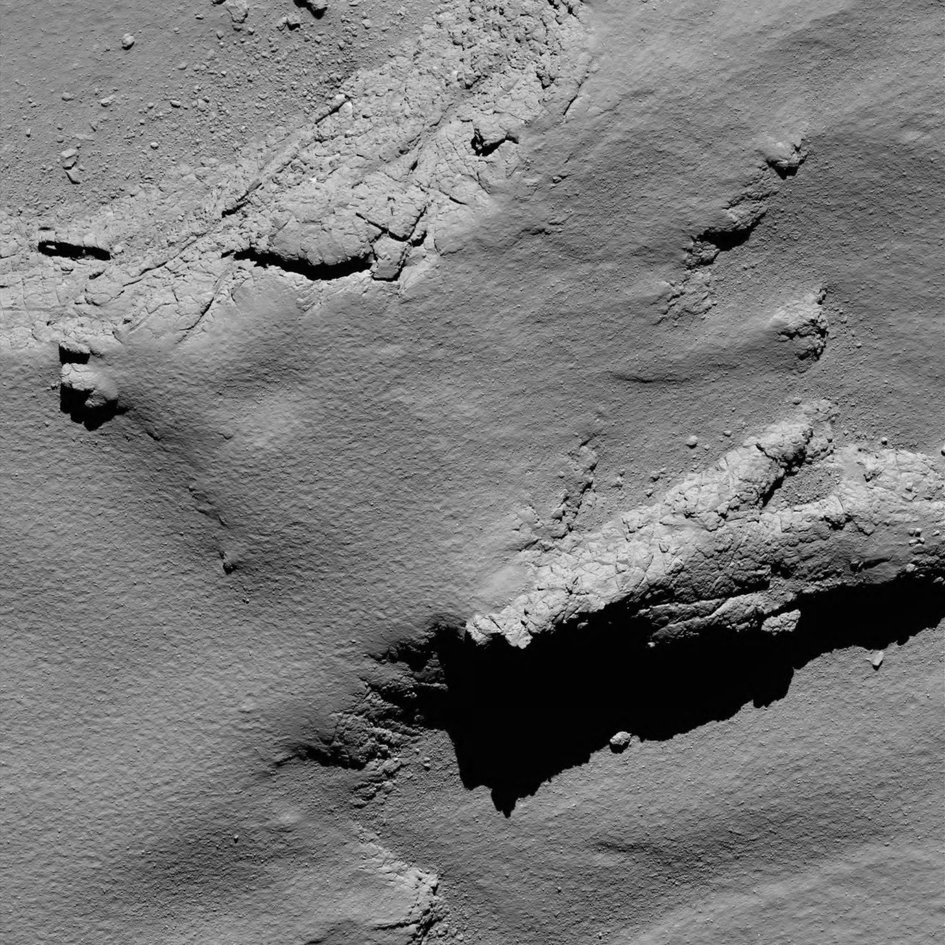
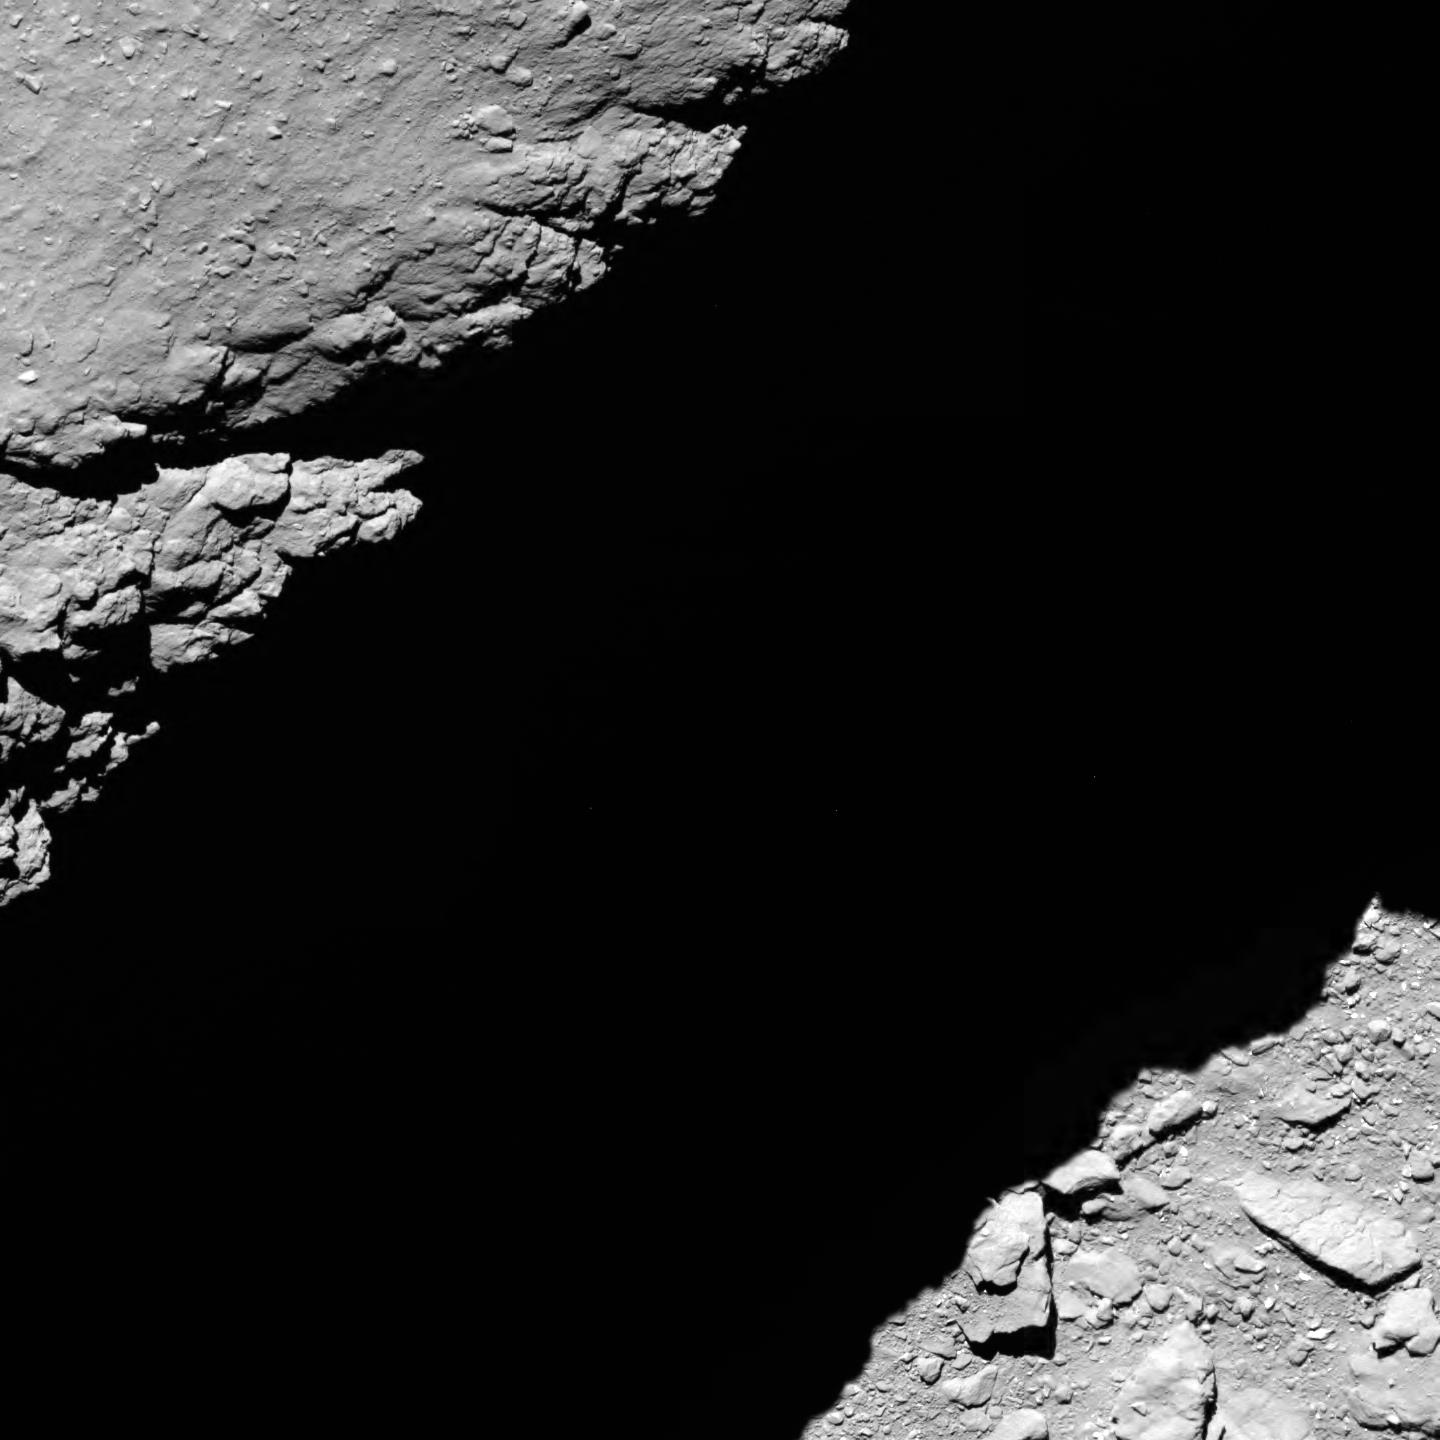
Rosetta’s last navigation camera image was taken just after the collision maneuver sequence Thursday evening (CDT) when the probe was 9.56 miles (15.4 km) above the comet’s surface. As in the photo above, much of the landscape is coated in a thick layer of dust that smoothes the comet’s contours.As Rosetta continued its descent onto the Ma’at region on the small lobe of Comet 67P/Churyumov-Gerasimenko, the OSIRIS narrow-angle camera captured this photo from 3.6 miles (5.8 km) up. We see dust-covered terrains, exposed walls and a few boulders on Ma’at, not far from the target impact region, which is located just below the lower edge. The image measures 738 feet (225 meters) across.Just a little bit lower now. This photo showing dramatic shadows was taken from 3.5 miles (5.7 km) above the surface of the comet at 4:21 a.m. EDT Friday morning September 30.Headed for the abyss? This photo was made at 6:14 a.m. from 3/4 mile (1.2 km) high just a few minutes before impact. The scene measures just 108 feet (33 meters) wide.This is Rosetta’s final image of Comet 67P/Churyumov-Gerasimenko, taken shortly before impact, an estimated 66 feet (~20 meters) above the surface. The view is similar to looking down from atop a three-story building. Side to side, the photo depicts an area only 7.8 feet (2.4 meters) across. The image is soft because Rosetta’s cameras weren’t designed to photograph the comet from this close.Sad to see its signal fade. A sequence of screenshots taken at ESA’s ESOC mission control show the signal from Rosetta fading moments before impact. The peak of the spectrum analyser is strong at 6:19 EDT, and a few moments later, it’s gone. At impact, Rosetta’s was shut down and no further communication will or can be made with the spacecraft. It will continue to rest on the comet for well-nigh eternity until 67P vaporizes and crumbles apart. Credit: ESA
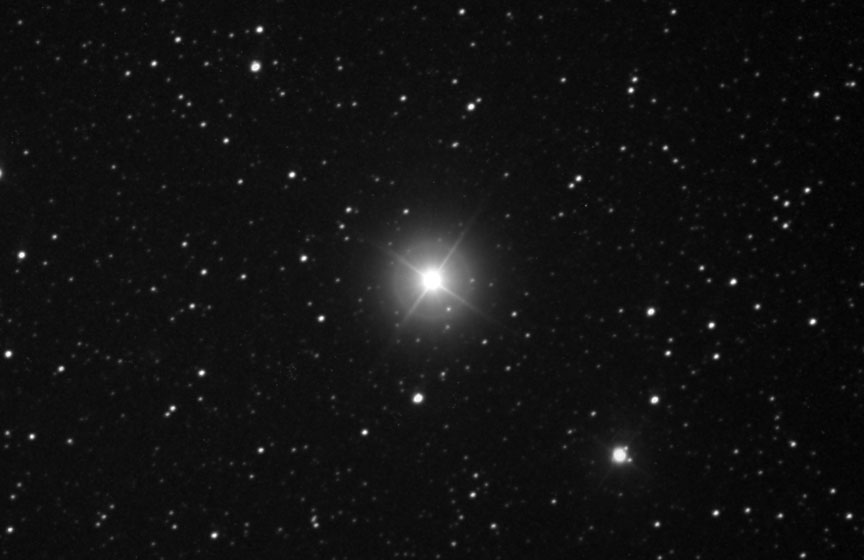
The possible nova in Lupus photographed on Sunday, Sept. 25 from Australia. The star is now bright enough to see in binoculars for observers in the far southern U.S. and points south. Credit: Joseph Brimacombe
On September 20, a particular spot in the constellation Lupus the Wolf was blank of any stars brighter than 17.5 magnitude. Four nights later, as if by some magic trick, a star bright enough to be seen in binoculars popped into view. While we await official confirmation, the star’s spectrum, its tattle-tale rainbow of light, indicates it’s a nova, a sun in the throes of a thermonuclear explosion.
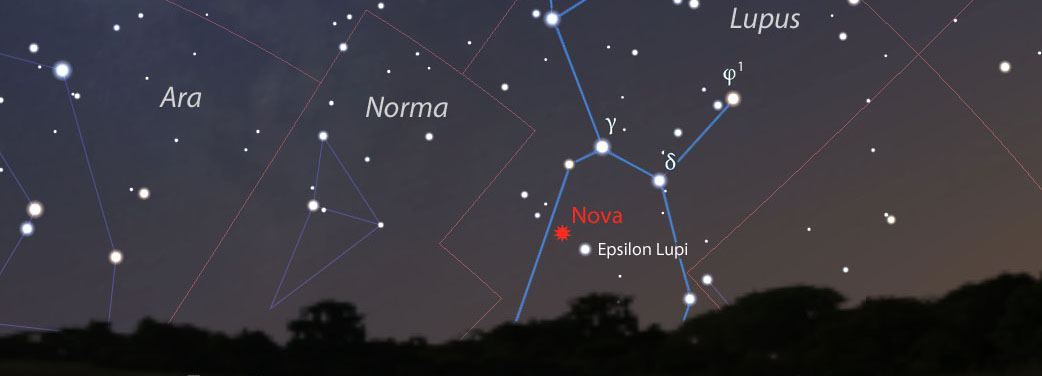
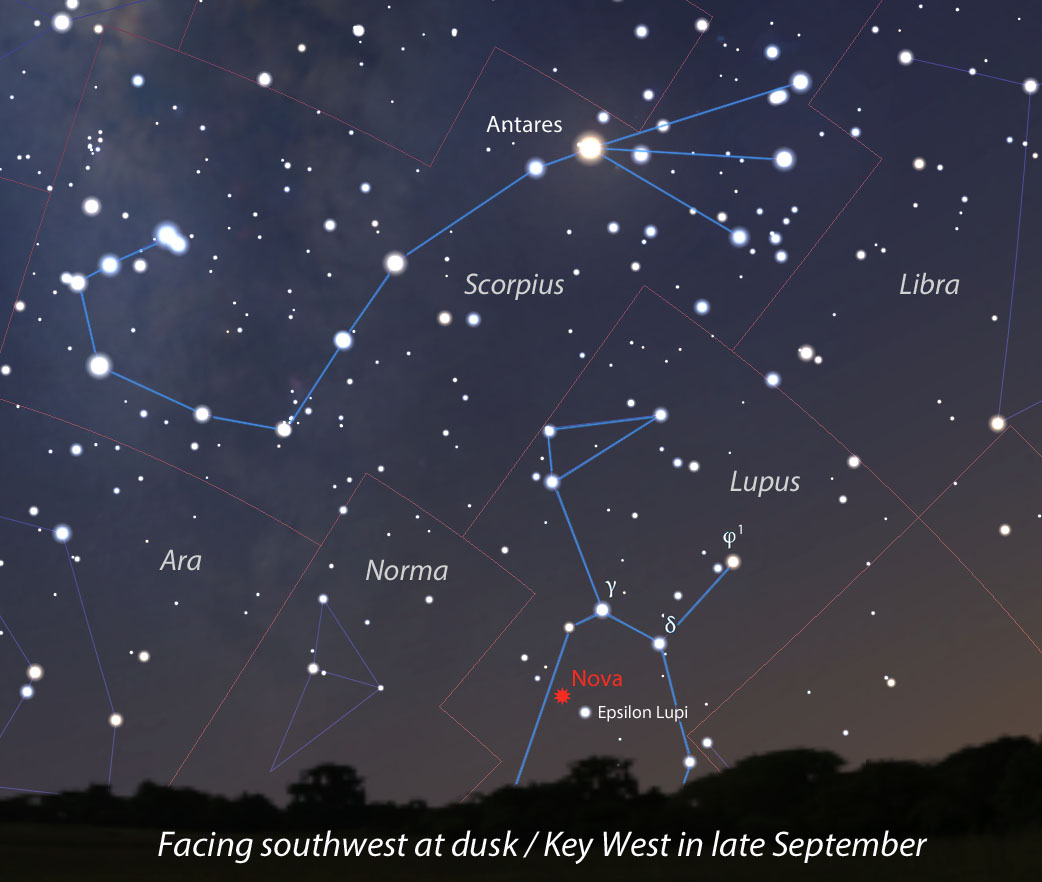
The nova was discovered on Sept. 23 near the 3rd magnitude star Epsilon Lupi. It rose from fainter than magnitude +17.5 to its current magnitude +6.8 in just four nights … and it’s still rising. It’s visible low in the southwestern sky in late evening twilight low northern latitudes, the tropics and southern hemisphere. This map shows the sky facing southwest about an hour after sunset from Key West, Florida, latitude 24.5 degrees north. Source: Stellarium
The nova, dubbed ASASSN-16kt for now, was discovered during the ongoing All Sky Automated Survey for SuperNovae (ASAS-SN or “Assassin”), using data from the quadruple 14-cm “Cassius” telescope in CTIO, Chile. Krzysztof Stanek and team reported the new star in Astronomical Telegram #9538. By the evening of September 23 local time, the object had risen to magnitude +9.1, and it’s currently +6.8. So let’s see — that’s about an 11-magnitude jump or a 24,000-fold increase in brightness! And it’s still on the rise.
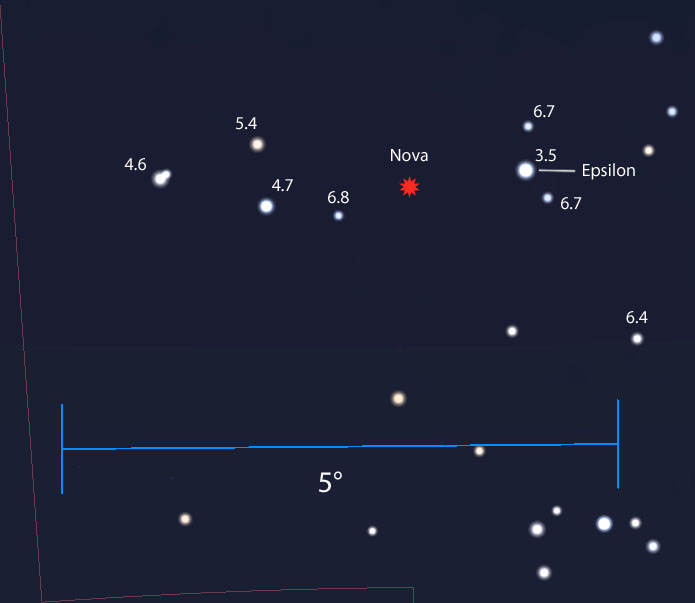
Use this chart with binoculars to help you find the likely nova. The field of view is about 5 degrees with north up. The “new star” lies between a bright triangle of stars to the east and the naked-eye star Epsilon Lupi to the west. Stars are labeled with magnitudes. Chart: Bob King, Source: Stellarium
The star is located at R.A. 15h 29?, –44° 49.7? in the southern constellation Lupus the Wolf. Even at this low declination, the star would clear the southern horizon from places like Chicago and further south, but in late September Lupus is low in the southwestern sky. To see the nova you’ll need a clear horizon in that direction and observe from the far southern U.S. and points south. If you’ve planned a trip to the Caribbean or Hawaii in the coming weeks, your timing couldn’t have been better!
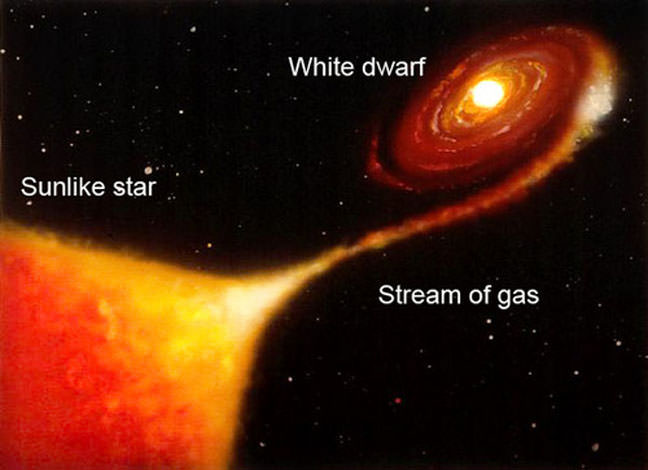
Novae occur in close binary systems where one star is a tiny but extremely compact white dwarf star. The dwarf draws material into a disk around itself, some of which is funneled to the surface and ignites in a nova explosion. Credit: NASA
I’ve drawn the map for Key West, one of southernmost locations on the U.S. mainland, where the nova stands about 7-8° high in late twilight, but you might also see it from southern Texas and the bottom of Arizona if you stand on your tippytoes. Other locales include northern Africa, Finding a good horizon is key. Observers across Central and South America, Africa, India, s. Asia and Australia, where the star is higher up in the western sky at nightfall, are favored.
Nova means “new”, but a nova isn’t a brand new star coming to life but rather an explosion that occurs on the surface of an otherwise faint star no one’s taken notice of – until the blast causes it to brighten 50,000 to 100,000 times.
You can use this AAVSO chart to find the nova and track its changing brightness. Star magnitudes are shown to the tenth with the decimal omitted. Click to enlarge. Credit: AAVSO
A nova occurs in a close binary star system, where a small but extremely dense and massive (for its size) white dwarf siphons hydrogen gas from its closely-orbiting companion. After whirling around in a flattened accretion disk around the dwarf, the material gets funneled down to the star’s 150,000 F° surface where gravity compacts and heats the gas until it detonates in a titanic thermonuclear explosion. Suddenly, a faint star that wasn’t on anyone’s radar vaults a dozen magnitudes to become a standout “new star”.
Novae are relatively rare and almost always found in the plane of the Milky Way, where the stars are most concentrated. The more stars, the greater the chances of finding one in a nova outburst. Roughly a handful a year are discovered, many of those in Scorpius and Sagittarius, in the direction of the galactic bulge.
We’ll keep tabs on this new object and report back with more information and photos as they become available. You can follow the new celebrity as well as print out finder charts on the American Association of Variable Star Observers (AAVSO) website by typing ASASSN-16kt in the info boxes.
I sure wish I wasn’t stuck in Minnesota right now or I’d be staring down the wolf’s new star!
Copyright: ESA with changes to annotations by the author
This montage of photos of Comet 67P/Churyumov-Gerasimenko was taken by ESA’s Rosetta spacecraft between Jan. 31 and March 25, 2015 and shows increasing activity as the comet approached perihelion. Credit: NAVCAM /CC-BY-SA-IGO-3.0
Rosetta awoke from a decade of deep-space hibernation in January 2014 and immediately got to work photographing, measuring and sampling comet 67P/C-G. On September 30 it will sleep again but this time for eternity. Mission controllers will direct the probe to impact the comet’s dusty-icy nucleus within 20 minutes of 10:40 Greenwich Time (6:40 a.m. EDT) that Friday morning. The high-resolution OSIRIS camera will be snapping pictures on the way down, but once impact occurs, it’s game over, lights out. Rosetta will power down and go silent.
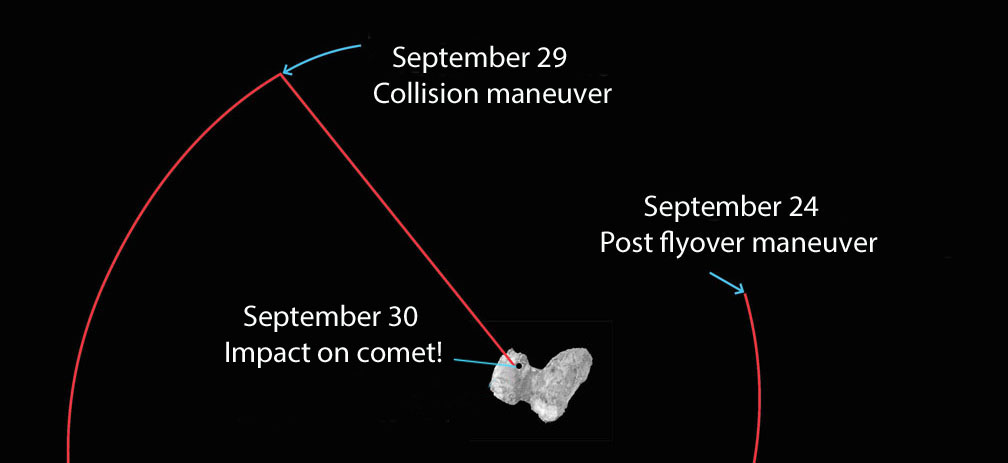
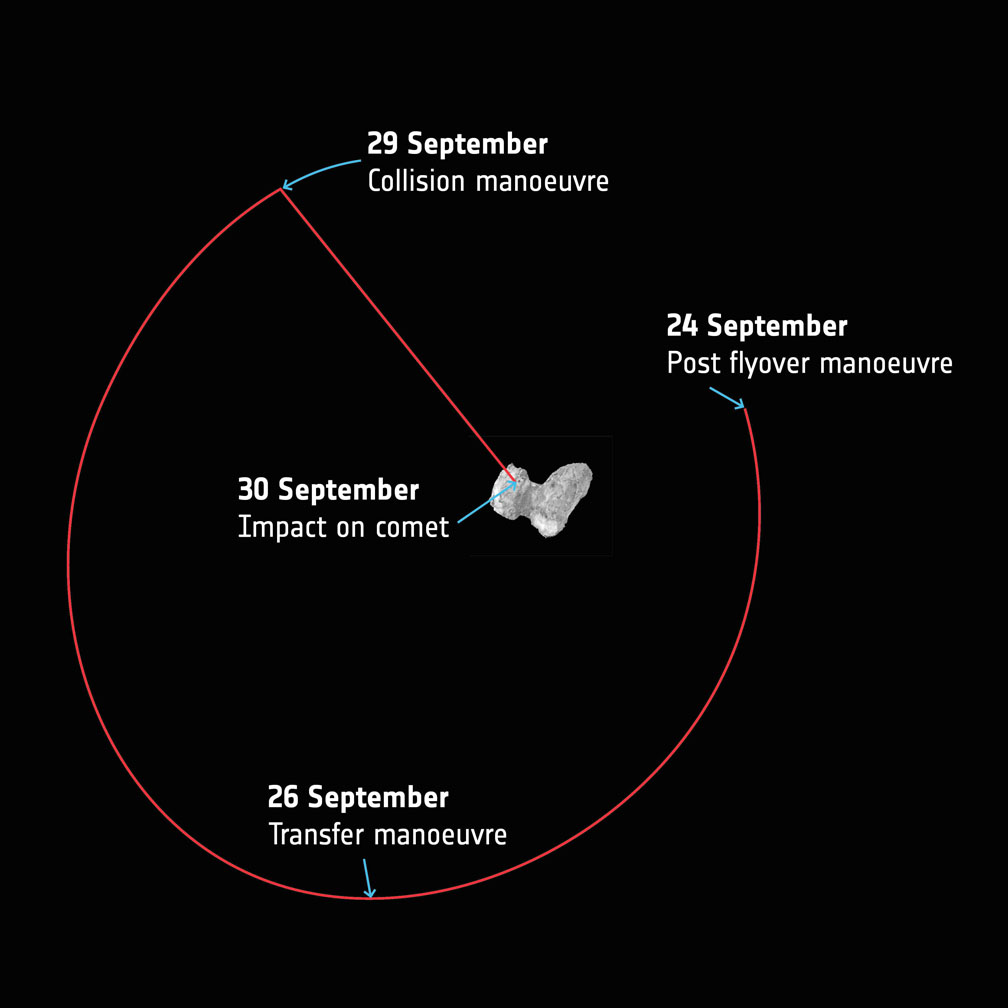
A simplified overview of Rosetta’s last week of maneuvers at Comet 67P/Churyumov–Gerasimenko. Starting today (Sept. 24) the spacecraft will leave the flyover orbits and transfer towards a 16 x 23 km orbit that will be used to prepare for the final descent. The collision course maneuver will take place in the evening Sept. 29 with impact expected to occur at 10:40 GMT (6:40 a.m. EDT), which taking into account the 40 minute signal travel time between Rosetta and Earth on Sept. 30, means the confirmation would be expected at mission control at 11:20 GMT (7:20 a.m. EDT). Copyright: ESA
Nearly three years have passed since Rosetta opened its eyes on 67P, this curious, bi-lobed rubber duck of a comet just 2.5 miles (4 km) across with landscapes ranging from dust dunes to craggy peaks to enigmatic ‘goosebumps’. The mission was the first to orbit a comet and dispatch a probe, Philae, to its surface. I think it’s safe to say we learned more about what makes comets tick during Rosetta’s sojourn than in any previous mission.
So why end it? One of the big reasons is power. As Rosetta races farther and farther from the Sun, less sunlight falls on its pair of 16-meter-long solar arrays. At mid-month, the probe was over 348 million miles (560 million km) from the Sun and 433 million miles (697 million km) from Earth or nearly as far as Jupiter. With Sun-to-Rosetta mileage increasing nearly 620,000 miles (1 million km) a day, weakening sunlight can’t provide the power needed to keep the instruments running.
Rosetta’s last orbits around the comet
Rosetta’s also showing signs of age after having been in the harsh environment of interplanetary space for more than 12 years, two of them next door to a dust-spitting comet. Both factors contributed to the decision to end the mission rather than put the probe back into an even longer hibernation until the comet’s next perihelion many years away.
Since August 9, Rosetta has been swinging past the comet in a series of ever-tightening loops, providing excellent opportunities for close-up science observations. On September 5, Rosetta swooped within 1.2 miles (1.9 km) of 67P/C-G’s surface. It was hoped the spacecraft would descend as low as a kilometer during one of the later orbits as scientists worked to glean as much as possible before the show ends.
Rosetta is targeted to land at the site within this planned impact ellipse in the Ma’at region on the comet’s smaller lobe. See below for a closer view. Credit: ESA/Rosetta/NAVCAM – CC BY-SA IGO 3.0
The final of 15 close flyovers will be completed today (Sept. 24) after which Rosetta will be maneuvered from its current elliptical orbit onto a trajectory that will eventually take it down to the comet’s surface on Sept. 30.
The beginning of the end unfolds on the evening of the 29th when Rosetta spends 14 hours free-falling slowly towards the comet from an altitude of 12.4 miles (20 km) — about 4 miles higher than a typical commercial jet — all the while collecting measurements and photos that will be returned to Earth before impact. The last eye-popping images will be taken from a distance of just tens to a hundred meters away.
The landing will be a soft one, with the spacecraft touching down at walking speed. Like Philae before it, it will probably bounce around before settling into place. Mission control expects parts of the probe to break upon impact.
Taking into account the additional 40 minute signal travel time between Rosetta and Earth on the 30th, confirmation of impact is expected at ESA’s mission control in Darmstadt, Germany, within 20 minutes of 11:20 GMT (7:20 a.m. EDT). The times will be updated as the trajectory is refined. You can watch live coverage of Rosetta’s final hours on ESA TV.
ESAHangout: Preparing for Rosetta’s grand finale
“It’s hard to believe that Rosetta’s incredible 12.5 year odyssey is almost over, and we’re planning the final set of science operations, but we are certainly looking forward to focusing on analyzing the reams of data for many decades to come,” said Matt Taylor, ESA’s Rosetta project scientist.
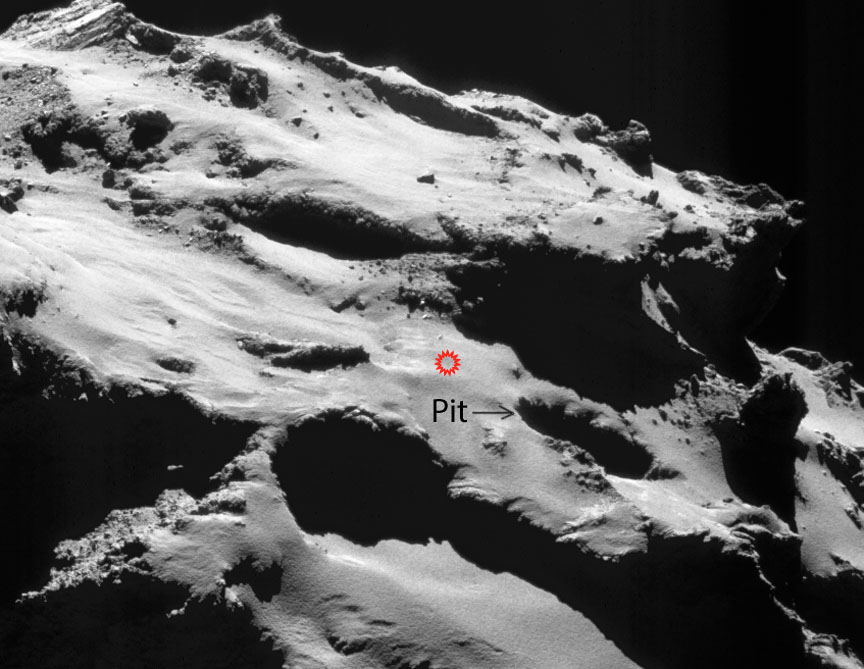
The spacecraft landing site is shown in red and located next to Deir el-Medina, a large pit (arrowed). Credit: ESA/Rosetta/NAVCAM – CC BY-SA IGO 3.0
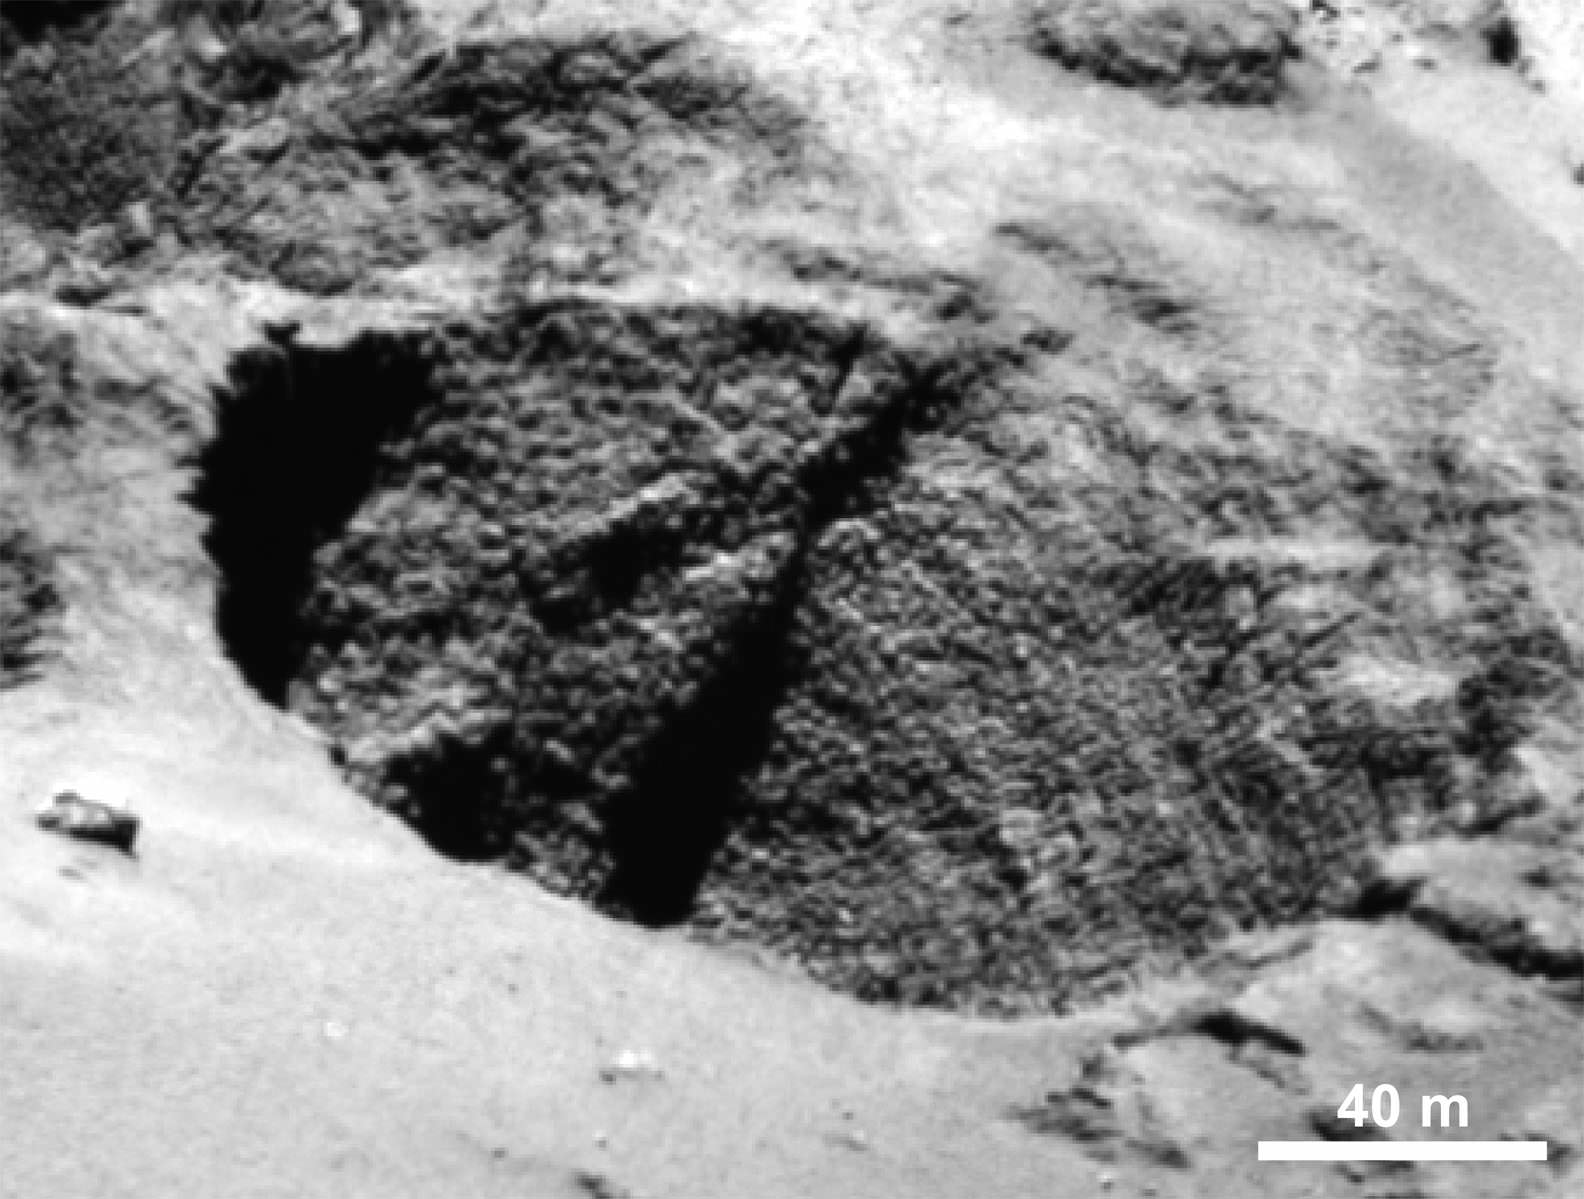
Plans call for the spacecraft to impact the comet somewhere within an ellipse about 1,300 x 2,000 feet (600 x 400 meters) long on 67P’s smaller lobe in the region known as Ma’at. It’s home to several active pits more than 328 feet (100 meters) in diameter and 160-200 feet (50-60 meters) deep, where a number of the comet’s dust jets originate. The walls of the pits are lined with fascinating meter-sized lumpy structures called ‘goosebumps’, which scientists believe could be early ‘cometesimals’, the icy snowballs that stuck together to create the comet in the early days of our Solar System’s formation.
Close-up of a curious surface texture nicknamed ‘goosebumps’. The bumps are about 9 feet (3 meters) across and seen on very steep slopes and exposed cliff faces. They may represent the original balls of icy dust that glommed together to form comets 4.5 billion years ago. Credit: ESA/Rosetta/MPS for OSIRIS Team MPS/UPD/LAM/IAA/SSO/INTA/UPM/DASP/IDA
During free-fall, the spacecraft will target a point adjacent to a 425-foot (130 m) wide, well-defined pit that the mission team has informally named Deir el-Medina, after a structure with a similar appearance in an ancient Egyptian town of the same name. High resolution images should give us a spectacular view of these enigmatic bumps.
While we hate to see Rosetta’s mission end, it’s been a blast going for a 2-year-plus comet ride-along.
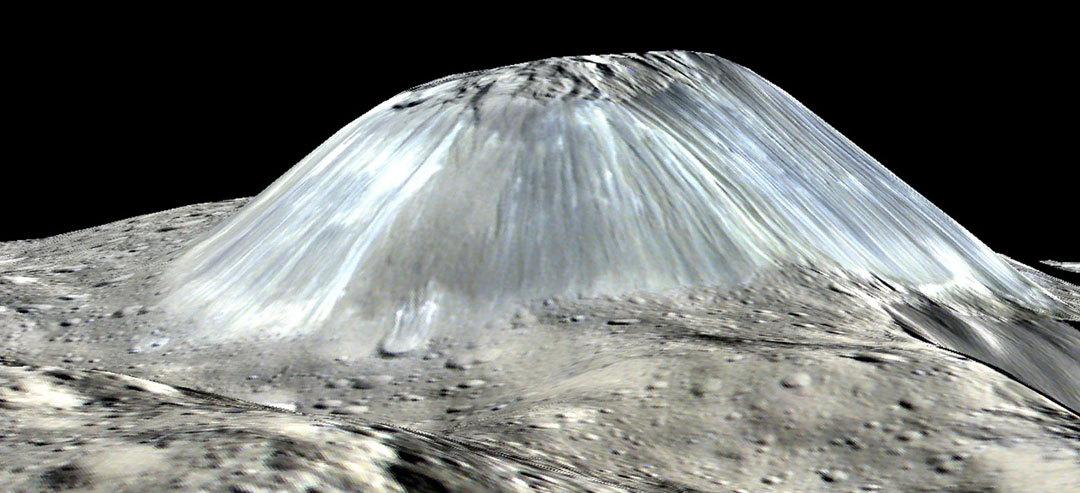
Ahuna Mons towers over the Cerean landscape in this photo taken by the Dawn spacecraft. Credit: NASA/JPL-Caltech/UCLA/MPS/DLR/IDA/PSI
Whoa – what a sight! Ceres’ lonely mountain, Ahuna Mons, is seen in this simulated perspective view. The elevation has been exaggerated by a factor of two. The view was made using enhanced-color images from NASA’s Dawn mission in August from an altitude of 240 miles (385 km) in August 2016. Credit: NASA/JPL-Caltech/UCLA/MPS/DLR/IDA/PSI
An isolated 3-mile-high (5 km) mountain Ahuna Mons on Ceres is likely volcanic in origin, and the dwarf planet may have a weak, temporary atmosphere. These are just two of many new insights about Ceres from NASA’s Dawn mission published this week in six papers in the journal Science.
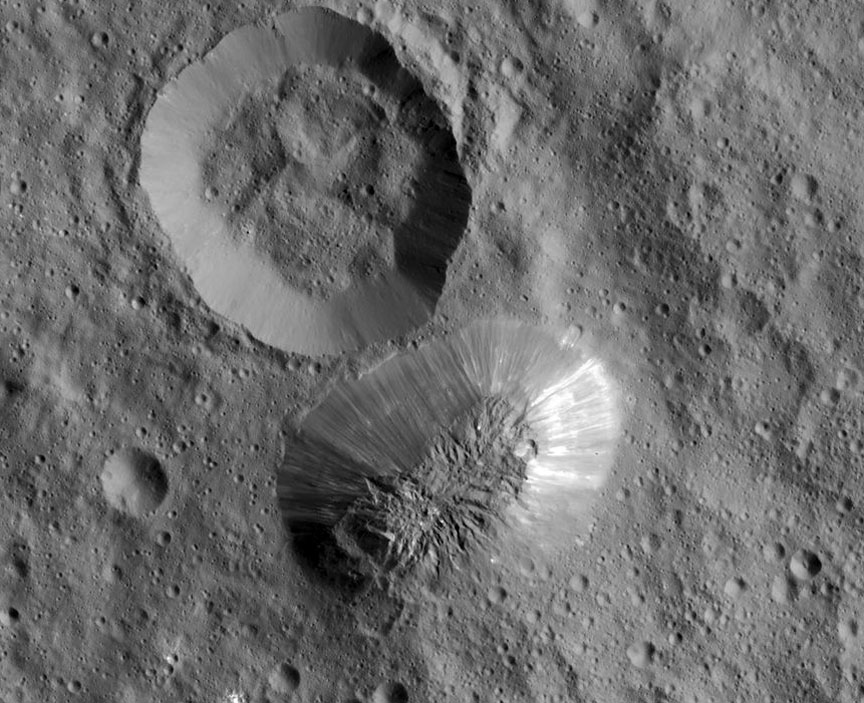
Ahuna Mons is seen in this mosaic of images from NASA’s Dawn spacecraft. On its steepest side, this mountain is about 3 miles (5 km) high. Its average overall height is 2.5 miles (4 km). The diameter of the mountain is about 12 miles (20 km). Dawn took these images from its low-altitude mapping orbit, 240 miles (385 kilometers) above the surface, in December 2015. Credits: NASA/JPL/Dawn mission
“Dawn has revealed that Ceres is a diverse world that clearly had geological activity in its recent past,” said Chris Russell, principal investigator of the Dawn mission, based at the University of California, Los Angeles.
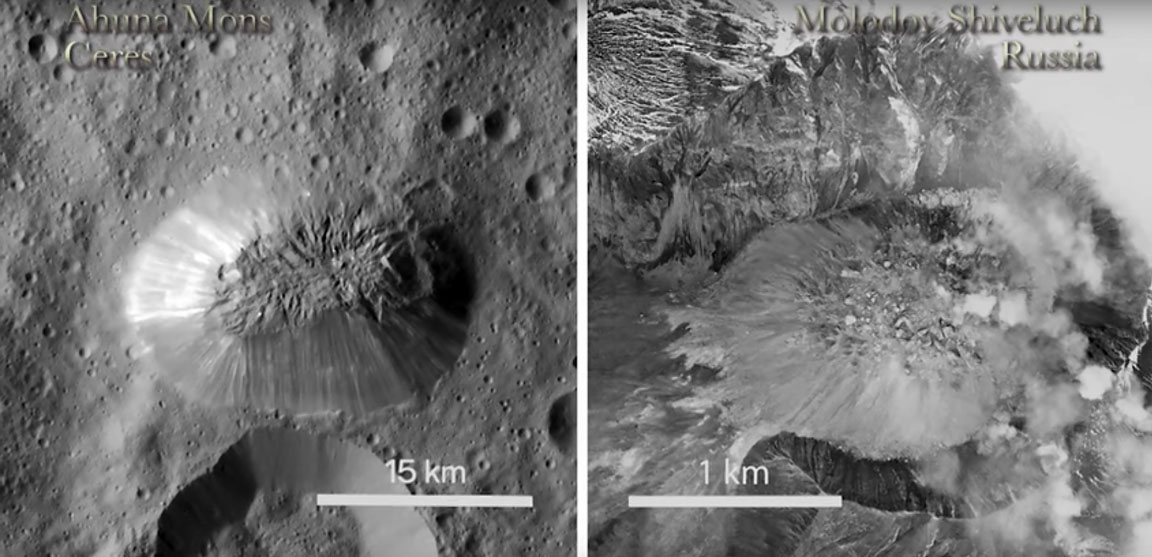
The Ahuna Mons dome compared to a dome in Russia. The similarity in appearance is striking though the difference in size is large. Credit: NASA
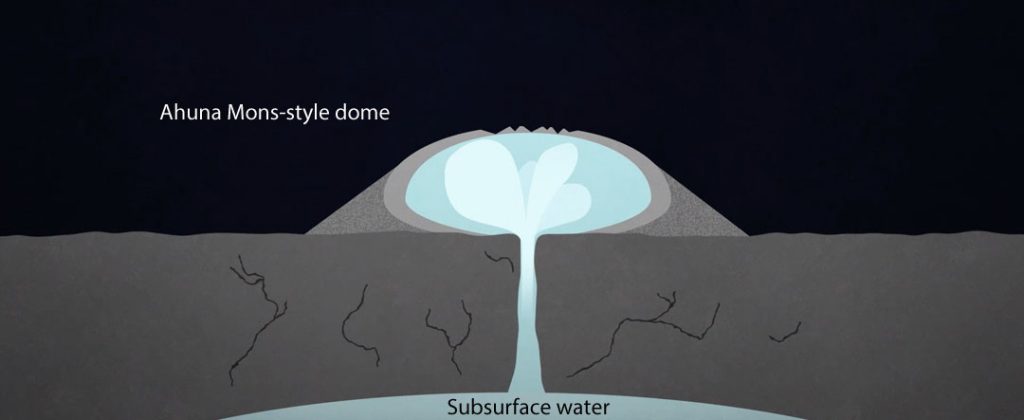
Ahuna Mons is a volcanic dome similar to earthly and lunar volcanic domes but unique in the solar system, according to a new analysis led by Ottaviano Ruesch of NASA’s Goddard Space Flight Center and the Universities Space Research Association. While those on Earth erupt with molten rock, Ceres’ grandest peak likely formed as a salty-mud volcano. Instead of molten rock, salty-mud volcanoes, or “cryovolcanoes,” release frigid, salty water sometimes mixed with mud.
Learn more about Ahuna Mons
“This is the only known example of a cryovolcano that potentially formed from a salty mud mix, and that formed in the geologically recent past,” Ruesch said. Estimates place the mountain formation within the past billion years.
Dawn may also have detected a weak, temporary atmosphere; the probe’s gamma ray and neutron (GRaND) detector observed evidence that Ceres had accelerated electrons from the solar wind to very high energies over a period of about six days. In theory, the interaction between the solar wind’s energetic particles and atmospheric molecules could explain the GRaND observations.
Dwarf planet Ceres is located in the asteroid belt, between the orbits of Mars and Jupiter. Observations by ESA’s Herschel Space Observatory between 2011 and 2013 found that the dwarf planet has a thin water-vapor atmosphere, the first detection ever of water vapor around an asteroid in the asteroid belt. Copyright ESA/ATG medialab/Küppers et al.
A temporary atmosphere would confirm the water vapor the Herschel Space Observatory detected at Ceres in 2012-2013. The electrons that GRaND detected could have been produced by the solar wind hitting the water molecules that Herschel observed, but scientists are also looking into alternative explanations.
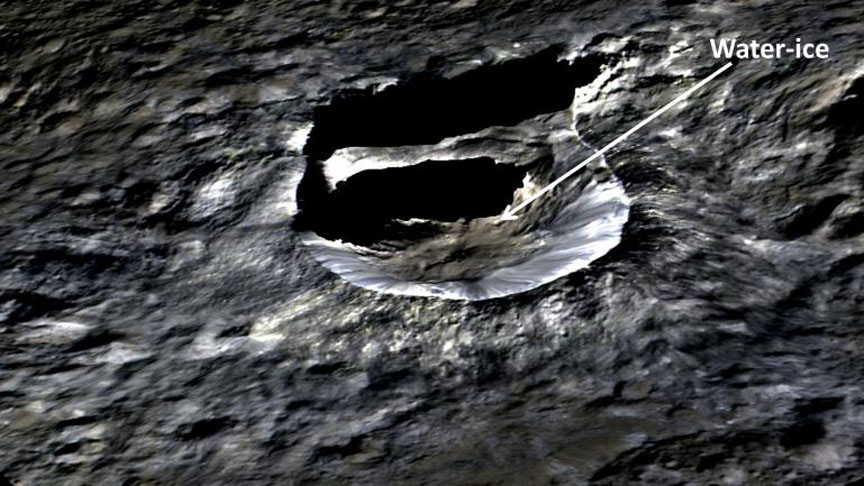
While Ahuna Mons may have erupted liquid water in the not-too-distant past, Dawn found probable water ice right now in the mid-latitude Oxo Crater using its visible and infrared mapping spectrometer (VIR).
The small, bright crater Oxo (6 miles / 10 km wide) on Ceres is seen in this perspective view. The elevation has been exaggerated by a factor of two. The view was made using enhanced-color images from NASA’s Dawn mission. Dawn’s visible and infrared mapping spectrometer (VIR) has found evidence of water ice at this crater. Credit: NASA/JPL-Caltech/UCLA/MPS/DLR/IDA
Exposed water-ice is rare on the dwarf planet, but the low density of Ceres — 2.08 grams/cm3 vs. 5.5 for Earth — the impact-generated ice detection and the the existence of Ahuna Mons suggest that Ceres’ crust does contain a significant amount of water ice.
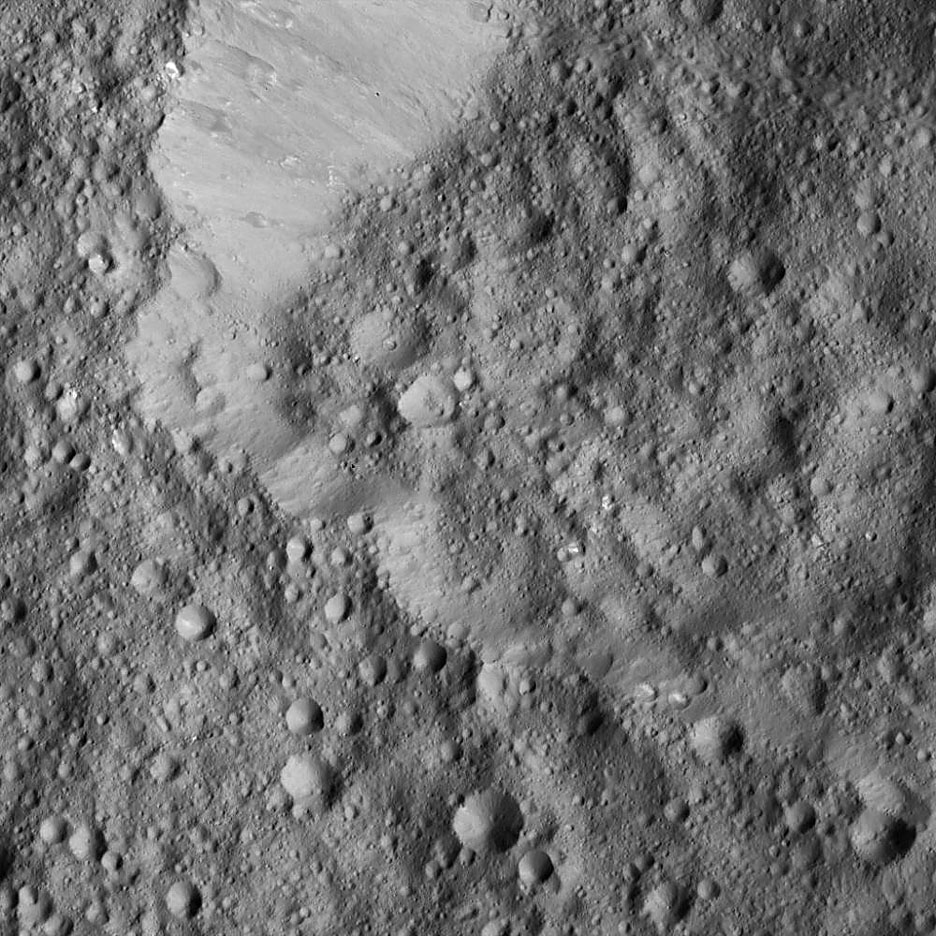
Impact craters are clearly the most abundant geological feature on Ceres, and their different shapes help tell the complex story of Ceres’ past. Craters that are roughly polygonal — shapes bounded by straight lines — hint that Ceres’ crust is heavily fractured. In addition, several Cerean craters display fractures on their floors. There are craters with flow-like features. Bright areas are peppered across Ceres, with the most reflective ones in Occator Crater. Some crater shapes could indicate water-ice in the subsurface.
In this illustration, a mud slurry rises up through Ceres’ crust to build a dome like Ahuna Mons. Click to see the animation. Credit: Goddard Media Studios
All these crater forms imply an outer shell for Ceres that is not purely ice or rock, but rather a mixture of both. Scientists also calculated the ratio of various craters’ depths to diameters, and found that some amount of crater relaxation must have occurred as icy walls gradually slump.
“The uneven distribution of craters indicates that the crust is not uniform, and that Ceres has gone through a complex geological evolution,” Hiesinger said.
The rim of Hamori Crater on Ceres is seen in the upper left portion of this image, which was taken by NASA’s Dawn spacecraft. Clay is found at many locations on the dwarf planet. Credit: NASA/JPL-Caltech/UCLA/MPS/DLR/IDA
Ceres’ crust also appears loaded with clay-forming minerals called phyllosilicates. These phyllosilicates are rich in magnesium and also have some ammonium embedded in their crystalline structure. Their distribution throughout the dwarf planet’s crust indicates Ceres’ surface material has been altered by a global process involving water.
Now in its extended mission, the Dawn spacecraft has been increasing its altitude since Sept. 2 as scientists stand back once again for a broader look at Ceres under different lighting conditions now compared to earlier in the mission.
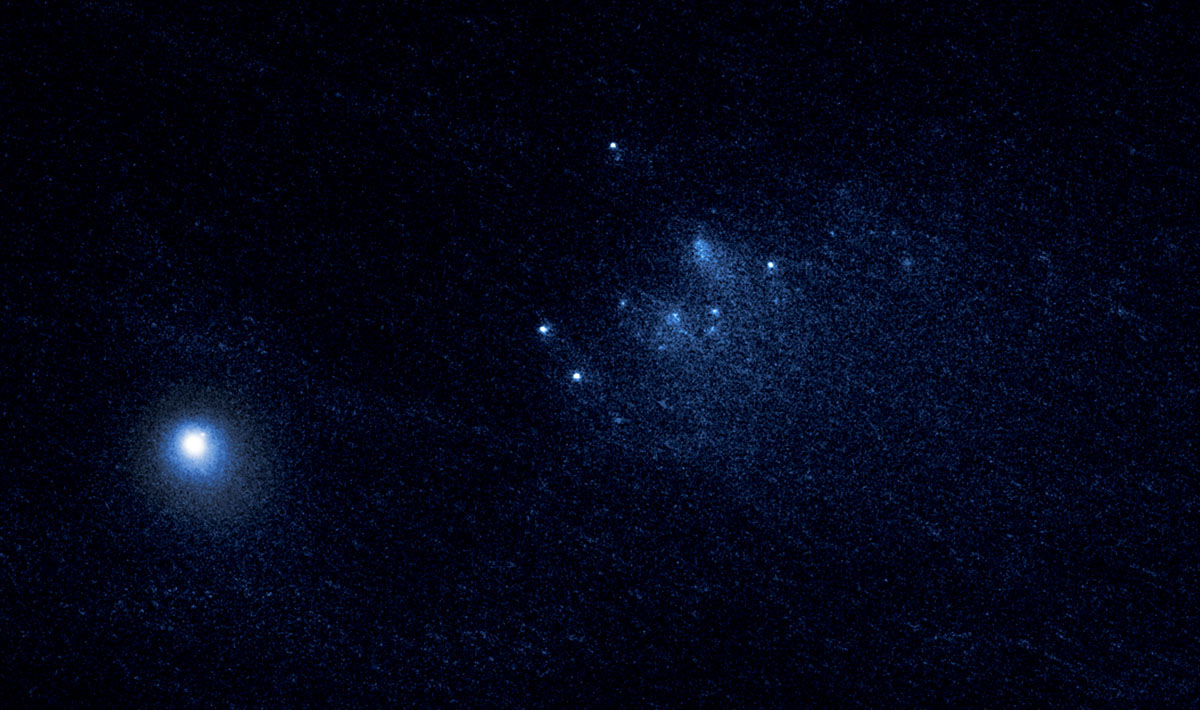
Comet 332P breakup. Credit: NASA, ESA, and D. Jewitt (UCLA)
This Hubble Space Telescope image reveals the ancient Comet 332P/Ikeya-Murakami disintegrating as it approaches the sun. The comet debris consists of a cluster of building-size chunks near the center of the image. They form a trail larger than the width of the continental U.S. The fragments are drifting away from the comet at a leisurely pace of just a few miles an hour. The main nucleus of Comet 332P is the bright object at lower left. It measures 1,600 feet across, about the length of five football fields. Credit: NASA, ESA, and D. Jewitt (UCLA)
Breaking up isn’t hard to do if you’re a comet. They’re fragile creatures subject to splitting, cracking and vaporizing when heated by the Sun and yanked on by its powerful gravitational pull.
Recently, the Hubble Space Telescope captured one of the sharpest, most detailed observations of a comet breaking apart, which occurred 67 million miles from Earth. In a series of images taken over a three-day span in January 2016, Hubble revealed 25 building-size blocks made of a mixture of ice and dust that are drifting away from the main nucleus of the periodic comet 332P/Ikeya-Murakami at a leisurely pace, about the walking speed of an adult.
This animation shows the movement of individual comet fragments relative to the parent nucleus, the bright object at lower left, on January 26, 27 and 28 UT. The true motions are very slow, on the order of several miles an hour, and show a fan-like divergence from the parent. Look closely and you’ll see that some of the fragments change in brightness and even shape from day to day. Researcher David Jewitt thinks this is due to continuing outgassing, rotation and breakup of the fragments. Credit: NASA, ESA, and D. Jewitt (UCLA)
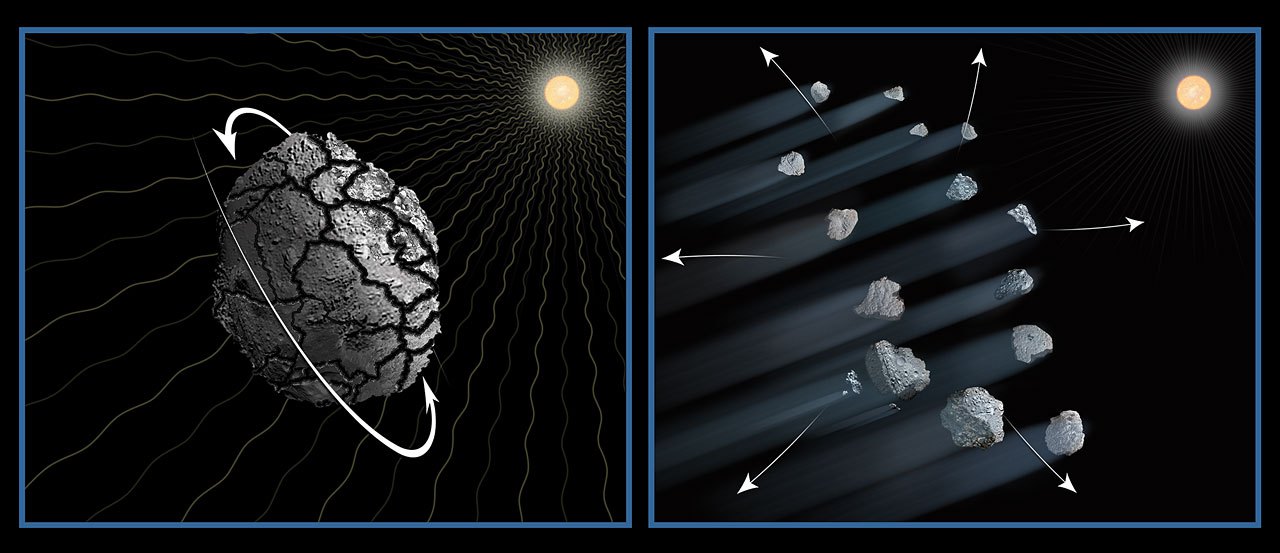
The observations suggest that the comet may be spinning so fast that material is ejected from its surface. The resulting debris is now scattered along a 3,000-mile-long trail, larger than the width of the continental U.S. Much the same happens with small asteroids, when sunlight absorbed unequally across an asteroid’s surface spins up its rotation rate, either causing it to fall apart or fling hunks of itself into space.
Being made of loosely bound frothy ice, comets may be even more volatile compared to the dense rocky composition of many asteroids. The research team suggests that sunlight heated up the comet, causing jets of gas and dust to erupt from its surface. We see this all the time in comets in dramatic images taken by the Rosetta spacecraft of Comet 67P/Churyumov-Gerasimenko. Because the nucleus is so small, these jets act like rocket engines, spinning up the comet’s rotation. The faster spin rate loosened chunks of material, which are drifting off into space.
Comet 168P/Hergenrother was photographed by the Gemini telescope on Nov. 2, 2012 and shows three fragments that broke away from the nucleus streaming from the coma down the tail. Credit: NASA/JPL-Caltech/Gemini
“We know that comets sometimes disintegrate, but we don’t know much about why or how they come apart,” explained lead researcher David Jewitt of the University of California at Los Angeles. “The trouble is that it happens quickly and without warning, and so we don’t have much chance to get useful data. With Hubble’s fantastic resolution, not only do we see really tiny, faint bits of the comet, but we can watch them change from day to day. And that has allowed us to make the best measurements ever obtained on such an object.”
In the animation you can see the comet splinters brighten and fade as icy patches on their surfaces rotate in and out of sunlight. Their shapes even change! Being made of ice and crumbly as a peanut butter cookie, they continue to break apart to spawn a host of smaller cometary bits. The icy relics comprise about 4% of the parent comet and range in size from roughly 65 feet wide to 200 feet wide (20-60 meters). They are moving away from each other at a few miles per hour.
The European Space Agency’s Rosetta probe photographed this big crack in the neck region of the double-lobed comer 67P. It’s several feet wide and about 700 feet long. Could it be an indicator that the comet will break into two in the future? Credit: ESA/Rosetta
Comet 332P was slightly beyond the orbit of Mars when Hubble spotted the breakup. The surviving bright nucleus completes a rotation every 2-4 hours, about four times as fast as Comet 67P/Churyumov-Gerasimenko (a.k.a. “Rosetta’s Comet”). Standing on its surface you’d see the sun rise and set in about an hour, akin to how frequently astronauts aboard the International Space Station see sunsets and sunrises orbiting at over 17,000 mph.
Don’t jump for joy though. Since the comet’s just 1,600 feet (488 meters) across, its gravitational powers are too meek to allow visitors the freedom of hopping about lest they find themselves hovering helplessly in space above the icy nucleus.
This illustration shows one possible explanation for the disintegration of asteroids and comets. The effects of sunlight can cause an asteroid to slowly increase its rotation rate until the loosely bound fragments drift apart due to centrifugal forces. In the case of comets, jets of vaporizing ice have a rocket-like effect that can spin up a nucleus to speeds fast enough for the comet to eject pieces of itself. Credit: NASA, ESA, D. Jewitt (UCLA), and A. Feild (STScI)
Comet 332P was discovered in November 2010, after it surged in brightness and was spotted by two Japanese amateur astronomers, Kaoru Ikeya and Shigeki Murakami. Based on the Hubble data, the team calculated that the comet probably began shedding material between October and December 2015. From the rapid changes seen in the shards over the three days captured in the animation, they probably won’t be around for long.
Spectacular breakup of Comet 73P in 2006
More changes may be in the works. Hubble’s sharp vision also spied a chunk of material close to the comet, which may be the first salvo of another outburst. The remnant from still another flare-up, which may have occurred in 2012, is also visible. The fragment may be as large as Comet 332P, suggesting the comet split in two.
“In the past, astronomers thought that comets die when they are warmed by sunlight, causing their ices to simply vaporize away,” Jewitt said. “Either nothing would be left over or there would be a dead hulk of material where an active comet used to be. But it’s starting to look like fragmentation may be more important. In Comet 332P we may be seeing a comet fragmenting itself into oblivion.”
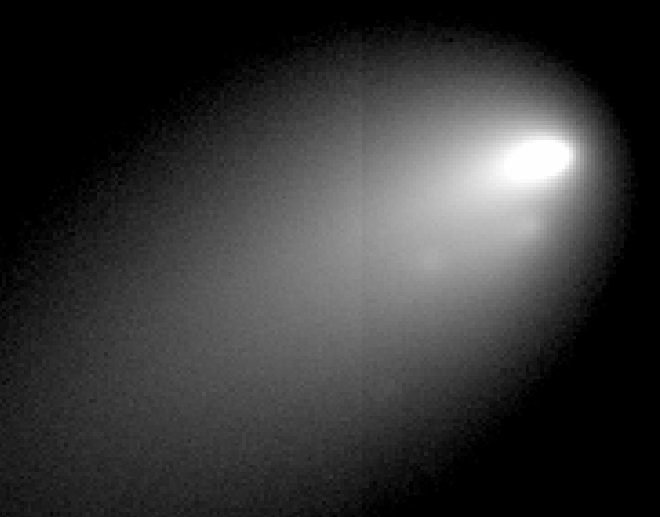
During its closest approach to the Sun on November 28, 2013, Comet ISON’s nucleus broke apart and soon vaporized away, leaving little more than a ghostly head and fading tail.
Astronomers using the Hubble and other telescopes have seen breakups before, most notably in April 2006 when 73P/Schwassmann-Wachmann 3, which crumbled into more than 60 pieces. Unlike 332P, the comet wasn’t observed long enough to track the evolution of the fragments, but the images are spectacular!
The researchers estimate that Comet 332P contains enough mass to endure another 25 outbursts. “If the comet has an episode every six years, the equivalent of one orbit around the sun, then it will be gone in 150 years,” Jewitt said. “It’s the blink of an eye, astronomically speaking. The trip to the inner Solar System has doomed it.”
This annotated image shows the fragments measured by Jewitt and team and their direction of movement. Credit: NASA, ESA, and D. Jewitt (UCLA)
332P/Ikeya-Murakami hails from the Kuiper Belt, a vast swarm of icy asteroids and comets beyond Neptune. Leftover building blocks from early Solar System and stuck in a deep freeze in the Kuiper Belt, you’d think they’d be left alone to live their solitary, chilly lives but no. After nearly 4.5 billion years in this icy deep freeze, chaotic gravitational perturbations from Neptune kicked Comet 332P out of the Kuiper Belt.
As the comet traveled across the solar system, it was deflected by the planets, like a ball bouncing around in a pinball machine, until Jupiter’s gravity set its current orbit. Jewitt estimates that a comet from the Kuiper Belt gets tossed into the inner solar system every 40 to 100 years.
I wish I could tell you to grab your scope for a look, but 332P is currently fainter than 15th magnitude and located in Libra low in the southwestern sky at nightfall. Hopefully, we’ll see more images in the coming weeks and months as Jewitt and the team continue to follow the evolution of its icy scraps.
The Full Moon of August 18, 2016 rises amid cloud over a wheat field. Friday night will see the rising of the annual Harvest Moon. Credit: Alan Dyer
It’s that wonderful time of year again when the Harvest Moon teeters on the horizon at sunset. You can watch the big orange globe rise on Friday (Sept. 16) from your home or favorite open vista just as soon as the Sun goes down. Despite being one of the most common sky events, a Full Moon rise still touches our hearts and minds every time. No matter how long I live, there will never be enough of them.
Friday night’s Harvest Moon rises around sunset in the faint constellation Pisces the fish. Watch for it to come up almost due east around the time of sunset. Once the sky gets dark, look two fists above and left of the Moon for the four stars that outline the spacious asterism of Pegasus the flying horse. Stellarium
To see a moonrise, the most important information you need is the time the moon pops up for your city, which you’ll find by using this Moonrise and Moonset calculator. Once you know when our neighborly night light rises, pre-arrange a spot you can walk or drive to 10-15 minutes beforehand. The waiting is fun. Who will see it first? I’ll often expect to see the Moon at a certain point along the horizon then be surprised it’s over there.
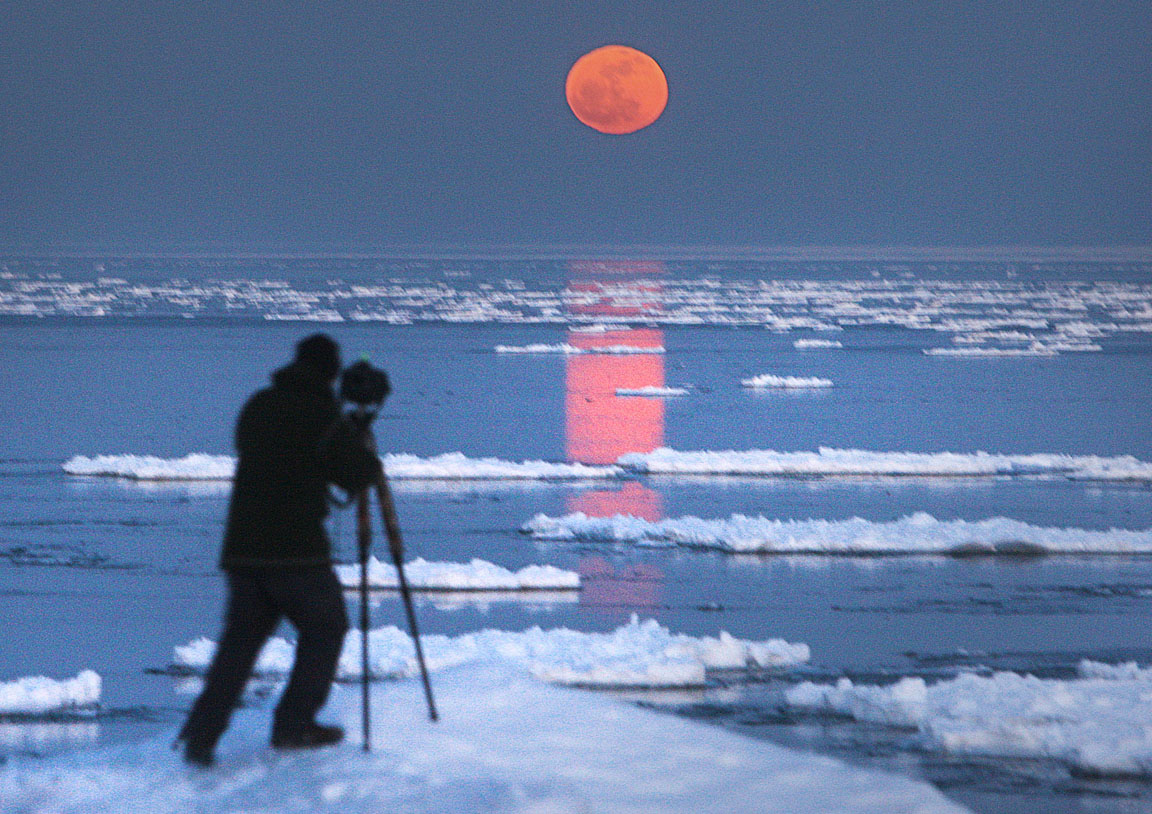
A photographer finds just the right spot in Duluth along Lake Superior to photograph a rising Full Moon. The flattened shape of the Moon is caused by the layer of denser air closer to the horizon refracting or bending the bottom half of the Moon more strongly than the thinner air along the top limb. In effect, refraction “lifts” the bottom half of the Moon upward into the top to give it a squashed appearance. Once the Moon rises high enough so we see it through much thinner (less dense) air, refraction becomes negligible and the Moon assumes its more familiar circular shape. Credit: Bob King
Depending on how low to the horizon you can see, it’s possible, especially over water, to catch the first glimpse of lunar limb breaching the horizon. This still can be a tricky feat because the Moon is pale, and when it rises, shows little contrast against the still-bright sky. Since the Moon moves about one outstretched fist to the east (left in the northern hemisphere) each night, if you wait until one night after full phase, the Moon will rise in a much darker sky and appear in more dramatic contrast against the sky background.
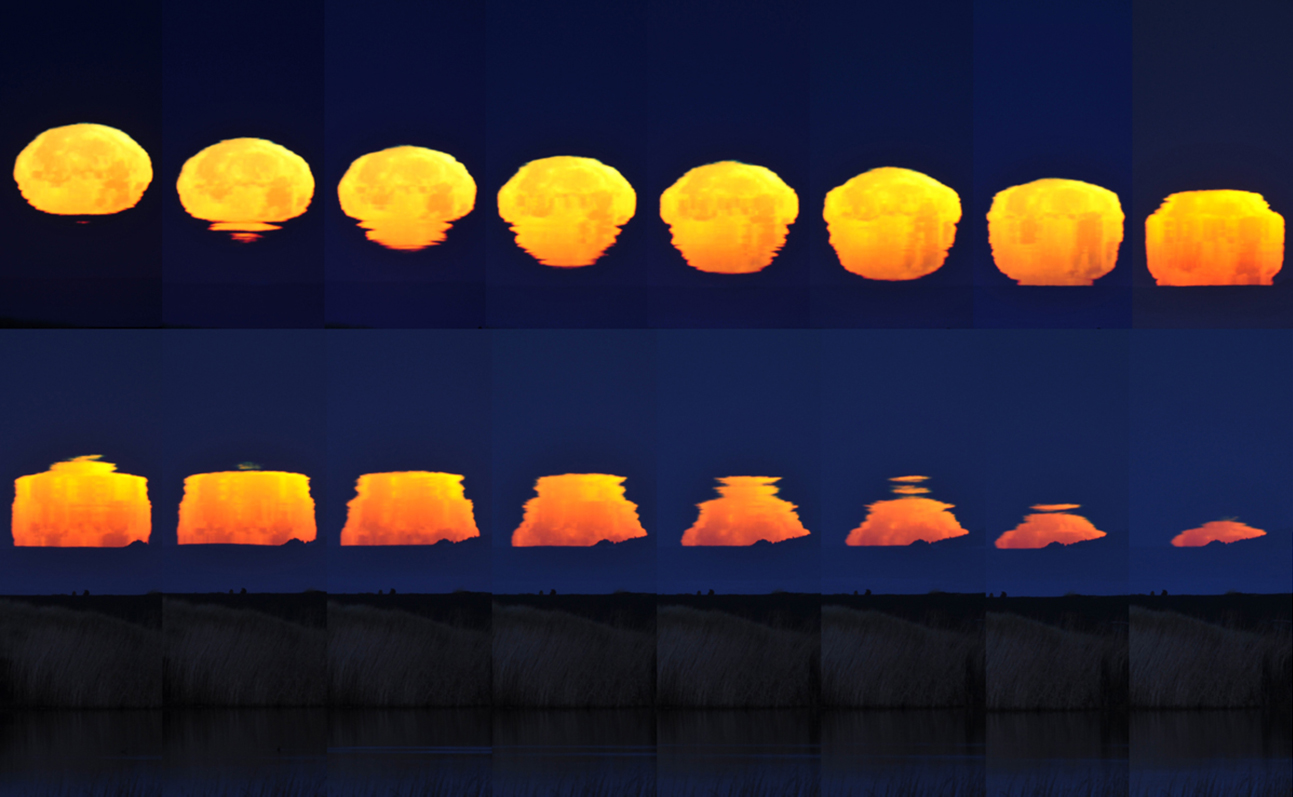
This photo sequence showing an extraordinary moonset taken from the shores of Garrison Lake in Port Orford, Oregon. “The distortion that occurred as it descended was quite remarkable — the Moon’s shape was changing as fast as I could snap a picture,” said photographer Randy Scholten. As the Moon rises, we peer through hundreds of miles of the lower atmosphere, where the air is densest and dustiest. Aerosols scatter much of the blues and greens in moonlight away, leaving orange and red. Turbulence and varying air densities along the line of sight can create all manner of distortions of the lunar disk. Credit: Randy Scholten
Look closely at the rising Moon with both naked eye and binoculars and you might just see a bit of atmospheric sorcery at work. Refraction, illustrated the icy moonrise image above, is the big one. It creates the squashed Moon shape. But more subtle things are happening that depend on how turbulent or calm the air is along your line of sight to our satellite.
Clouds add their own beauty and mystery to the rising Moon. Credit: Bob King
Rippling waves “sizzling” around the lunar circumference can be striking in binoculars though the effect is quite subtle with the naked eye. Much easier to see without any optical aid are the weird shapes the Moon can assume depending upon the state of the atmosphere. It can looked stretched out like a hot air balloon, choppy with a step-like outline around its bottom or top, square, split into two moons or even resemble a “mushroom cloud”.
If you make a point to watch moonrises regularly, you’ll become acquainted as much with Earth’s atmosphere as with the alien beauty of our sole satellite.
This Full Moon is special in at least two ways. First, it will undergo a penumbral eclipse for skywatchers across eastern Europe, Africa, Asia and Australia. Observers there should watch a dusky gray shading over the upper or northern half of the Moon around the time of maximum eclipse. The link will take you to Dave Dickinson’s excellent article that appeared earlier here at Universe Today.
The angle of the moon’s path to the horizon makes all the difference in moonrise times. At full phase in spring, the path tilts steeply southward, delaying successive moonrises by over an hour. In September, the moon’s path is nearly parallel to the horizon with successive moonrises just 20+ minutes apart. Times shown are for illustration only — so you can see the dramatic different in rise times — and don’t refer necessarily to Friday night’s moonrise. Illustration: Bob King
In the northern hemisphere, September’s Full Moon is named the Harvest Moon, defined as the Full Moon closest to the autumnal equinox, which occurs at 9:21 a.m. CDT (14:21 UT) on the 22nd. Normally, the Moon rises on average about 50 minutes later each night as it moves eastward along its orbit. But at Harvest Moon, successive moonrises are separated by a half-hour or less as viewed from mid-northern latitudes. The short gap of time between between bright risings gave farmers in the days before electricity extra light to harvest their crops, hence the name.
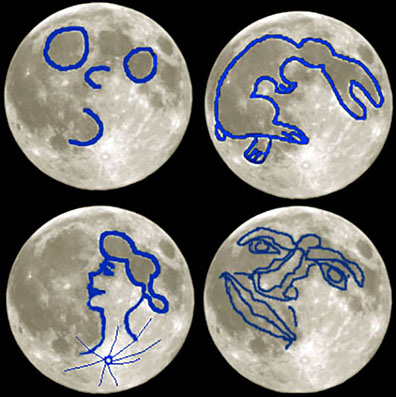
Use your imagination and you can see any of several figures in the Full Moon composed of contrasting maria and highlands.
Why the faster-than-usual moonrises? Every September, the Full Moon’s nightly travels occur at a shallow angle to the horizon; as the moon scoots eastward, it’s also moving northward this time of year as shown in the illustration above. The northern and eastward motions combine to make the Moon’s path nearly level to the horizon. For several nights in a row, it only takes a half-hour for the Earth’s rotation to carry the Moon up from below the horizon. In spring, the angle is steep because the Moon is then moving quickly southward along or near the ecliptic, the path it takes around the sky. Rising times can exceed an hour.
As you gaze at the Moon over the next several nights, take in the contrast between its ancient crust, called the lunar highlands, and the darker seas (also known as maria, pronounced MAH-ree-uh). The crust appears white because it’s rich in calcium and aluminum, while the maria are slightly more recent basaltic lava flows rich in iron, which lends them a darker tone. Thanks to these two different types of terrain it’s easy to picture a male or female face or rabbit or anything your imagination desires.


![Distribution of new impact craters (yellow dots) discovered by analyzing 14,000 NAC temporal pairs. The two red dots mark the location of the 17 March 2013 and the 11 September 2013 impacts that were recorded by Earth-based video monitoring [NASA/GSFC/Arizona State University]](https://www.universetoday.com/wp-content/uploads/2016/10/Moon-new-crater-distribution-NASA-GSFC-ASU.jpg)
![Example of a low reflectance (top) and high reflectance (bottom) splotch created either by a small impactor or more likely from secondary ejecta. In either case, the top few centimeters of the regolith (soil) was churned [NASA/GSFC/Arizona State University].](https://www.universetoday.com/wp-content/uploads/2016/10/Moon-craters-splotches-NASA.gif)