Horsehead Nebula

Horsehead Nebula

[/caption]
The Horsehead nebula is a dark nebula that looks like a horse’s head! It is part of the Orion Molecular Cloud complex, and has the more correct, if boring, name Barnard 33 (being object number 33 in a catalog of dark nebulae, by Barnard).

It is about 1500 light-years away, and is itself dark because of the dust of which it’s made (it’s also made up of gas, in fact it’s mostly gas, but the gas is essentially transparent). What makes it so obvious is the diffuse glow from behind it; the glow is red – due to the Balmer Hα line, a prominent atomic transition in hydrogen – and is powered by the UV light from the nearby star, Sigma Orionis (which is actually a five-star system), which ionizes the hydrogen gas in this part of the Orion Complex.

The first record of its shape is from 1888, by Williamina Fleming, who noticed it on a photographic plate taken at the Harvard College Observatory (Fleming made significant contributions to astronomy, including cataloguing many of the stars in the famous Henry Draper Catalogue). The Horsehead nebula is a favorite of amateur astronomers, especially astrophotographers (it’s quite difficult to spot visually).

The Horsehead nebula is similar to the Pillars of Creation (in M16), though perhaps not as dense; one day it too will be eroded by the intense UV from the young stars in its vicinity, and from new-born stars formed within it (the bright area at the top left is light from just such a star).

In 2001, the Hubble Space Telescope Institute asked the public to vote for an astronomical target for the Hubble Space Telescope to observe, a sort of Universe Idol contest … the Horsehead nebula was the clear winner! Hands up all of you who have, or have had, the Hubble’s image of the Horsehead as your wallpaper, or perhaps the VLT one

Universe Today has, among its stories, some good background on the Horsehead; for example Dark Knight Ahead – B33 by Gordon Haynes, Astrophoto: The Horsehead Nebula by Filippo Ciferri, and What’s Up This Week – Jan 3 – Jan 9, 2005.

The Astronomy Cast episode Nebulae explains the role of dark nebulae, such as the Horsehead, in starbirth; well worth a listen.

Sources: NASA APOD, Wikipedia

Angular Motion

You watch something (some distance from you) move … its direction changes … that’s angular motion. In other words, as measured from a fixed point (or axis), the angular motion of an object is the change in direction of the line (of sight) to the object; the angle swept by the line. Notice that if the distance to the object changes but the direction doesn’t, then there is no angular motion (though there is radial motion).

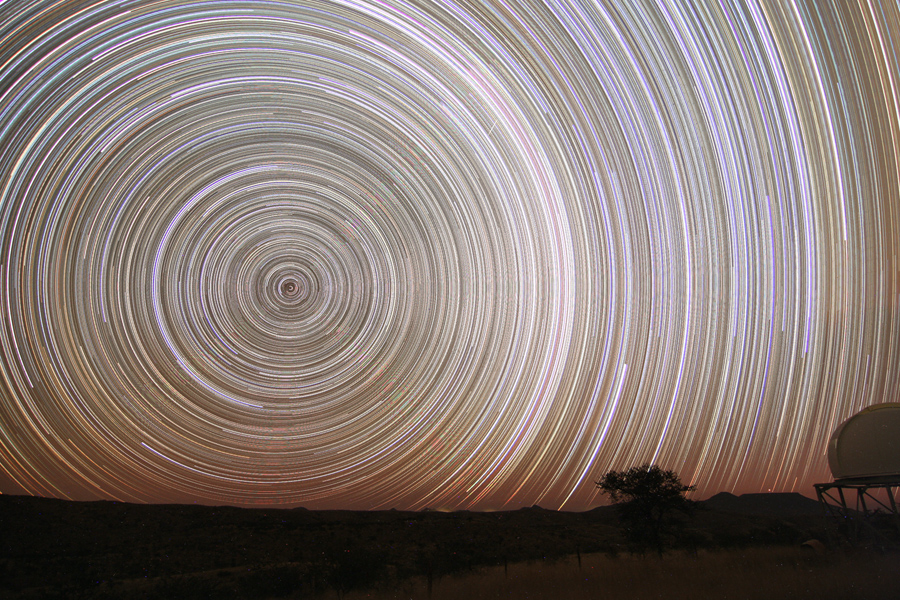
Standing on the surface of the Earth (and not moving, relative to the hills, valleys, etc), you see the Sun rise, move across the sky, and set. Ditto the Moon … and the stars, and the planets, and satellites like the ISS, and … “moving across the sky” simply means the direction of the Sun (the line from you to the Sun) changes, so that motion is angular motion.

Because it involves changes in angle, angular motion is measured in terms of degrees per second (or hour) … or radians per minute, or arcseconds per year, or … i.e. an angle per a unit of time.

Well, that’s one particular kind of angular motion, angular velocity (strictly we need to add a direction, to make it a velocity; in which way is the angle changing, due East perhaps?). There’s also angular acceleration, which is just like linear acceleration except that what the “per second per second” (or, perhaps, “per year per year”) refers to is an angle, not a length (or distance).

As the Earth turns on its axis once a day, and as a circle has 2π radians, the angular motion of the stars and the Sun is 2π rads/day, right? Well, close, but no cigar … the Earth also revolves around the Sun, so from one day to the next it has moved approximately 1/365-th of a complete circle, and as the Earth’s rotation is in the same direction as its orbit, the angular motion of the stars is a little bit less than 2π rads/day (it’s actually 2π radians per sidereal day!).

Many kinds of angular motion, in astronomy, have special names; for example, the angular motion of stars with respect to distant quasars (actually the fixed celestial coordinate system) is proper motion; the tiny ellipses (relatively) nearby stars seem to complete every year is parallax; and there’s precession, nutation, … and even the anomalous advance of the perihelion (of Mercury)! This last one is actually one component of a precession, but it played an important role in the history of physics (the first test the then new theory of general relativity passed); by the way, it’s only about 43″ (” = arcseconds) per century.

Wellesley College’s Phyllis Fleming has a 100-level concise intro to angular motion.

Some of the many Universe Today stories which involve angular motion are Globular Clusters Sort their Stars, and Does a Boomerang Work in Space?

Infrared Spectroscopy

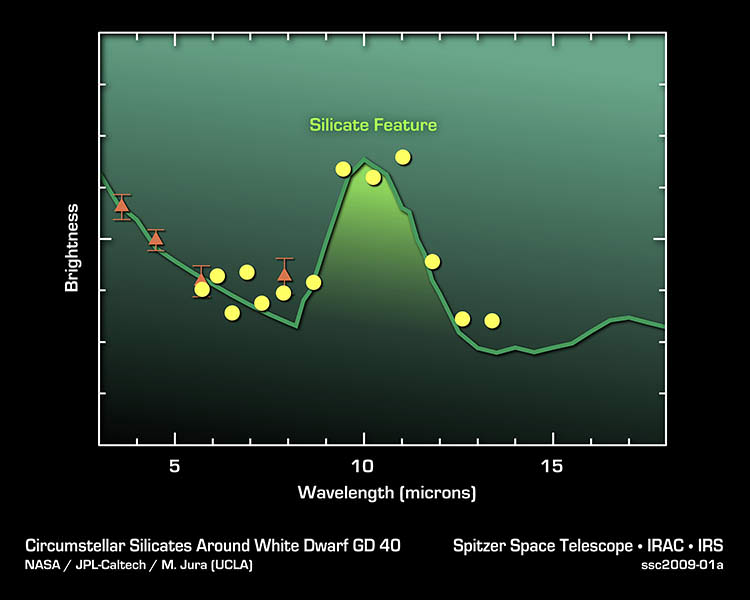
Silicates in Alien Asteroids. Credit: NASA/JPL/Caltech

[/caption]
Infrared spectroscopy is spectroscopy in the infrared (IR) region of the electromagnetic spectrum. It is a vital part of infrared astronomy, just as it is in visual, or optical, astronomy (and has been since lines were discovered in the spectrum of the Sun, in 1802, though it was a couple of decades before Fraunhofer began to study them systematically).

For the most part, the techniques used in IR spectroscopy, in astronomy, are the same or very similar to those used in the visual waveband; confusingly, then, IR spectroscopy is part of both infrared astronomy and optical astronomy! These techniques involve use of mirrors, lenses, dispersive media such as prisms or gratings, and ‘quantum’ detectors (silicon-based CCDs in the visual waveband, HgCdTe – or InSb or PbSe – arrays in IR); at the long-wavelength end – where the IR overlaps with the submillimeter or terahertz region – there are somewhat different techniques.

As infrared astronomy has a much longer ground-based history than a space-based one, the terms used relate to the windows in the Earth’s atmosphere where lower absorption spectroscopy makes astronomy feasible … so there is the near-IR (NIR), from the end of the visual (~0.7 &#181m) to ~3 &#181m, the mid (to ~30 &#181m), and the far-IR (FIR, to 0.2 mm).

As with spectroscopy in the visual and UV wavebands, IR spectroscopy in astronomy involves detection of both absorption (mostly) and emission (rather less common) lines due to atomic transitions (the hydrogen Paschen, Brackett, Pfund, and Humphreys series are all in the IR, mostly NIR). However, lines and bands due to molecules are found in the spectra of nearly all objects, across the entire IR … and the reason why space-based observatories are needed to study water and carbon dioxide (to take just two examples) in astronomical objects. One of the most important class of molecules (of interest to astronomers) is PAHs – polycyclic aromatic hydrocarbons – whose transitions are most prominent in the mid-IR (see the Spitzer webpage Understanding Polycyclic Aromatic Hydrocarbons for more details).

Looking for more info on how astronomers do IR spectroscopy? Caltech has a brief introduction to IR spectroscopy. The ESO’s Very Large Telescope (VLT) has several dedicated instruments, including VISIR (which is both an imager and spectrometer, working in the mid-IR); CIRPASS, a NIR integrated field unit spectrograph on Gemini; Spitzer’s IRS (a mid-IR spectrograph); and LWS on the ESA’s Infrared Space Observatory (a FIR spectrometer).

Universe Today stories related to IR spectroscopy include Infrared Sensor Could Be Useful on Earth Too, Search for Origins Programs Shortlisted, and Jovian Moon Was Probably Captured.

Infrared spectroscopy is covered in the Astronomy Cast episode Infrared Astronomy.

Sources:
http://en.wikipedia.org/wiki/Infrared_spectroscopy
http://www2.chemistry.msu.edu/faculty/reusch/VirtTxtJml/Spectrpy/InfraRed/infrared.htm
http://www.chem.ucla.edu/~webspectra/irintro.html

Gravity Constant

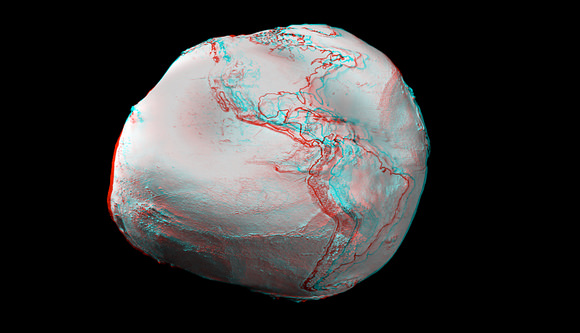
Anaglyph images created from an ESA video animation of global gravity gradients. A more accurate global map will be generated by ESA's GOCE craft. Credit: ESA and Nathaniel Burton Bradford.

[/caption]
The constant of gravity, or gravity constant, has two meanings: the constant in Newton’s universal law of gravitation (so is commonly called the gravitational constant, it also occurs in Einstein’s general theory of relativity); and the acceleration due to gravity at the Earth’s surface. The symbol for the first is G (big G), and the second g (little g).

Newton’s universal law of gravitation in words is something like “the gravitational force between two objects is proportional to the mass of each and inversely proportional to the square of the distance between them“. Or something like F (the gravitational force between two objects) is m1 (the mass of one of the objects) times m2 (the mass of one of the other object) divided by r2 (the square of the distance between them). The “is proportional to” means all you need to make an equation is a constant … which is G.

In other words: F = Gm1m2/r2

The equation for little g is simpler; from Newton we have F = ma (a force F acting on a mass m produces an acceleration a), so the force F on a mass m at the surface of the Earth, due to the gravitational attraction between the m and the Earth is F = mg.

Little g has been known from at least the time of Galileo, and is approximately 9.8 m/s2 – meters per second squared – it varies somewhat, depending on how high you are (altitude) and where on Earth you are (principally latitude).

Obviously, big G and little g are closely related; the force on a mass m at the surface of the Earth is both mg and GmM/r2, where M is the mass of the Earth and r is its radius (in Newton’s law of universal gravitation, the distance is measured between the centers of mass of each object) … so g is just GM/r2.

The radius of the Earth has been known for a very long time – the ancient Greeks had worked it out (albeit not very accurately!) – but the mass of the Earth was essentially unknown until Newton described gravity … and even afterwards too, because neither G nor M could be estimated independently! And that didn’t change until well after Newton’s death (in 1727), when Cavendish ‘weighed the Earth’ using a torsion balance and two pairs of lead spheres, in 1798.

Big G is extremely hard to measure accurately (to 1 part in a thousand, say); today’s best estimate is 6.674 28 (+/- 0.000 67) x 10-11 m3 kg-1 s -2.

The Constant Pull of Gravity: How Does It Work? is a good NASA webpage for students, on gravity; and the ESA’s GOCE mission webpage describes how satellites are being used to measure variations in little g (GOCE stands for Gravity field and steady-state Ocean Circulation Explorer).

The Pioneer Anomaly: A Deviation from Einstein’s Gravity? is a Universe Today story related to big G, as is Is the Kuiper Belt Slowing the Pioneer Spacecraft?; GOCE Satellite Begins Mapping Earth’s Gravity in Lower Orbit Than Expected is one about little g.

No surprise that the Astronomy Cast episode Gravity covers both big G and little g!

What is the Aurora Australis?

Aurora Australis over the elevated station at Amundsen-Scott South Pole Station, Antarctica. Credit: Calee Allen, National Science Foundation

Aurora australis (also known as the southern lights, and southern polar lights) is the southern hemisphere counterpart to the aurora borealis. In the sky, an aurora australis takes the shape of a curtain of light, or a sheet, or a diffuse glow; it most often is green, sometimes red, and occasionally other colors too.

Like its northern sibling, the aurora australis is strongest in an oval centered on the south magnetic pole. This is because they are the result of collisions between energetic electrons (sometimes also protons) and atoms and molecules in the upper atmosphere … and the electrons get their high energies by being accelerated by solar wind magnetic fields and the Earth’s magnetic field (the motions are complicated, but essentially the electrons spiral around the Earth’s magnetic field lines and ‘touch down’ near to where those lines become vertical).

So by far the best place to see aurorae in the southern hemisphere is Antarctica! Oh, and at night too. When the solar cycle is near its maximum, aurora australis are sometimes visible in New Zealand (especially the South Island), southern Australia (especially Tasmania), and southern Chile and Argentina (sometimes in South Africa too).

About the colors: the physics is similar to what make a flame orange-yellow when salt is added to it (i.e. specific atomic transitions in sodium atoms); green and red come from atomic oxygen; nitrogen ions and molecules make some pinkish-reds and blue-violet; and so on.

How high are aurorae? Typically 100 to 300 km (this is where green is usually seen, with red at the top), but sometimes as high as 500 km, and as low as 80 km (this requires particularly energetic particles, to penetrate so deep; if you see purple, the aurora is likely to be this low).

There’s a good aurora FAQ at this University of Alaska Fairbanks’ Geophysical Institute site (though it, naturally, concentrates on the borealis!).

Aurorae on other planets? Well, as there are strong magnetic fields plus (not so strong) solar wind plus (really deep) atmosphere on Jupiter and Saturn, they have spectacular aurorae, in rings around their magnetic poles (which are closer to their rotation poles than Earth’s are). Aurorae have also been imaged on Venus, Mars, Uranus, Neptune, and even Io (atmosphere? solar wind? magnetic fields? sure, but very different than on planets).

Some Universe Today stories on aurorae: Aurora Australis at the South Pole, Aurora Reports from Around the World, Northern & Southern Aurorae Are Siblings, But Not Twins, Chandra Looks at the Earth’s Aurora, First Aurora Seen on Mars, and Saturn’s “Dualing” Aurorae.

Exoplanet

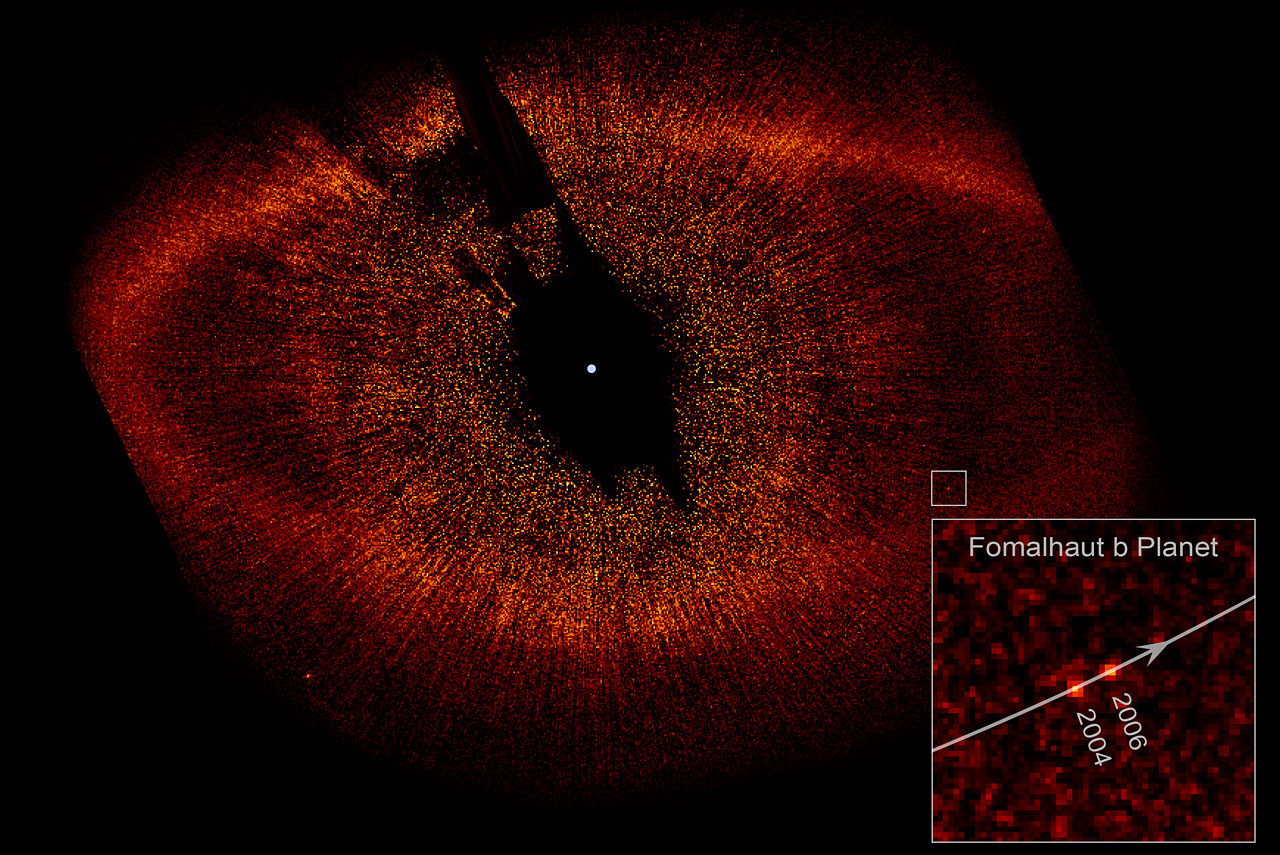
Hubble's view showing a possible exoplanet Fomalhaut b (NASA/HST)

[/caption]
An exoplanet – or extrasolar planet – is a planet which orbits a star other than our own Sun.

After a bit of a false start – lasting many decades! – when a small number of detections of planets around other stars were reported but not confirmed, the first reliable, independently confirmed exoplanet was discovered – by Campbell, Walker, and Yang – in 1988 (though solid confirmation came only in 2003), around Gamma Cephei. Between 1988 and 2003, two planets were detected, and confirmed, orbiting a pulsar (which has the catchy name of PSR 1257+12) – in 1992 – and an exoplanet was discovered, and confirmed, around the ordinary (main sequence) star 51 Pegasi (in 1995). It was this discovery that started the modern exoplanet gold rush.

There are now nearly 400 exoplanets detected and confirmed (and a few more whose status is uncertain). The Extrasolar Planets Encyclopaedia is a website which keeps track of all announcements, confirmations, etc. It also has an excellent tutorial on the methods used to discover such planets.

The first multiple system – a star with more than one exoplanet – discovered was Upsilon Andromedae (this star is actually a binary, so the discovery was a first in two ways). The first planet was discovered in 1996, and the second (and third!) in 1999. In this case independent confirmation came quite quickly. Today more than 20 such multiple-planet systems are known.

Most exoplanets have been discovered by the radial velocity, or Doppler, method: the star’s apparent speed away from (or towards) us – as measured by sensitive spectrographs – varies in a regular way, due to the gravitational pull of the exoplanet (remember that two bodies in a stable gravitational system will orbit the center of mass). Almost all have been found by ground-based telescopes. This is likely to change in the next few years as dedicated space-based telescopes – such as NASA’s Kepler and the ESA’s COROT – continue to make new discoveries. As these use the transit method (detecting tiny changes in a star’s intensity, as an exoplanet goes between it and us), the Doppler method may soon lose its ‘most exoplanets discovered’ status.

There are literally dozens of Universe Today stories on exoplanets! Here are a few, covering many different aspects: Smallest Terrestrial Exoplanet Yet Detected, Astrometry Finds an Exoplanet, Exoplanet Has Oddball Orbit, New Technique Allows Astronomers to Discover Exoplanets in Old Hubble Images, Carbon Dioxide Detected on Exoplanet HD 189733 b, and Exoplanet Image Confirmed.

There’s also a great overview of this topic in the Astronomy Cast episode A Zoo of Extrasolar Planets, and the somewhat older episode Discovering Another Earth is excellent too.

Source: Wikipedia

Deep Impact

NASA's Deep Impact probe hits Comet Tempel 1 (NASA)

[/caption]
Deep Impact is the name of a NASA space mission whose primary objective was to study Comet Tempel 1 (a.k.a. 9P/Tempel). It was launched on 12 January, 2005, and the smart impactor crashed into the comet on 4 July, 2005.

Oh, and yes, Deep Impact is also the name of a movie … but the two have no connection (the science team came up with their name independently of the Hollywood studio), other than that they both concern a comet!

Comets had been the focus of several space probes before Deep Impact, perhaps the most famous of which is the ESA’s Giotto flyby of Comet Halley. However, flybys could not, and cannot, tell us much about what’s beneath the cometary surface; in particular, what the relative amounts of ices and dust is, how porous the comet body is, and so on. The Deep Impact mission was designed to address many of these unknowns.

The space probe consisted of two parts, a 370 kg copper Smart Impactor – that smashed into the comet – and the Flyby section, which watched the impact from a safe distance. In addition, many ground-based telescopes – including those of thousands of amateurs – and some space-based ones, watched the event from an even safer distance.

The mission was a great success in that the heavy copper section did, in fact, smash into the comet, and the other section did observe the impact up-close-and-personal, but safely. A great deal was learned about this comet – its composition and mechanical strength, etc – and comets in general. However, the plume which resulted from the impact was much denser than expected, so the Flyby did not get any images of the impact crater itself.

After the encounter with Comet Tempel 1, an extended mission for the Flyby was designed and implemented, called EPOXI, after its two objectives: the Extrasolar Planet Observation and Characterization (EPOCh) and the Deep Impact Extended Investigation (DIXI) … hence Extrasolar Planet Observation and Deep Impact Extended Investigation. The former uses the larger telescope on the space probe to look for exoplanet transits; the latter is a flyby of another comet, Hartley 2, now expected on 11 October, 2010.

There are several official Deep Impact websites, including NASA’s, JPL’s (Jet Propulsion Laboratory), and the University of Maryland’s on EPOXI.

The Deep Impact mission resulted in lots of Universe Today stories, far too many to mention here. Some of the best are Deep Impact Smashes into Temple 1, What the Ground Telescopes Saw During Deep Impact, Deep Impact Turns Up Cometary Ice, and Deep Impact Begins Searching for Extrasolar Planets.

Comets, our Icy Friends from the Outer Solar System is a good Astronomy Cast episode which gives a good background on comets.

Source: NASA

What is an Event Horizon?

The Event Horizon Telescope (EHT) — a planet-scale array of eight ground-based radio telescopes forged through international collaboration — was designed to capture images of a black hole. In coordinated press conferences across the globe, EHT researchers revealed that they succeeded, unveiling the first direct visual evidence of the supermassive black hole in the centre of Messier 87 and its shadow. The shadow of a black hole seen here is the closest we can come to an image of the black hole itself, a completely dark object from which light cannot escape. The black hole’s boundary — the event horizon from which the EHT takes its name — is around 2.5 times smaller than the shadow it casts and measures just under 40 billion km across. While this may sound large, this ring is only about 40 microarcseconds across — equivalent to measuring the length of a credit card on the surface of the Moon. Although the telescopes making up the EHT are not physically connected, they are able to synchronize their recorded data with atomic clocks — hydrogen masers — which precisely time their observations. These observations were collected at a wavelength of 1.3 mm during a 2017 global campaign. Each telescope of the EHT produced enormous amounts of data – roughly 350 terabytes per day – which was stored on high-performance helium-filled hard drives. These data were flown to highly specialised supercomputers — known as correlators — at the Max Planck Institute for Radio Astronomy and MIT Haystack Observatory to be combined. They were then painstakingly converted into an image using novel computational tools developed by the collaboration. Credit: Event Horizon Telescope Collaboration

The event horizon of a black hole is the boundary (‘horizon’) between its ‘outside’ and its ‘inside’; those outside cannot know anything about things (‘events’) which happen inside.

What an event horizon is – its behavior – is described by applying the equations of Einstein’s theory of General Relativity (GR); as of today, the theoretical predictions concerning event horizons can be tested in only very limited ways. Why? Because we don’t have any black holes we can study up close and personal (so to speak) … which is perhaps a very good thing!

If the black hole is not rotating, its event horizon has the shape of a sphere; it’s like a 2D surface over a 3D ball. Except, not quite; GR is a theory about spacetime, and contains many counter-intuitive aspects. For example, if you fall freely into a black hole (one sufficiently massive that tidal forces don’t rip you to pieces and smear you into a plastic-wrap thin layer of goo, a supermassive black hole for example), you won’t notice a thing as you pass through the event horizon … and that’s because it’s not the event horizon to you! In other words, the location of the event horizon of a black hole depends upon who is doing the observing (that word ‘relativity’ really does some heavy lifting, if you’ll excuse the pun), and as you fall (freely) into a black hole, the event horizon is always ahead of you.

You’ll often read that the event horizon is where the escape velocity is c, the speed of light; that’s a not-too-bad description, but it’s better to say that the path of any ray of light, inside the event horizon, can never make it beyond that horizon.

If you watch – from afar! – something fall into a black hole, you’ll see that it gets closer and closer, and light from it gets redder and redder (increasingly redshifted), but it never actually reaches the event horizon. And that’s the closest we’ve come to testing the theoretical predictions of event horizons; we see stuff – mass ripped from the normal star in a binary, say – heading down into its massive companion, but we never see any sign of it hitting anything (like a solid surface). In the next decade or so it might be possible to study event horizons much more closely, by imaging SgrA* (the supermassive black hole – SMBH – at the center of our galaxy), or the SMBH in M87, with extremely high resolution.

The Universe Today article Black Hole Event Horizon Measured is about just this kind of black hole-normal star binary, Black Hole Flares as it Gobbles Matter is about observations of matter falling into a SMBH, and Maximizing Survival Time Inside the Event Horizon of a Black Hole describes some of the weird things about event horizons.

There’s more on event horizons in the Astronomy Cast Relativity, Relativity and More Relativity episode, and the Black Hole Surfaces one.

Sources: NASA Science, NASA Imagine the Universe

Betelgeuse

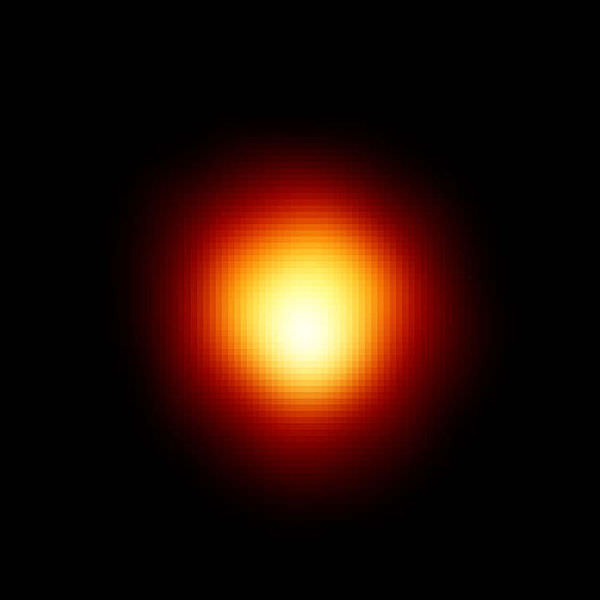
Betelgeuse. Image credit: Hubble

[/caption]
Betelgeuse is the ninth brightest star in the sky, and the second brightest in the constellation of Orion (it’s the red one, on the opposite side of the Belt from Rigel, which is the blue one, and the brightest).

With a mass of some 20 sols (= the mass of 20 Suns), Betelgeuse is evolving rapidly, even though it’s only a few million years old. It’s now a red supergiant, burning helium in a shell, and (very likely) burning carbon in another shell (closer to the nucleus), and (possibly) oxygen, silicon, and sulfur in other nested shells (like Russian dolls).

Betelgeuse is enormous … if it were where the Sun is, all four inner planets would be inside it! Because it’s so big, and is only approx 640 light-years away, Betelgeuse appears to about 1/20 of an arcsecond in size; this made it an ideal target for optical interferometry. And so it was that in 1920 Michelson and Pease used the 100″ Mt Wilson telescope, with a 20 m interferometer attached to the front, to measure Betelgeuse’s diameter.

The Hubble Space Telescope imaged Betelgeuse directly, in 1995, in the ultraviolet (see above). Why the UV? Because ground-based telescopes can’t make such observations, and because the Hubble’s resolution is greatest in the UV.

Since the 1920s Betelgeuse has been observed, from the ground, by many different optical interferometers, at many wavelengths. Its diameter varies somewhat, as does its brightness (Herschel is perhaps the first astronomer to describe its variability, in 1836). It also has ‘hotspots’, which are ginormous.

Betelgeuse is also shedding mass in giant plumes that stretch to over six times its diameter. Although these plumes will certainly cause it to ‘slim down’, they won’t be enough to stop its core turning to iron (when the silicon there is exhausted, if it hasn’t already done so). Not long afterwards, perhaps within the next thousand years or so, Betelgeuse will go supernova … making it the brightest and most spectacular supernova visible from Earth in perhaps a million years. Fortunately, because we are not looking directly down on its pole, when Betelgeuse does go bang, we won’t be fried by a gamma ray burst (GRB) which may occur (while a core collapse supernova can cause one kind of GRB, it is not yet known if all such supernovae produce GRBs; in any case, such a GRB is one of a pair of jets which rip through the poles of the dying star).

AAVSO has an excellent article on Betelgeuse, and COAST’s (Cambridge Optical Aperture Synthesis Telescope) webpage on its observations of Betelgeuse gives a good summary of one interferometric technique (and some great images too!).

Universe Today has many stories on just about every aspect of Betelgeuse, from its varying size (The Curious Case of the Shrinking Star), the bubbles it’s blowing and its plumes (Closest Ever Look at Betelgeuse Reveals its Fiery Secret), featured in What’s Up This Week, to the bow shock it creates in the interstellar medium (The Bow Shock of Betelgeuse Revealed).

Astronomy Cast’s The Life of Other Stars is a whole episode on the evolution of stars other than the Sun.

References:
http://en.wikipedia.org/wiki/Betelgeuse
http://www.solstation.com/x-objects/betelgeuse.htm

What is the Aurora Borealis?

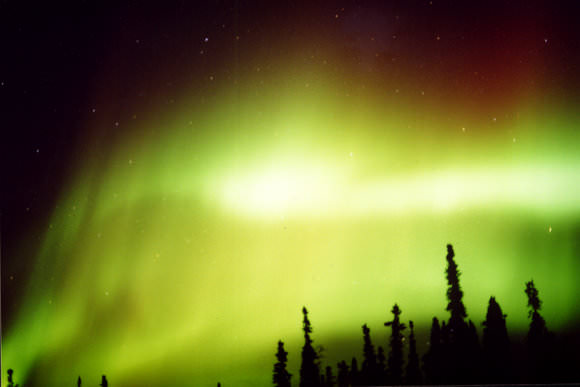
Aurora from 2002 in Poker Flats, Alaska. Credit: Dr. Scott Bounds

[/caption]
The aurora (plural aurorae) borealis has many other names: northern lights, northern polar lights, polar lights, and more. An aurora borealis is light seen in the sky, nearly always at night, in the northern hemisphere, commonly green but also red and (rarely) other colors; often in the shape of curtains, sheets, or a diffuse glow (when seen from the ground). Northern lights are most often seen at high latitudes – Alaska, Canada, northern Scandinavia, Greenland, Siberia, and Iceland – and during maxima in the solar cycle.

Aurora australis – southern lights – is the corresponding southern hemisphere phenomenon.

Seeing a bright auroral display may be on your list of ‘things to see before I die’! Yep, they are nature’s light show par excellence.

Aurora borealis occur in the Earth’s ionosphere, and result from collisions between energetic electrons (sometimes also protons, and even heavier charged particles) and atoms and molecules in the upper atmosphere. The ultimate origin of the energy which powers the aurora borealis is the Sun – via the solar wind – and the Earth’s magnetic field. Interactions between the solar wind (which carries its own tangled magnetic fields) and the Earth’s magnetic field may cause electrons (and other particles) to be trapped and accelerated; those particles which do not escape ‘downstream’ to the magnetic tail ‘touch down’ in the atmosphere, close to the north magnetic pole.

The different colors come from different atoms or ions; green and red from atomic oxygen, nitrogen ions and molecules make some pinkish-reds and blue-violet; purple is the appearance of combined colors from nitrogen ions and helium; neon produces the very rare orange. The ionosphere is home to most aurorae borealis, with 100-300 km being typical (this is where green is usually seen, with red at the top); however, some particularly energetic particles penetrate much deeper into the atmosphere, down to perhaps 80 km or lower (purple often comes from here).

Viewed from space, when the northern lights are intense they appear as a ring (an oval actually), the auroral zone, with the north magnetic pole near the center.

The University of Alaska Fairbanks’ Geophysical Institute has a good FAQ on the aurora borealis.

Magnetic fields plus solar wind … so you’d expect aurorae on Jupiter and Saturn, right? And auroral displays around the magnetic poles of these planets are now well documented. Aurorae have also been imaged on Venus, Mars, Uranus, Neptune, and even Io.

Some Universe Today stories on aurorae – borealis, australis, … and extra-terrestrial: What are the Northern Lights?, Aurora Reports from Around the World, Behind the Power and Beauty of the Northern Lights, Northern & Southern Aurorae Are Siblings, But Not Twins, Two Rockets Fly Through Auroral Arc, Chandra Looks at the Earth’s Aurora, First Aurora Seen on Mars, and Saturn’s “Dualing” Aurorae.