Hi! When I was only six (or so), I went out one clear but windy night with my uncle and peered through the eyepiece of his home-made 6" Newtonian reflector. The dazzling, shimmering, perfect globe-and-ring of Saturn entranced me, and I was hooked on astronomy, for life. Today I'm a freelance writer, and began writing for Universe Today in late 2009. Like Tammy, I do like my coffee, European strength please.
Contact me: [email protected]
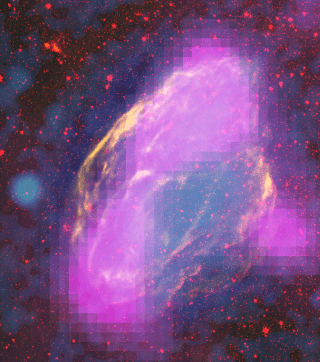
Fermi mapped GeV-gamma-ray emission regions (magenta) in the W44 supernova remnant. The features clearly align with filaments detectable in other wavelengths. This composite merges X-ray data (blue) from the Germany/U.S./UK ROSAT mission, infrared (red) from NASA’s Spitzer Space Telescope, and radio (orange) from the Very Large Array near Socorro, N.M. Credit: NASA/DOE/Fermi LAT Collaboration, NASA/ROSAT, NASA/JPL-Caltech, and NRAO/AUI
[/caption]
From the name, electron volt, you might guess that this has something to do with electricity. Well, you’d be right, it does … but did you know that the electron volt is actually a unit of energy, like the erg or joule?
The symbol for the electron volt is eV – lower case e, upper case V. Like the meter, and parsec, the electron volt can have a prefix, so lots of electron volts can be written easily, so there’s a kilo-electron volt (keV, one thousand eV), mega-electron volt (MeV, one million eV), giga-electron volt (GeV, one thousand million eV), and so on.
About the energy the electron volt represents: if you accelerate an isolated electron through an electric potential difference of one volt, it will gain one electron volt of kinetic energy. Now a volt is a joule per coulomb, so an electron volt is one electric charge times one, or approx 1.6 x 10⁻¹⁹ joules (J).
Astronomers use electron volts to measure the energy of electromagnetic radiation, or photons, in the x-ray and gamma-ray wavebands of the electromagnetic spectrum, and also use electron volts to describe the difference in atomic or molecular energy states which give rise to ultraviolet, visual, or infrared lines, or limits. So, for example, the Lyman limit – which corresponds to the energy to just ionize an atom of hydrogen – is both 91.2 nm and 13.6 eV.
Now particle physicists use the electron volt, as a unit of energy too; however, confusingly, they also use it as a unit of mass! They do this by using the famous E = mc2 equation, so 1 eV – the unit of mass – is equal to 1 eV (the unit of energy) divided by c2 (c is the speed of light). So, for example, the mass of the proton is 0.938 GeV/c2, which makes the GeV/c2 a very convenient unit (= 1.783 x 10⁻²⁷ kg). By convention, the c2 is usually dropped, and masses quoted in GeV.
Oh, and in some branches of physics, the eV is also a unit of temperature!
Would you like to read more on the electron volt? Try Energetic Particles (NASA), and How Big is an Electron Volt? (Fermilab).
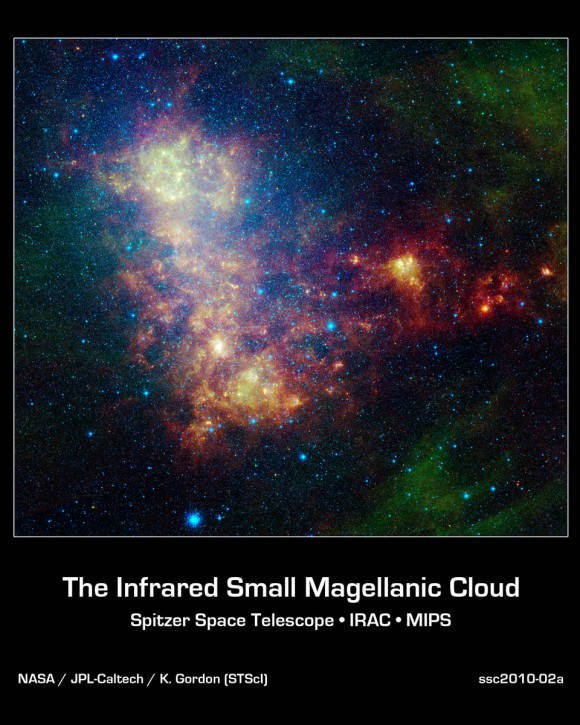
Infrared portrait of the Small Magellanic Cloud, made by NASA's Spitzer Space Telescope
At the end of the proverbial day, space-based missions like Spitzer produce millions of observations of astronomical objects, phenomena, and events. And those terabytes of data are used to test hypotheses in astrophysics which lead to a deeper understanding of the universe and our home in it, and perhaps some breakthrough whose here-on-the-ground implementation leads to a major, historic improvement in human welfare and planetary ecosystem health.
But such missions also leave more immediate legacies, in terms of the pleasure they bring millions of people, via the beauty of their images (not to mention posters, computer wallpaper and screen savers, and even inspiration for avatars).
Some recent results from one of Spitzer’s programs – SAGE-SMC – are no exception.
The image shows the main body of the Small Magellanic Cloud (SMC), which is comprised of the “bar” on the left and a “wing” extending to the right. The bar contains both old stars (in blue) and young stars lighting up their natal dust (green/red). The wing mainly contains young stars. In addition, the image contains a galactic globular cluster in the lower left (blue cluster of stars) and emission from dust in our own galaxy (green in the upper right and lower right corners).
The data in this image are being used by astronomers to study the lifecycle of dust in the entire galaxy: from the formation in stellar atmospheres, to the reservoir containing the present day interstellar medium, and the dust consumed in forming new stars. The dust being formed in old, evolved stars (blue stars with a red tinge) is measured using mid-infrared wavelengths. The present day interstellar dust is weighed by measuring the intensity and color of emission at longer infrared wavelengths. The rate at which the raw material is being consumed is determined by studying ionized gas regions and the younger stars (yellow/red extended regions). The SMC is one of very few galaxies where this type of study is possible, and the research could not be done without Spitzer.
This image was captured by Spitzer’s infrared array camera and multiband imaging photometer (blue is 3.6-micron light; green is 8.0 microns; and red is combination of 24-, 70- and 160-micron light). The blue color mainly traces old stars. The green color traces emission from organic dust grains (mainly polycyclic aromatic hydrocarbons). The red traces emission from larger, cooler dust grains.
The image was taken as part of the Spitzer Legacy program known as SAGE-SMC: Surveying the Agents of Galaxy Evolution in the Tidally-Stripped, Low Metallicity Small Magellanic Cloud.
The Small Magellanic Cloud (SMC), and its larger sister galaxy, the Large Magellanic Cloud (LMC), are named after the seafaring explorer Ferdinand Magellan, who documented them while circling the globe nearly 500 years ago. From Earth’s southern hemisphere, they can appear as wispy clouds. The SMC is the further of the pair, at 200,000 light-years away.
Recent research has shown that the galaxies may not, as previously suspected, orbit around our galaxy, the Milky Way. Instead, they are thought to be merely sailing by, destined to go their own way. Astronomers say the two galaxies, which are both less evolved than a galaxy like ours, were triggered to create bursts of new stars by gravitational interactions with the Milky Way and with each other. In fact, the LMC may eventually consume its smaller companion.
Karl Gordon, the principal investigator of the latest Spitzer observations at the Space Telescope Science Institute in Baltimore, Maryland, and his team are interested in the SMC not only because it is so close and compact, but also because it is very similar to young galaxies thought to populate the universe billions of years ago. The SMC has only one-fifth the amount of heavier elements, such as carbon, contained in the Milky Way, which means that its stars haven’t been around long enough to pump large amounts of these elements back into their environment. Such elements were necessary for life to form in our solar system.
Studies of the SMC therefore offer a glimpse into the different types of environments in which stars form.
“It’s quite the treasure trove,” said Gordon, “because this galaxy is so close and relatively large, we can study all the various stages and facets of how stars form in one environment.” He continued: “With Spitzer, we are pinpointing how to best calculate the numbers of new stars that are forming right now. Observations in the infrared give us a view into the birthplace of stars, unveiling the dust-enshrouded locations where stars have just formed.” Little Galaxy with a Tail (Small Magellanic Cloud imaged by Spitzer)
This image shows the main body of the SMC, which is comprised of the “bar” and “wing” on the left and the “tail” extending to the right. The tail contains only gas, dust and newly formed stars. Spitzer data has confirmed that the tail region was recently torn off the main body of the galaxy. Two of the tail clusters, which are still embedded in their birth clouds, can be seen as red dots.
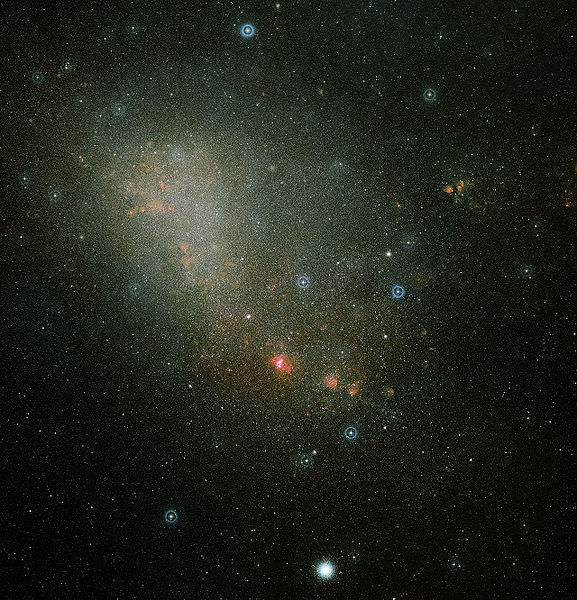
Small Magellanic Cloud. Image credit: NASA/ESA/HST
I’m trying something new, here in Universe Today, a puzzle.
This is, I hope, a puzzle that cannot be answered by five minutes spent googling, a puzzle that requires you to cudgel your brains a bit, and do some lateral thinking.
There are no prizes for the first correct answer – the judge’s decision (mine!) will be final – but I do hope that you’ll have lots of fun.
What do David, Nicholas, and Ferdinand have in common?
Post your guesses in the comments section, and check back later at this same post to find the answer. To make this puzzle fun for everyone, please don’t include links or extensive explanations with your answer, until after the answer has been given. Good luck!
Answer has now been posted below:
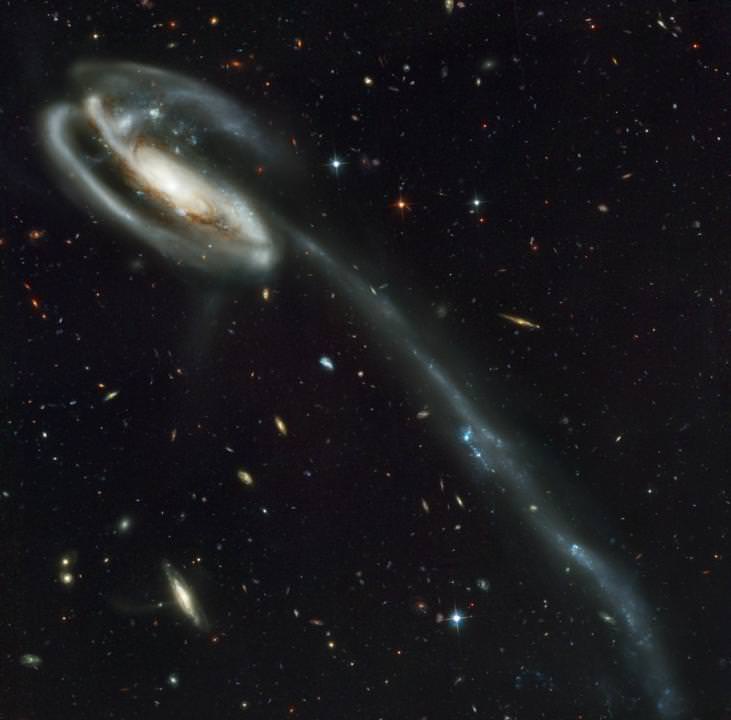
[/caption] Malin1 (Hubble Space Telescope image courtesy of Aaron Barth) Mayall's Object (Hubble Space Telescope)
David Malin (Malin I), Nicholas Mayall (Mayall’s object, or Arp 148), and Ferdinand Magellan (the Magellanic Clouds) all have galaxies named after them!
I should have said that David, Nicholas, and Ferdinand have a deep association with the topics we regularly cover here in Universe Today – astronomy, space, telescopes, etc.
Congratulations to IVAN3MAN, who guessed correctly first, and to all those who came up with equally good answers – all must have prizes.
Stay tuned for another Universe Puzzle, next week (HINT: I will pose a quite different kind of puzzle then).
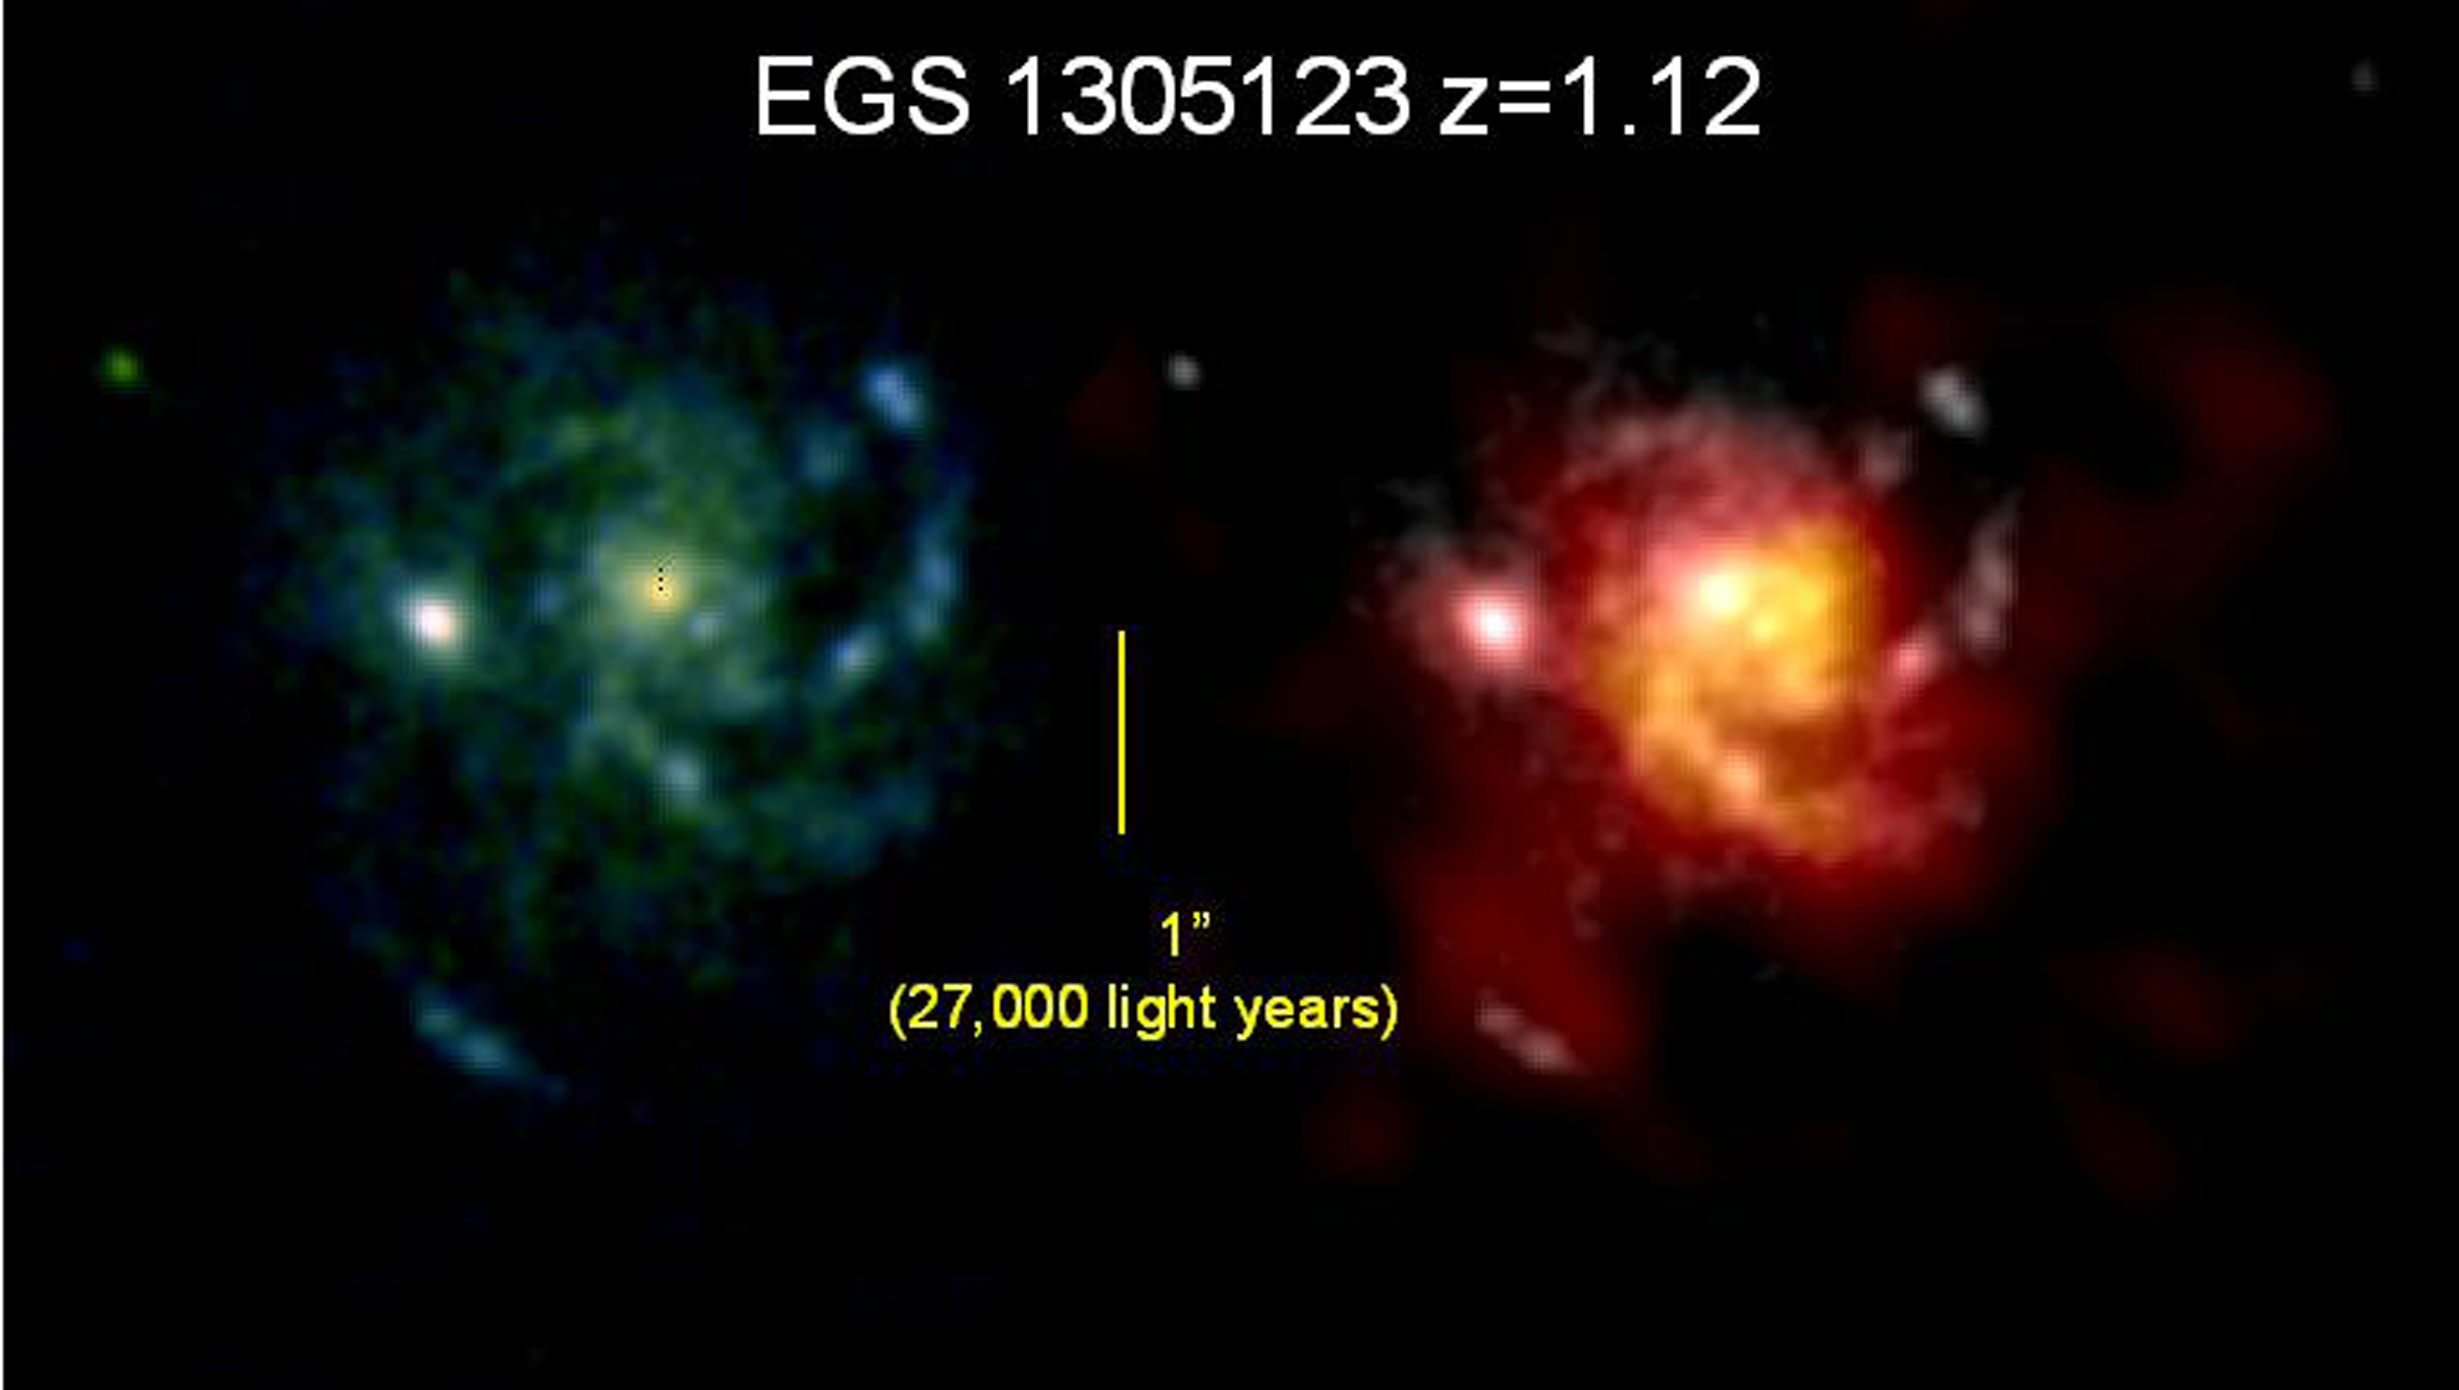
Typical massive galaxy at z=1.1 (left: V, I (Hubble); right: CO 3-2 mm emission (IRAM); copyright MPE/IRAM)
[/caption]
Galaxies long, long ago were very fecund; they gave birth to stars at a rate at least ten times what we see today.
Why? Was there more stuff around then, to make stars? Or were galaxies back then more efficient at star-making? Or something else??
Dr. Linda Tacconi, from Germany’s Max-Planck-Institut für extraterrestrische Physik, led an international team of astronomers to find out why … and the answer seems to be that young galaxies were stuffed to the gills with gas.
“We have been able, for the first time, to detect and image the cold molecular gas in normal star forming galaxies, which are representative of the typical massive galaxy populations shortly after the Big Bang,” said Dr Tacconi.
The challenging observations yield the first glimpse how galaxies, or more precisely the cold gas in these galaxies, looked a mere 3 to 5 billion years after the Big Bang (equivalent to a cosmological redshift z~2 to z~1). At this age, galaxies seem to have formed stars more or less continuously with at least ten times the rate seen in similar mass systems in the local Universe.
It is now reasonably well-established that galaxies formed from proto-galaxies, which themselves formed in local over-densities, dominated by cold dark matter – dark matter halos – where the newly neutral hydrogen and helium collected and cooled. Through collisions and mergers, and some on-going gas accretion, the proto-galaxies formed young galaxies, a few billion years after the Big Bang – in short, hierarchical formation. The Plateau de Bure millimetre interferometer in the southern French Alps. Copyright: IRAM
Detailed observations of the cold gas and its distribution and dynamics hold a key role in disentangling the complex mechanisms responsible for turning the first proto-galaxies into modern galaxies, such as the Milky-Way. A major study of distant, luminous star forming galaxies at the Plateau de Bure millimeter interferometer has now resulted in a breakthrough by having a direct look at the star formation “food”. The study took advantage of major recent advances in the sensitivity of the radiometers at the observatory to make the first systematic survey of cold gas properties (traced by a rotational line of the carbon monoxide molecule) of normal massive galaxies when the Universe was 40% (z=1.2) and 24% (z=2.3) of its current age. Previous observations were largely restricted to rare, very luminous objects, including galaxy mergers and quasars. The new study instead traces massive star forming galaxies representative of the ‘normal’, average galaxy population in this mass and redshift range.
“When we started the programme about a year ago”, says Dr. Tacconi, “we could not be sure that we would even detect anything. But the observations were successful beyond our most optimistic hopes. We have been able to demonstrate that massive normal galaxies at z~1.2 and z~2.3 had five to ten times more gas than what we see in the local Universe. Given that these galaxies were forming gas at a high rate over long periods of time, this means that gas must have been continuously replenished by accretion from the dark matter halos, in excellent agreement with recent theoretical work.”
Another important result of these observations is the first spatially resolved images of the cold gas distribution and motions in several of the galaxies. “This survey has opened the door for an entirely new avenue of studying the evolution of galaxies,” says Pierre Cox, the director of IRAM. “This is really exciting and there is much more to come.”
“These fascinating findings provide us with important clues and constraints for next-generation theoretical models that we will use to study the early phases of galaxy development in more detail,” says Andreas Burkert, specialist for star formation and the evolution of galaxies at Germany’s Excellence Cluster Universe. “Eventually these results will help to understand the origin and the development of our Milky Way.”
About the EGS 1305123 image: Spatially resolved optical and millimeter images of a typical massive galaxy at redshift z=1.1 (5.5 billion years after the Big Bang). The left image was taken with the Hubble Space Telescope in the V- and I-optical bands, as part of the AEGIS survey of distant galaxies. The right image is an overlay of the CO 3-2 emission observed with the PdBI (red/yellow colors) superposed on the I-image (grey). For the first time these observations clearly show that the molecular line emission and the optical light from massive stars trace a massive, rotating disk of diameter ~60,000 light years. This disk is similar in size and structure as seen in z~0 disk galaxies, such as the Milky Way. However, the mass of cold gas is in this disk is about an order of magnitude larger than in typical z~0 disk galaxies. This explains why high-z galaxies can form continuously at about ten times the rate of typical z~0 galaxies.
The proton has three parts, two up quarks and one down quark … and the gluons which these three quarks exchange, which is how the strong (nuclear) force works to keep them from getting out.
The proton’s world is a totally quantum one, and so it is described entirely by just a handful of numbers, characterizing its spin (a technical term, not to be confused with the everyday English word; the proton’s spin is 1/2), electric charge (+1 e, or 1.602176487(40)×10-19 C), isospin (also 1/2), and parity (+1). These properties are derived directly from those of the proton parts, the three quarks; for example, the up quark has an electric charge of +2/3 e, and the down -1/3 e, which sum to +1 e. Another example, color charge: the proton has a color charge of zero, but each of its constituent three quarks has a non-zero color charge – one is ‘blue’, one ‘red’, and one ‘green’ – which ‘sum’ to zero (of course, color charge has nothing whatsoever to do with the colors you and I see with our eyes!).
Murray Gell-Mann and George Zweig independently came up with the idea that the proton’s parts are quarks, in 1964 (though it wasn’t until several years later that good evidence for the existence of such parts was obtained). Gell-Mann was later awarded the Nobel Prize of Physics for this, and other work on fundamental particles (Zweig has yet to receive a Nobel).
The quantum theory which describes the strong interaction (or strong nuclear force) is quantum chromodynamics, QCD for short (named in part after the ‘colors’ of quarks), and this explains why the proton has the mass it does. You see, the up quark’s mass is about 2.4 MeV (mega-electron volts; particle physicists measure mass in MeV/c2), and the down’s about 4.8 MeV. Gluons, like photons, are massless, so the proton should have a mass of about 9.6 MeV (= 2 x 2.4 + 4.8), right? But it is, in fact, 938 MeV! QCD accounts for this enormous difference by the energy of the QCD vacuum inside the proton; basically, the self-energy of ceaseless interactions of quarks and gluons.
There is not one, not two, not even three gravity equations, but many!
The one most people know describes Newton’s universal law of gravitation:
F = Gm1m2/r2,
where F is the force due to gravity, between two masses (m1 and m2), which are a distance r apart; G is the gravitational constant.
From this is it straightforward to derive another, common, gravity equation, that which gives the acceleration due to gravity, g, here on the surface of the Earth:
g = GM/r2,
Where M is the mass of the Earth, r the radius of the Earth (or distance between the center of the Earth and you, standing on its surface), and G is the gravitational constant.
With its publication in the early years of the last century, Einstein’s theory of general relativity (GR) became a much more accurate theory of gravity (the theory has been tested extensively, and has passed all tests, with flying colors, to date). In GR, the gravity equation usually refers to Einstein’s field equations (EFE), which are not at all straight-forward to write, let alone explain (so I’m going to write them … but not explain them!):
G?? = 8?G/c4 T??
G (without the subscripts) is the gravitational constant, and c is the speed of light.
where a is the acceleration a star feels, due to gravity under MOND (MOdified Newtonian Dynamics), an alternative theory of gravity, M is the mass of a galaxy, r the distance between the star in the outskirts of that galaxy and its center, G the gravitational constant, and a0 a new constant.
[/caption]
Galaxy names come in a bewildering range of forms; from descriptive (e.g. Whirlpool Galaxy, Black Eye Galaxy, The Eyes), to ones that seem to relate to a constellation (e.g. Andromeda Galaxy, Hydra A, Leo I), to ones named after a person (e.g. Stephan’s Quintet, Malin I, Mayall’s Object), to letter+number combinations (e.g. the Messier catalog galaxies such as M33 and M87), to letters+number combinations (e.g. NGC 3115, DDO 185), to impossible-to-remember stings-with-dashes-dots-and-pluses like MCG-06-07-001, 4C37.11, and SDSS J002240.91+143110.4!
And sometimes a galaxy has LOTS of different names, such as M87, Virgo A, NGC 4486, Arp 152, 3C274, IRAS 12282+1240, WMAP J123051+1223 (there’s, like, about another 20!).
However, of the estimated 100 billion galaxies we could observe, with current astronomical facilities, only a few million have names, and most of those are unique (i.e. only one name per galaxy). Of course, almost all the single-name galaxies are little more than faint smudges in an optical or infrared image … and that gives a clue to where the names come from!
Most galaxy names come from the catalog, or catalogs, in which they appear. The catalogs have many sources, but most recent ones have been put together as a key output of a dedicated survey or mission, and the galaxy name reflects that. So, for example, SDSS stands for Sloan Digital Sky Survey (one of the most amazing optical/NIR galaxy surveys of all time), IRAS for InfraRed Astronomy Satellite, DDO for David Dunlap Observatory (where a catalogue of dwarf galaxies was put together), and 4C for 4th Cambridge survey (a radio survey). Some of the older catalogs, or lists, were put together from previously known galaxies, or objects (the Messier list is perhaps the most famous example).
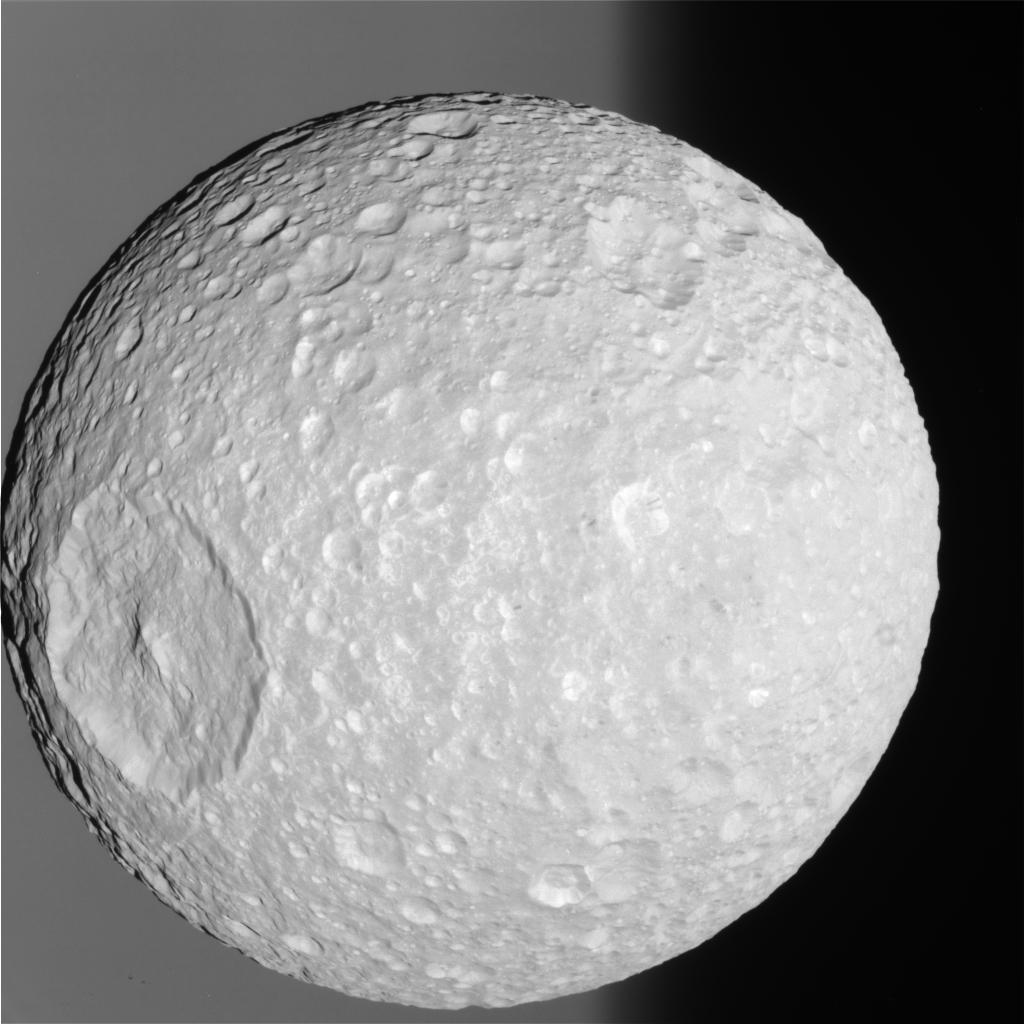
Cassini's Mimas, from 70,000 km (Credit: NASA/JPL/Space Science Institute)
[/caption]
On February 13, 2010, Cassini flew by Saturn’s moon Mimas, coming as close as 9,500 km.
It passed directly over Herschel, a giant crater whose creation almost shattered the moon … and which, in its appearance in some earlier images, earned Mimas the nickname “Death Star”, after the iconic Star Wars prop.
The Cassini team has just released some “Raw Previews” of Cassini’s close encounter; time to feast your eyes.
35,000 km-distant Herschel, from Cassini (unprocessed image; credit: NASA/JPL/Space Science Institute)
The Cassini Equinox Mission, of which the Mimas flyby is but a small part, is a joint United States and European endeavor. The Jet Propulsion Laboratory, a division of the California Institute of Technology in Pasadena, manages the mission for NASA’s Science Mission Directorate, Washington, D.C. The Cassini orbiter was designed, developed and assembled at JPL. The imaging team consists of scientists from the US, England, France, and Germany. The imaging operations center and team lead (Dr. C. Porco) are based at the Space Science Institute in Boulder, Colo. Herschel, from 16,000 km above (unprocessed image; credit: NASA/JPL/Space Science Institute)
Source: CICLOPS (Cassini Imaging Central Laboratory for Operations)
[/caption]
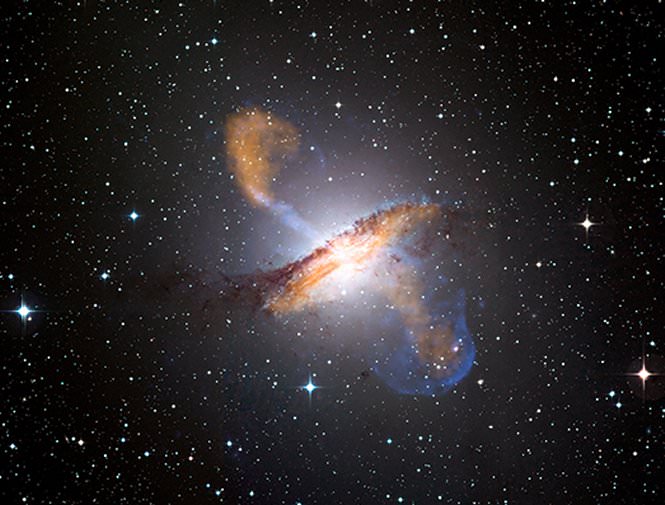
Why do some of the supermassive black holes in active galactic nuclei create back-to-back jets that can vaporize entire solar systems, while others have no jets at all?
Dan Evans, a postdoctoral researcher at MIT Kavli Institute for Astrophysics and Space Research (MKI) thinks he knows why; it’s because the jet-producing supermassive black holes are spinning backwards, relative to their accretion disks.
Radio image of a typical DRAGN, showing the main features (Image credit:C. L. Carilli)
For two years, Evans has been comparing several dozen galaxies whose black holes host powerful jets (these galaxies are known as radio-loud active galactic nuclei, or AGN, and are often DRAGNs – double radio source associated with galactic nucleus) to those galaxies with supermassive black holes that do not eject jets. All black holes – those with and without jets – feature accretion disks, the clumps of dust and gas rotating just outside the event horizon. By examining the light reflected in the accretion disk of an AGN black hole, he concluded that jets may form right outside black holes that have a retrograde spin – or which spin in the opposite direction from their accretion disk. Although Evans and a colleague recently hypothesized that the gravitational effects of black hole spin may have something to do with why some have jets, Evans now has observational results to support the theory in a paper published in the Feb. 10 issue of the Astrophysical Journal.
Although Evans has suspected for nearly five years that retrograde black holes with jets are missing the innermost portion of their accretion disk, it wasn’t until last year that computational advances meant that he could analyze data collected between late 2007 and early 2008 by the Suzaku observatory, a Japanese satellite launched in 2005 with collaboration from NASA, to provide an example to support the theory. With these data, Evans and colleagues from the Harvard-Smithsonian Center for Astrophysics, Yale University, Keele University and the University of Hertfordshire in the United Kingdom analyzed the spectra of the active galactic nucleus with a pair of jets located about 800 million light years away in an AGN named 3C 33. 1477 MHz image of 3C 33 (Credit: Leahy & Perley (1991))
“It’s the first convincing galaxy of this type seen at this angle where the result is pretty robust,” said Patrick Ogle, an assistant research scientist at the California Institute of Technology, who studies AGN. Ogle believes Evans’s theory regarding retrograde spin is among the best explanations he has heard for why some AGN contain a supermassive black hole with a jet and others don’t.
Astrophysicists can see the signatures of x-ray emission from the inner regions of the accretion disk, which is located close to the edge of a black hole, as a result of a super hot atmospheric ring called a corona that lies above the disk and emits light (electromagnetic radiation) that an observatory like Suzaku can detect. In addition to this direct light, a fraction of light passes down from the corona onto the black hole’s accretion disk and is reflected from the disk’s surface, resulting in a spectral signature pattern called the Compton reflection hump, also detected by Suzaku.
But Evans’ team never found a Compton reflection hump in the x-ray emission given off by 3C 33, a finding the researchers believe provides crucial evidence that the accretion disk for a black hole with a jet is truncated, meaning it doesn’t extend as close to the center of the black hole with a jet as it does for a black hole that does not have a jet. The absence of this innermost portion of the disk means that nothing can reflect the light from the corona, which explains why observers only see a direct spectrum of x-ray light.
The researchers believe the absence may result from retrograde spin, which pushes out the orbit of the innermost portion of accretion material as a result of general relativity, or the gravitational pull between masses. This absence creates a gap between the disk and the center of the black hole that leads to the piling of magnetic fields that provide the force to fuel a jet.
While Ogle believes that the retrograde spin theory is a good explanation for Evans’ observations, he said it is far from being confirmed, and that it will take more examples with consistent results to convince the astrophysical community.
The field of research will expand considerably in August 2011 with the planned launch of NASA’s Nuclear Spectroscopic Telescope Array (NuSTAR) satellite, which is 10 to 50 times more sensitive to spectra and the Compton reflection hump than current technology. NuSTAR will help researchers conduct a “giant census” of supermassive black holes that “will absolutely revolutionize the way we look at X-ray spectra of AGN,” Evans explained. He plans to spend another two years comparing black holes with and without jets, hoping to learn more about the properties of AGN. His goal over the next decade is to determine how the spin of a supermassive black hole evolves over time.
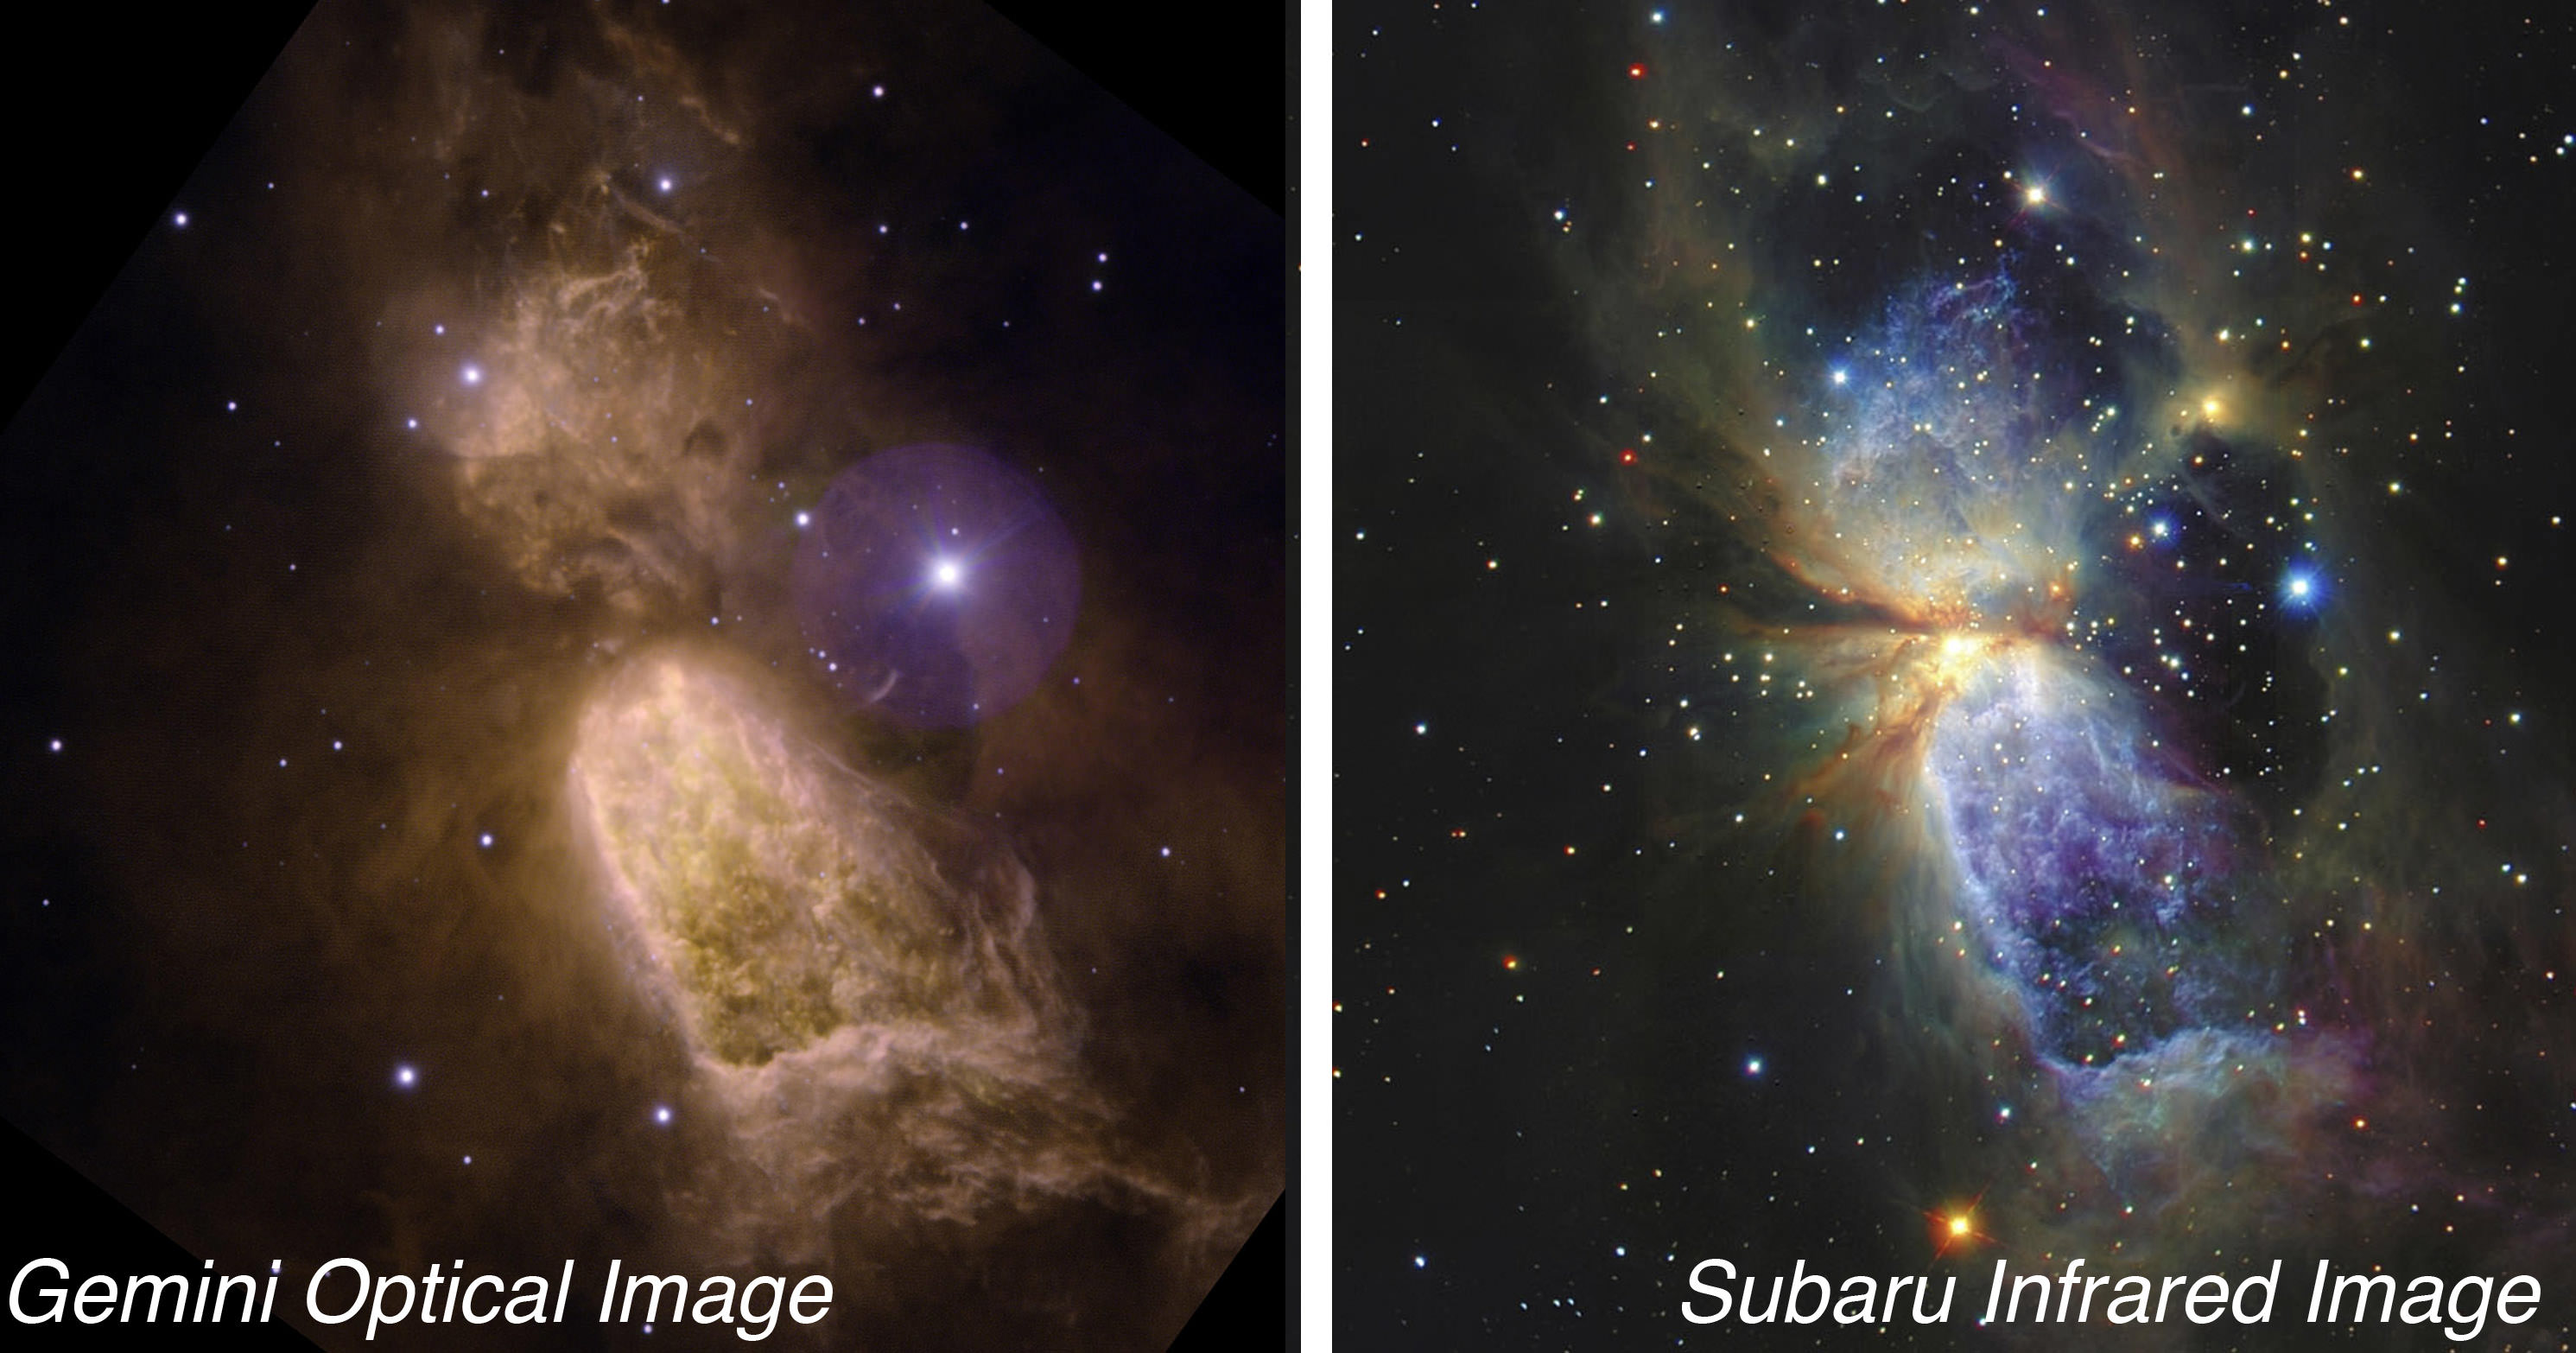
Sharpless 2-106 (Gemini Observatory/AURA, right; left: copyright Subaru Telescope, National Astronomical Observatory of Japan; All rights reserved)
[/caption]
About 2,000 light-years away, in the constellation of Cygnus (the Swan), lies Sharpless 2-106 (after Stewart Sharpless who put the catalog together in 1959), the birth-place of a star cluster-to-be.
Two recent image releases – by Subaru and Gemini – showcase their new filter sets and image capabilities; they also reveal the stunning beauty of the million-year-long process of the birth of a star.
Sharpless 2-106 (Gemini Observatory/AURA)
The filter set is part of the Gemini Multi-Object Spectrograph (GMOS) toolkit, and includes ones centered on the nebular lines of doubly ionized oxygen ([OIII] 499 nm), singly ionized sulfur ([SII] 672 nm), singly ionized helium (HeII 468nm), and hydrogen alpha (Hα 656 nm). The filters are all narrowband, and are also used to study planetary nebulae and excited gas in other galaxies.
The hourglass-shaped (bipolar) nebula in the new Gemini image is a stellar nursery made up of glowing gas, plasma, and light-scattering dust. The material shrouds a natal high-mass star thought to be mostly responsible for the hourglass shape of the nebula due to high-speed winds (more than 200 kilometers/second) which eject material from the forming star deep within. Research also indicates that many sub-stellar objects are forming within the cloud and may someday result in a cluster of 50 to 150 stars in this region.
The nebula’s physical dimensions are about 2 light-years long by 1/2 light-year across. It is thought that its central star could be up to 15 times the mass of our Sun. The star’s formation likely began no more than 100,000 years ago and eventually its light will break free of the enveloping cloud as it begins the relatively short life of a massive star.
For this Gemini image four colors were combined as follows: Violet – HeII filter; Blue – [SII] filter; Green – [OIII] filter; and Red – Hα filter. Sharpless 2-106 (Copyright Subaru Telescope, National Astronomical Observatory of Japan. All rights reserved)
The Subaru Telescope image was made by combining images taken through three broadband near-infrared filters, J (1.25 micron), H (1.65 micron), and K’ (2.15 micron).

")
")
")


")
")
")
)")
")
")