Hi! When I was only six (or so), I went out one clear but windy night with my uncle and peered through the eyepiece of his home-made 6" Newtonian reflector. The dazzling, shimmering, perfect globe-and-ring of Saturn entranced me, and I was hooked on astronomy, for life. Today I'm a freelance writer, and began writing for Universe Today in late 2009. Like Tammy, I do like my coffee, European strength please.
Contact me: [email protected]
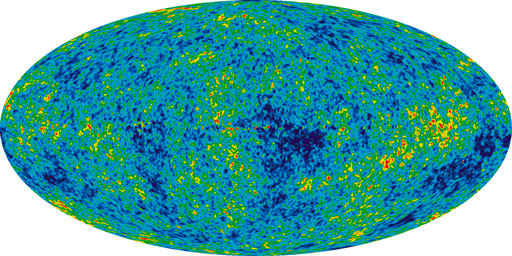
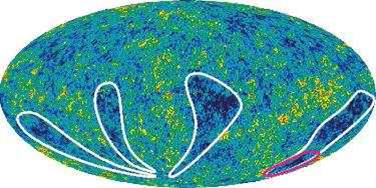
Seven Year Microwave Sky (Credit: NASA/WMAP Science Team)
[/caption]
The cosmological constant, symbol Λ (Greek capital lambda), was ‘invented’ by Einstein, not long after he published his theory of general relativity (GR). It appears on the left-hand side of the Einstein field equations.
Einstein added this term because he – along with all other astronomers and physicists of the time – thought the universe was static (the cosmological constant can make a universe filled with mass-energy static, neither expanding nor contracting). However, he very quickly realized that this wouldn’t work, because such a universe would be unstable … and quickly turn into one either expanding or contracting! Not long afterwards, Hubble (actually Vesto Slipher) discovered that the universe is, in fact, expanding, so the need for a cosmological constant went away.
Until 1998.
In that year, two teams of astronomers independently announced that distant Type Ia supernovae did not have the apparent luminosity they should, in a universe composed almost entirely of mass-energy in the form of baryons (ordinary matter) and cold dark matter.
Dark Energy had been discovered: dark energy is a form of mass-energy that has a constant density throughout the universe, and perhaps throughout time as well; counter-intuitively, it causes the expansion of the universe to accelerate (i.e. it acts kinda like anti-gravity). The most natural form of dark energy is the cosmological constant.
A great deal of research has gone into trying to discover if dark energy is, in fact, just the cosmological constant, or if it is quintessence, or something else. So far, results from observations of the CMB (by WMAP, mainly), of BAO (baryon acoustic oscillations, by extensive surveys of galaxies), and of high-redshift supernovae (by many teams) are consistent with dark energy being the cosmological constant.
So if the cosmological constant is (a) mass-energy (density), it can be expressed as kilograms (per cubic meter), can’t it? Yes, and the best estimate today is 7.3 x 10⁻²⁷ kg m 3.
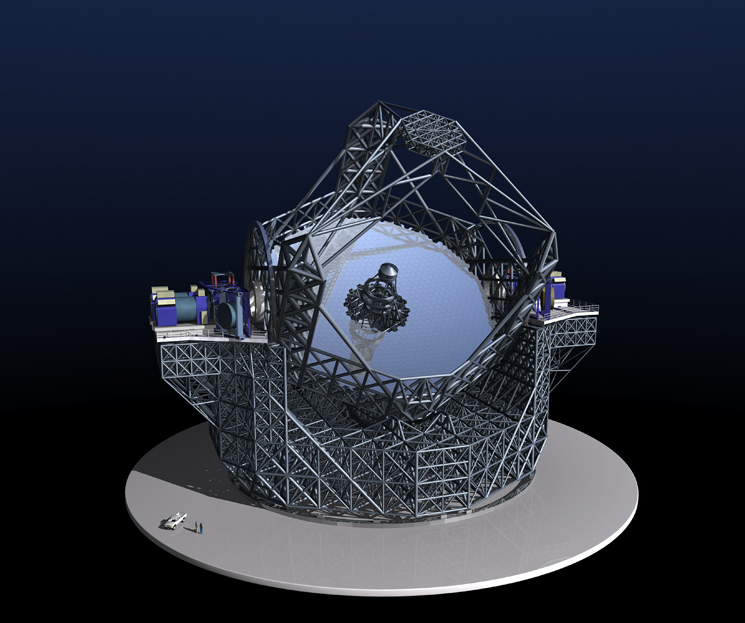
Artist impression of the Extremely Large Telescope. Credit: ESO
Question: Where are the night skies always dark, cloud-free 360 days a year, bone-dry, and orbiting 3.5 km above sea level?
Answer: Armazones Mountain, Atacama desert, Chile.
Question: Who wants to go live there?
Answer: The European Extremely-Large Telescope (E-ELT)!
“We are talking about the biggest telescope in the world, the biggest for a long time to come. That means we have to choose the best spot. Chile has a superb location. It’s the best in the world, there’s no doubt,” the European Southern Observatory’s astronomer, Massimo Tarenghi, told AFP. He is one of four astronomers – two Chileans, an Italian (Tarenghi) and a German – who were in the desert this week to evaluate its suitability compared to the main other contender: the Spanish isle of La Palma in the Canary Islands off western Africa.
The European Southern Observatory (ESO), an intergovernmental astronomical research agency that already has three facilities operating in the Atacama desert, including the Very Large Telescope array in the town of Paranal which is currently considered Europe’s foremost observatory.
Work on the E-ELT is to begin in December 2011 and cost 90 million euros (120 million dollars) … once a decision is made on the site, which will be as early as March this year.
When complete, the E-ELT will be “the world’s biggest eye on the sky,” according to the ESO, which hopes it will “address many of the most pressing unsolved questions in astronomy.”
The E-ELT is likely to be as revolutionary in the field of astronomy as Galileo’s telescope 400 years ago that determined that the Sun, and not the Earth, was the center of our universe, according to the European agency based in Munich, Germany. The German astronomer in Chile, Wolfgang Gieren, waxed happily about the possibilities of the future telescope. “In no more than 15 years we could have the first good-resolution spectra of planets outside our universe that are the same size of Earth and see if we can detect signs of life,” he said.
One of the Chilean astronomers, Mario Harmuy, said the Armazones provided an ideal location. “Several things come together here. The cold Humboldt Current, which passes by Chile’s coast, means that there is a high pressure center in the Pacific that deflects high clouds and prevents cover over this part of the continent,” he said. “To the east, the high Andes mountains prevent humidity from moving in from the Atlantic with clouds. The higher you are, the less humidity there is, and thus the light from the stars go through less of the atmosphere and is distorted less when it hits the telescope.” To boot, the Chilean location is free of the storms that hit the Canary Islands and the Sahara, he said.
Tarneghi added that the ESO’s existing Paranal observatory nearby also meant that much of the ground infrastructure was already in place.
Chile’s government was equally enthusiastic about hosting the E-ELT. Gabriel Rodriguez, in charge of the foreign ministry’s science and technology division, said Chile was ready to cede the 600 hectares (1,500 acres) needed for the project. The government is to submit its offer to the ESO next Monday, with a decision expected early March.
The Italian astronomer cautioned that despite Chile’s obvious advantages, the tender had to be weighed carefully for all its aspects. “Neither any of us nor the ESO know what the final decision will be. We need to receive the Chilean and Spanish proposals and evaluate factors of operation, work and production costs,” Tarenghi said.
The other Chilean astronomer, Maria Teresa Ruiz, remained fired up at the potential of the new instrument. The “surface area of this telescope is bigger than all the others in Chile combined, which will allow us to explore things in the universe that we can’t even imagine today,” she said.
OK, it’s actually the Herschel crater on Mimas, a smallish moon of Saturn (and it’s the eve of Chinese New Year, February 13th, 2010), but it’s a cool headline, don’t you think?
Cassini will be very busy that day, which begins with a rare sunrise – the Sun goes behind Saturn (from Cassini’s perspective) – followed by a rare blackout, as the Earth goes behind Saturn. Then there’s three “Forward shields up!” moments, as Cassini tries to dodge a Klingon missile flies through regions of “increased ring particle concentration”, a couple of distant flybys (Epimetheus, Janus; ~100,000 km each), a ring-plane crossing, another “Shields up!” moment, and a 9,500 km close approach to Death Star Mimas. And the day ends with a distant (112,000 km) flyby of Tethys. Whew!
“Mimas bears the mark of a violent, giant impact from the past – the 140-kilometer-wide Herschel Crater – and scientists hope the encounter will help them explain why the moon was not blown to smithereens when the impact happened. They will also be trying to count smaller dings inside the basin of Herschel Crater so they can better estimate its age,” JPL’s Jia-Rui C. Cook said, “The Mimas flyby involves a significant amount of skill because the spacecraft will be passing through a dusty region to get there. Mission managers have planned for the Cassini spacecraft to lead with its high-gain antenna to provide a barrier of protection.”
To date, the best images of Mimas – and its Herschel crater – were obtained on August 2nd, 2005, during Cassin’s distant flyby.
Mimas is an inner moon of Saturn that averages 396 kilometers in diameter. The diameter of Herschel Crater is about one-third that of the entire moon. The walls of the crater are about 5 kilometers high, and parts of the floor are approximately 10 kilometers deep. Map of Mimas (Credit: NASA/JPL/Space Science Institute )
Mimas would have beaten another of Saturn’s moons, Rhea, for the record of “most battered moon”, but for the fact that it was warmer – and so softer – for longer than Rhea (because it’s closer to Saturn), so many of the earliest craters were more degraded.
Have you heard of the “Mimas paradox”? Mimas’ orbit is more eccentric than Enceladus’, and is in resonance with Dione and Enceladus – so it should be heated, tidally, more than Enceladus – but its surface has not, apparently, changed for a very long time (while geysers on Enceladus show that it is still quite active). Further, the two moons seem to have similar compositions.
On this flyby, Cassini’s composite infrared spectrometer will be working to determine the thermal signature of the moon, and other instruments will be making measurements to learn more about the surface composition. Perhaps that will shed some light on the Mimas paradox.
[/caption]
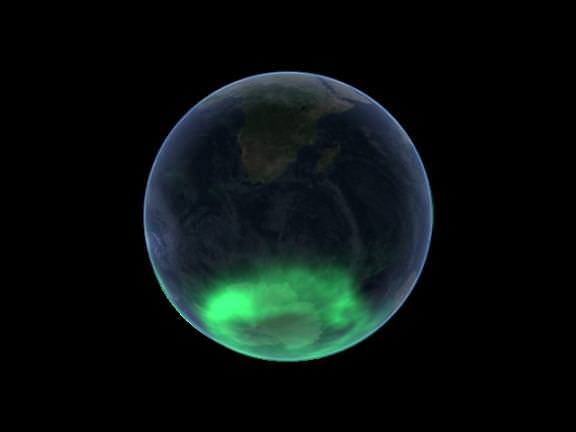
The southern lights, or aurora australis, is the southern hemisphere counterpart to the northern lights, or aurora borealis. They are one of nature’s most spectacular light shows, a sorta reward to the people who live that far south, in return for all the cold weather.
Because the southern lights most often occur in a band, or ring, more-or-less centered on the south magnetic pole (the auroral zone, radius approx 2,500 km), and because there is hardly any land in this band (and what little there is, no one lives there!), far fewer people have seen the southern lights than their northern siblings. However, they are sometimes seen in New Zealand (especially the South Island), Tasmania, in the far south of Chile and Argentina, etc. Most often they appear as sheets of color (mostly green, but sometimes other colors too, like red, or purple), on the southern horizon.
The southern lights are caused, ultimately, by energetic particles – mostly electrons – in the solar wind interacting with atoms and molecules in the Earth’s upper atmosphere, mediated by the Earth’s magnetic field. The energetic electrons excite and ionize oxygen and nitrogen in the tenuous air 100 to 300 km up, and these ions give off light as their electrons cascade back to their ground levels. Southern lights occur most often in an oval-shaped ring because the Earth’s magnetic field forces the energetic particles to dance a complicated dance, in which they touch down (come closest to the Earth) in this band.
Southern lights are seen more often during the peak years of the 11-year solar cycle, because the solar wind blows in violent gusts more often then (sunspots and flares play a key role in producing such gusts).
More to explore: Northern & Southern Lights (International Solar-Terrestrial Physics Program and NASA), The Aurora Australis – the Southern Lights (Antarctic Connection), and Auroras: the Northern and Southern Lights (part of a series of astronomy lectures) is a good selection to get you started.
[/caption]
There are actually three, Kepler’s laws that is, of planetary motion: 1) every planet’s orbit is an ellipse with the Sun at a focus; 2) a line joining the Sun and a planet sweeps out equal areas in equal times; and 3) the square of a planet’s orbital period is proportional to the cube of the semi-major axis of its orbit. As it’s the third which is most often used, Kepler’s law usually means Kepler’s third law (of planetary motion).
Tycho Brahe’s decades-long, meticulous observations of the stars and planets provided Kepler with what today we’d call a robust, well-controlled dataset to test his hypotheses concerning planetary motion (this way of describing it is, dear reader, a deliberate anachronism). In particular, Tycho’s observations of the position of Mars in the Uraniborg night sky were the primary source of hard data Kepler used to derive, and test, his three laws.
Kepler’s laws have an important place in the history of astronomy, cosmology, and science in general. They marked a key step in the revolution which moved the center of the universe from the Earth (geocentric cosmology) to the Sun (heliocentric), and they laid the foundation for the unification of heaven and earth, by Newton, a century later (before Newton the rules, or laws, which governed celestial phenomena were widely believed to be disconnected with those controlling things which happened on Earth; Newton showed – with his universal law of gravitation – that the same law rules both heaven and earth).
Although Kepler’s laws are only an approximation – they are exact, in classical physics, only for a planetary system of just one planet (and then the focus is the baricenter, not the Sun) – for systems in which one object dominates, mass-wise, they are a good approximation.
But do the WMAP data really, truly, absolutely contain evidence of anomalies, things that just do not fit within the six-parameters-and-a-model the WMAP team recently reported?
In a word, no.
Seven Year Microwave Sky (Credit: NASA/WMAP Science Team)
Every second year since 2003 the WMAP science team has published a set of papers on their analyses of the cumulative data, and their findings (with the mission due to end later this year, their next set will, sadly, be their last). With time and experience – not to mention inputs from the thousands of other researchers who have picked over the data – the team has not only amassed a lot more data, but has also come to understand how WMAP operates far better. As a consequence, not only are the published results – such as limits on the nature of dark energy, and the number of different kinds of neutrinos – more stringent and robust, but the team has also become very au fait with the various anomalies reported.
For the first time, the team has examined these anomalies, in detail, and has concluded that the answer to the question, in their words, “are there potential deviations from ?CDM within the context of the allowed parameter ranges of the existing WMAP observations?” is “no”.
The reported anomalies the team examined are many – two prominent cold spots, strength of the quadrupole, lack of large angular scale CMB power, alignment of the quadrupole and octupole components, hemispherical or dipole power asymmetry, to name but a handful – but the reasons for the apparent anomalies are few.
“Human eyes and brains are excellent at detecting visual patterns, but poor at assessing probabilities. Features seen in the WMAP maps, such as the large Cold Spot I near the Galactic center region, can stand out as unusual. However, the likelihood of such features can not be discerned by visual inspection of our particular realization of the universe,” they write, and “Monte Carlo simulations are an invaluable way to determine the expected deviations within the ?CDM model. Claims of anomalies without Monte Carlo simulations are necessarily weak claims”.
Stephen Hawking’s initials in the CMB (Credit: NASA/WMAP Science Team)
An amusing example: Stephen Hawking’s initials (“SH”) can be clearly seen in the WMAP sky map. “The “S” and “H” are in roughly the same font size and style, and both letters are aligned neatly along a line of fixed Galactic latitude,” the team says; “A calculation would show that the probability of this particular occurrence is vanishingly small. Yet, there is no case to made for a non-standard cosmology despite this extraordinarily low probability event,” they dryly note.
Many of the reports of WMAP CMB anomalies would likely make for good teaching material, as they illustrate well the many traps that you can so easily fall into when doing after-the-fact (a posteriori) statistical analyses. Or, as the team puts it in regard to the Stephen Hawking initials: “It is clear that the combined selection of looking for initials, these particular initials, and their alignment and location are all a posteriori choices. For a rich data set, as is the case with WMAP, there are a lot of data and a lot of ways of analyzing the data.”
And what happens when you have a lot of data? Low probability events are guaranteed to occur! “For example, it is not unexpected to find a 2? feature when analyzing a rich data set in a number of different ways. However, to assess whether a particular 2? feature is interesting, one is often tempted to narrow in on it to isolate its behavior. That process involves a posteriori choices that amplify the apparent significance of the feature.”
So, does the team conclude that all this anomaly hunting is a waste of effort? Absolutely not! I’ll quote from the team’s own conclusion: “The search for oddities in the data is essential for testing the model. The success of the model makes these searches even more important. A detection of any highly significant a posteriori feature could become a serious challenge for the model. The less significant features discussed in this paper provided the motivation for considering alternative models and developing new analysis of WMAP (and soon Planck) data. The oddities have triggered proposed new observations that can further test the models. It is often difficult to assess the statistical claims. It may well be that an oddity could be found that motivates a new theory, which then could be tested as a hypothesis against ?CDM. The data support these comparisons. Of course, other cosmological measurements must also play a role in testing new hypotheses. No CMB anomaly reported to date has caused the scientific community to adopt a new standard model of cosmology, but claimed anomalies have been used to provoke thought and to search for improved theories.”
Primary source: Seven-Year Wilkinson Microwave Anisotropy Probe (WMAP) Observations: Are There Cosmic Microwave Background Anomalies? (arXiv:1001.4758). The five other Seven-Year WMAP papers are: Seven-Year Wilkinson Microwave Anisotropy Probe (WMAP) Observations: Cosmological Interpretation (arXiv:1001.4538), Seven-Year Wilkinson Microwave Anisotropy Probe (WMAP) Observations: Planets and Celestial Calibration Sources (arXiv:1001.4731), Seven-Year Wilkinson Microwave Anisotropy Probe (WMAP) Observations: Sky Maps, Systematic Errors, and Basic Results (arXiv:1001.4744), Seven-Year Wilkinson Microwave Anisotropy Probe (WMAP) Observations: Power Spectra and WMAP-Derived Parameters (arXiv:1001.4635), and Seven-Year Wilkinson Microwave Anisotropy Probe (WMAP) Observations: Galactic Foreground Emission (arXiv:1001.4555). Also check out the official WMAP website.
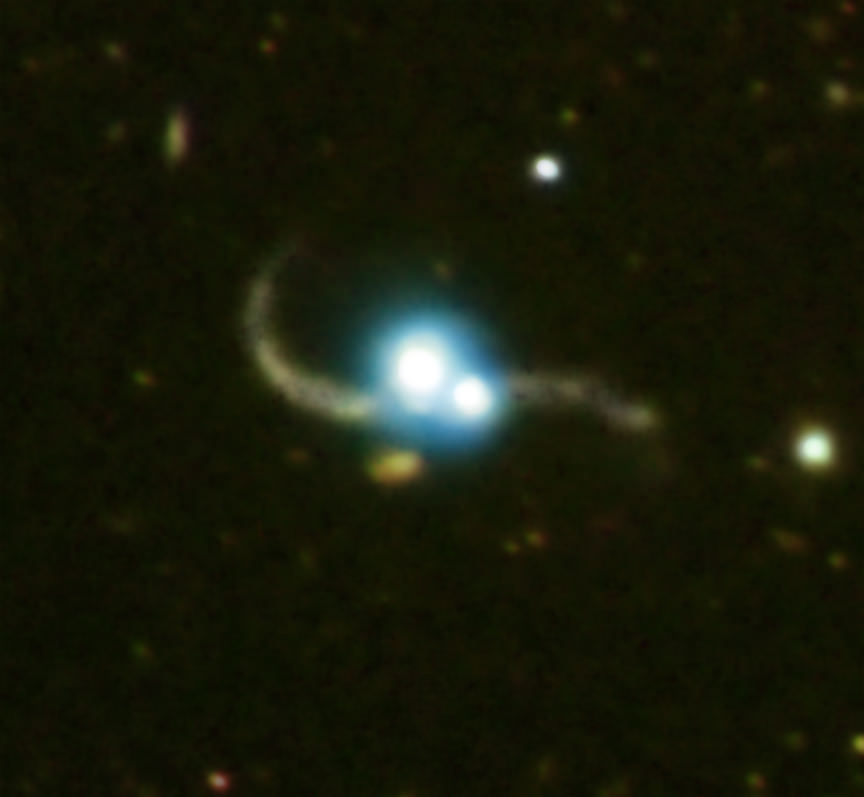
SDSS J1254+0846 x-ray (blue), optical (yellow)(Credits: X-ray: NASA/CXC/SAO/Green et al Optical: Carnegie Obs/Magellan/Baade Telescope/Mulchaey et al)
[/caption]
Excellent teamwork by astronomers working in two different wavebands – x-ray and optical – has led to the discovery of a binary quasar being created by a pair of merging galaxies.
“This is really the first case in which you see two separate galaxies, both with quasars, that are clearly interacting,” says Carnegie astronomer John Mulchaey who made observations crucial to understanding the galaxy merger.
“The model verifies the merger origin for this binary quasar system,” Thomas Cox, now a fellow at the Carnegie Observatories, says, referring to computer simulations of the merging galaxies he produced. When Cox’s model galaxies merged, they showed features remarkably similar to what Mulchaey observed in the Magellan images. “It also hints that this kind of galaxy interaction is a key component of the growth of black holes and production of quasars throughout our universe,” Cox added.
“Just because you see two galaxies that are close to each other in the sky doesn’t mean they are merging,” says Mulchaey. “But from the Magellan images we can actually see tidal tails, one from each galaxy, which suggests that the galaxies are in fact interacting and are in the process of merging.”
As Universe Today readers know, quasars are the extremely bright centers of galaxies surrounding supermassive black holes, and binary quasars are pairs of quasars bound together by the mutual gravitation of the two host galaxies’ nuclei. Binary quasars, like other quasars, are thought to be the product of galaxy mergers. Until now, however, binary quasars have not been seen in galaxies that are unambiguously in the act of merging. But images of a new binary quasar from the Carnegie Institution’s Magellan telescope in Chile show two distinct galaxies with tails produced by tidal forces from their mutual gravitational attraction.
Supermassive black holes are to be found in the nuclei of most, if not all, large galaxies, such as our galaxy the Milky Way. Because galaxies regularly interact and merge, astronomers have concluded that binary supermassive black holes have been common in the Universe, especially during its early history (when galaxy mergers were far more common). Supermassive black holes can only be detected as quasars – which are one kind of highly luminous active galactic nucleus (AGN) – when they are actively accreting matter, a process that releases vast amounts of energy across the entire electromagnetic spectrum. A leading theory of ordinary AGNs is that galaxy mergers trigger accretion, creating quasars in both galaxies (AGNs in the hearts of the giant elliptical galaxies in rich clusters are thought to be fueled by a different mechanism, cooling flow). Because most such mergers would have happened in the distant past, binary quasars and their associated galaxies are very far away and therefore difficult for most telescopes to resolve.
The binary quasar, named SDSS J1254+0846, was initially detected by the Sloan Digital Sky Survey, a multi-year, large scale astronomical survey of galaxies and quasars. Further observations by Paul Green of the Harvard-Smithsonian Center for Astrophysics and colleagues using NASA’s Chandra’s X-ray Observatory and telescopes at Kitt Peak National Observatory in Arizona and Palomar Observatory in California strongly suggest that the object was likely a binary quasar in the midst of a galaxy merger. Carnegie’s Mulchaey then used the 6.5 meter Baade-Magellan telescope at the Las Campanas observatory in Chile to obtain deeper images and more detailed spectroscopy of the merging galaxies.
[/caption]
If civilization-forming intelligent life is rare in our Milky Way galaxy, chances are we won’t hear from ET before the Sun goes red giant, in about five billion years’ time; however, if we do hear from ET before then, we’ll have lots of nice chats before the Earth is sterilized.
That’s the conclusion from a recent study of Ward and Brownlee’s Rare Earth hypothesis by Duncan Forgan and Ken Rice, in which they made a toy galaxy, simulating the real one we live in, and ran it 30 times. In their toy galaxy, intelligent life formed on Earth-like planets only, just as it does in the Rare Earth hypothesis.
While the Forgan and Rice simulations are still limited and somewhat unrealistic, they give a better handle on SETI’s chances for success than either the Drake equation or Fermi’s “Where are they?”
“The Drake equation itself does suffer from some key weaknesses: it relies strongly on mean estimations of variables such as the star formation rate; it is unable to incorporate the effects of the physico-chemical history of the galaxy, or the time-dependence of its terms,” Forgan says, “Indeed, it is criticized for its polarizing effect on “contact optimists” and “contact pessimists”, who ascribe very different values to the parameters, and return values of the number of galactic civilizations who can communicate with Earth between a hundred-thousandth and a million (!)”
Building on the work of Vukotic and Cirkovic, Forgan developed a Monte Carlo-based simulation of our galaxy; as inputs, he used the best estimates of actual astrophysical parameters such as the star formation rate, initial mass function, a star’s time spent on the main sequence, likelihood of death from the skies, etc. For several key inputs however, “the model goes beyond relatively well-constrained parameters, and becomes hypothesis,” Forgan explains, “In essence, the method generates a Galaxy of a billion stars, each with their own stellar properties (mass, luminosity, location in the Galaxy, etc.) randomly selected from observed statistical distributions. Planetary systems are then generated for these stars in a similar manner, and life is allowed to evolve in these planets according to some hypothesis of origin. The end result is a mock Galaxy which is statistically representative of the Milky Way. To quantify random sampling errors, this process is repeated many times: this allows an estimation of the sample mean and sample standard deviation of the output variables obtained.”
Forgan simulated the Rare Earth hypothesis by allowing animal life – the only kind of life from which intelligent civilizations can arise – to form only if homeworld’s mass is between a half and two Earths, if homesun’s mass is between a half and 1.5 times our Sun’s, homeworld has at least one moon (for tides and axial stability), and if homesun has at least one planet of mass at least ten times that of Earth, in an outer orbit (to cut down on death from the skies due to asteroids and comets).
The good news for SETI is that a galaxy like ours should host hundreds of intelligent civilizations (though, somewhat surprisingly, there is no galactic goldilocks zone); the bad news is that during the time such a civilization could communicate with an ET – between when it becomes technologically advanced enough and when it is wiped out by homesun going red giant – there are, in most simulations, no other such civilizations (or if there are, they are too far away) … we, or ET, would be alone.
But it’s not all bad news; if we are not alone, then once contact is established, we will have many phone calls with ET.
To be sure, this is but a work-in-progress. “Numerical modeling of this type is generally a shadow of the entity it attempts to model, in this case the Milky Way and its constituent stars, planets and other objects,” Forgan and Rice say; several improvements are already being worked on.
Sources: “A numerical testbed for hypotheses of extraterrestrial life and intelligence” (Forgan D., 2009, International Journal of Astrobiology, 8, 121), and “Numerical Testing of The Rare Earth Hypothesis using Monte Carlo Realisation Techniques” (arXiv:1001:1680); this too will be published in IJA, likely in April.
Temperature and polarization around hot and cold spots (Credit: NASA / WMAP Science Team)
[/caption]
The Wilkinson Microwave Anisotropy Probe (WMAP) science team has finished analyzing seven full years’ of data from the little probe that could, and once again it seems we can sum up the universe in six parameters and a model.
Using the seven-year WMAP data, together with recent results on the large-scale distribution of galaxies, and an updated estimate of the Hubble constant, the present-day age of the universe is 13.75 (plus-or-minus 0.11) billion years, dark energy comprises 72.8% (+/- 1.5%) of the universe’s mass-energy, baryons 4.56% (+/- 0.16%), non-baryonic matter (CDM) 22.7% (+/- 1.4%), and the redshift of reionization is 10.4 (+/- 1.2).
In addition, the team report several new cosmological constraints – primordial abundance of helium (this rules out various alternative, ‘cold big bang’ models), and an estimate of a parameter which describes a feature of density fluctuations in the very early universe sufficiently precisely to rule out a whole class of inflation models (the Harrison-Zel’dovich-Peebles spectrum), to take just two – as well as tighter limits on many others (number of neutrino species, mass of the neutrino, parity violations, axion dark matter, …).
The best eye-candy from the team’s six papers are the stacked temperature and polarization maps for hot and cold spots; if these spots are due to sound waves in matter frozen in when radiation (photons) and baryons parted company – the cosmic microwave background (CMB) encodes all the details of this separation – then there should be nicely circular rings, of rather exact sizes, around the spots. Further, the polarization directions should switch from radial to tangential, from the center out (for cold spots; vice versa for hot spots).
And that’s just what the team found!
Concerning Dark Energy. Since the Five-Year WMAP results were published, several independent studies with direct relevance to cosmology have been published. The WMAP team took those from observations of the baryon acoustic oscillations (BAO) in the distribution of galaxies; of Cepheids, supernovae, and a water maser in local galaxies; of time-delay in a lensed quasar system; and of high redshift supernovae, and combined them to reduce the nooks and crannies in parameter space in which non-cosmological constant varieties of dark energy could be hiding. At least some alternative kinds of dark energy may still be possible, but for now Λ, the cosmological constant, rules.
Concerning Inflation. Very, very, very early in the life of the universe – so the theory of cosmic inflation goes – there was a period of dramatic expansion, and the tiny quantum fluctuations before inflation became the giant cosmic structures we see today. “Inflation predicts that the statistical distribution of primordial fluctuations is nearly a Gaussian distribution with random phases. Measuring deviations from a Gaussian distribution,” the team reports, “is a powerful test of inflation, as how precisely the distribution is (non-) Gaussian depends on the detailed physics of inflation.” While the limits on non-Gaussianity (as it is called), from analysis of the WMAP data, only weakly constrain various models of inflation, they do leave almost nowhere for cosmological models without inflation to hide.
Concerning ‘cosmic shadows’ (the Sunyaev-Zel’dovich (SZ) effect). While many researchers have looked for cosmic shadows in WMAP data before – perhaps the best known to the general public is the 2006 Lieu, Mittaz, and Zhang paper (the SZ effect: hot electrons in the plasma which pervades rich clusters of galaxies interact with CMB photons, via inverse Compton scattering) – the WMAP team’s recent analysis is their first to investigate this effect. They detect the SZ effect directly in the nearest rich cluster (Coma; Virgo is behind the Milky Way foreground), and also statistically by correlation with the location of some 700 relatively nearby rich clusters. While the WMAP team’s finding is consistent with data from x-ray observations, it is inconsistent with theoretical models. Back to the drawing board for astrophysicists studying galaxy clusters. Seven Year Microwave Sky (Credit: NASA/WMAP Science Team)
I’ll wrap up by quoting Komatsu et al. “The standard ΛCDM cosmological model continues to be an exquisite fit to the existing data.”
Primary source: Seven-Year Wilkinson Microwave Anisotropy Probe (WMAP) Observations: Cosmological Interpretation (arXiv:1001.4738). The five other Seven-Year WMAP papers are: Seven-Year Wilkinson Microwave Anisotropy Probe (WMAP) Observations: Are There Cosmic Microwave Background Anomalies? (arXiv:1001.4758), Seven-Year Wilkinson Microwave Anisotropy Probe (WMAP) Observations: Planets and Celestial Calibration Sources (arXiv:1001.4731), Seven-Year Wilkinson Microwave Anisotropy Probe (WMAP) Observations: Sky Maps, Systematic Errors, and Basic Results (arXiv:1001.4744), Seven-Year Wilkinson Microwave Anisotropy Probe (WMAP) Observations: Power Spectra and WMAP-Derived Parameters (arXiv:1001.4635), and Seven-Year Wilkinson Microwave Anisotropy Probe (WMAP) Observations: Galactic Foreground Emission (arXiv:1001.4555). Also check out the official WMAP website.
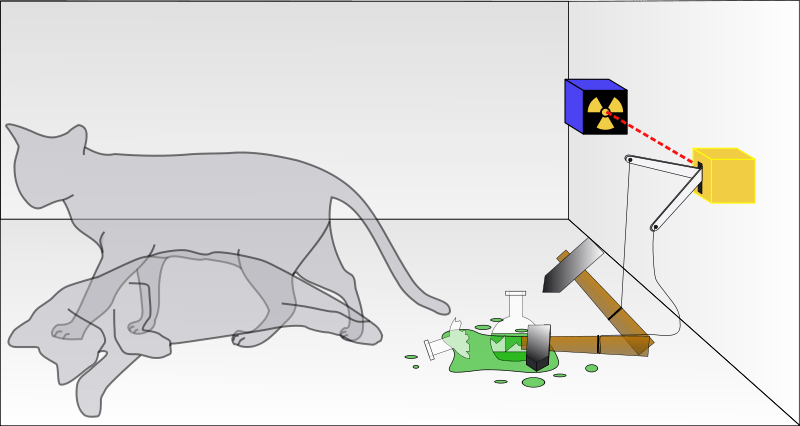
Schrodinger’s cat is named after Erwin Schrödinger, a physicist from Austria who made substantial contributions to the development of quantum mechanics in the 1930s (he won a Nobel Prize for some of this work, in 1933). Apart from the poor cat (more later), his name is forever associated with quantum mechanics via the Schrödinger equation, which every physics student has to grapple with.
Schrodinger’s cat is actually a thought experiment (Gedankenexperiment) – and the cat may not have been Erwin’s, but his wife’s, or one of his lovers’ (Erwin had an unconventional lifestyle) – designed to test a really weird implication of the physics he and other physicists was developing at the time. It was motivated by a 1935 paper by Einstein, Podolsky, and Rosen; this paper is the source of the famous EPR paradox.
In the thought experiment, Schrodinger’s cat is placed inside a box containing a piece of radioactive material, and a Geiger counter wired to a flask of poison in such a way that if the Geiger counter detects a decay, then the flask is smashed, the poison gas released, and the cat dies (fun piece of trivia: an animal rights group accused physicists of cruelty to animals, based on a distorted version of this thought experiment! though maybe that’s just an urban legend). The half-life of the radioactive material is an hour, so after an hour, there is a 50% probability that the cat is dead, and an equal probability that it is alive. In quantum mechanics, these two states are superposed (a technical term), and the cat is neither dead nor alive, or half-dead and half-alive, or … which is really, really weird.
Now the theory – quantum mechanics – has been tested perhaps more thoroughly than any other theory in physics, and it seems to describe how the universe behaves with extraordinary accuracy. And the theory says that when the box is opened – to see if the cat is dead, alive, half-dead and half-alive, or anything else – the wavefunction (describing the cat, Geiger counter, etc) collapses, or decoheres, or that the states are no longer entangled (all technical terms), and we see only a dead cat or cat very much alive.
There are several ways to get your mind around what’s going on – or several interpretations (you guessed it, yet another technical term!) – with names like Copenhagen interpretation, many worlds interpretation, etc, but the key thing is that the theory is mute on the interpretations … it simply says you can calculate stuff using the equations, and what your calculations show is what you’ll see, in any experiment.
Fast forward to some time after Schrödinger – and Einstein, Podolsky, and Rosen – had died, and we find that tests of the EPR paradox were proposed, then conducted, and the universe does indeed seem to behave just like schrodinger’s cat! In fact, the results from these experimental tests are used for a kind of uncrackable cryptography, and the basis for a revolutionary kind of computer.
Keen to learn more? Try these: Schrödinger’s Rainbow is a slideshow review of the general topic (California Institute of Technology; caution, 3MB PDF file!); Schrodinger’s cat comes into view, a news story on a macroscopic demonstration; and Schrödinger’s Cat (University of Houston).
Schrodinger’s cat is indirectly referenced in several Astronomy Cast episodes, among them Quantum Mechanics, and Entanglement; check them out!


")
")