Say Ahhh to Mars

Take a deep breath because this new panorama from Mars enthusiast Stu Atkinson will take it away.

“Anyway, a whole bunch of these came down, like I said, and to my delight they all linked up to form a big, biiiiiiiig panoramic mosaic,” said Stu on his blog “The Gale Gazette.” “And here it is. Obviously you’ll need to click on it to enlarge it… and I’ll warn you, it’s a big image, you can kiss the next few minutes goodbye because you’ll be panning around it for a while…”

Zoom in and you can see actual rocks. Click that little button at the right of the toolbar and Mars will take over your screen.

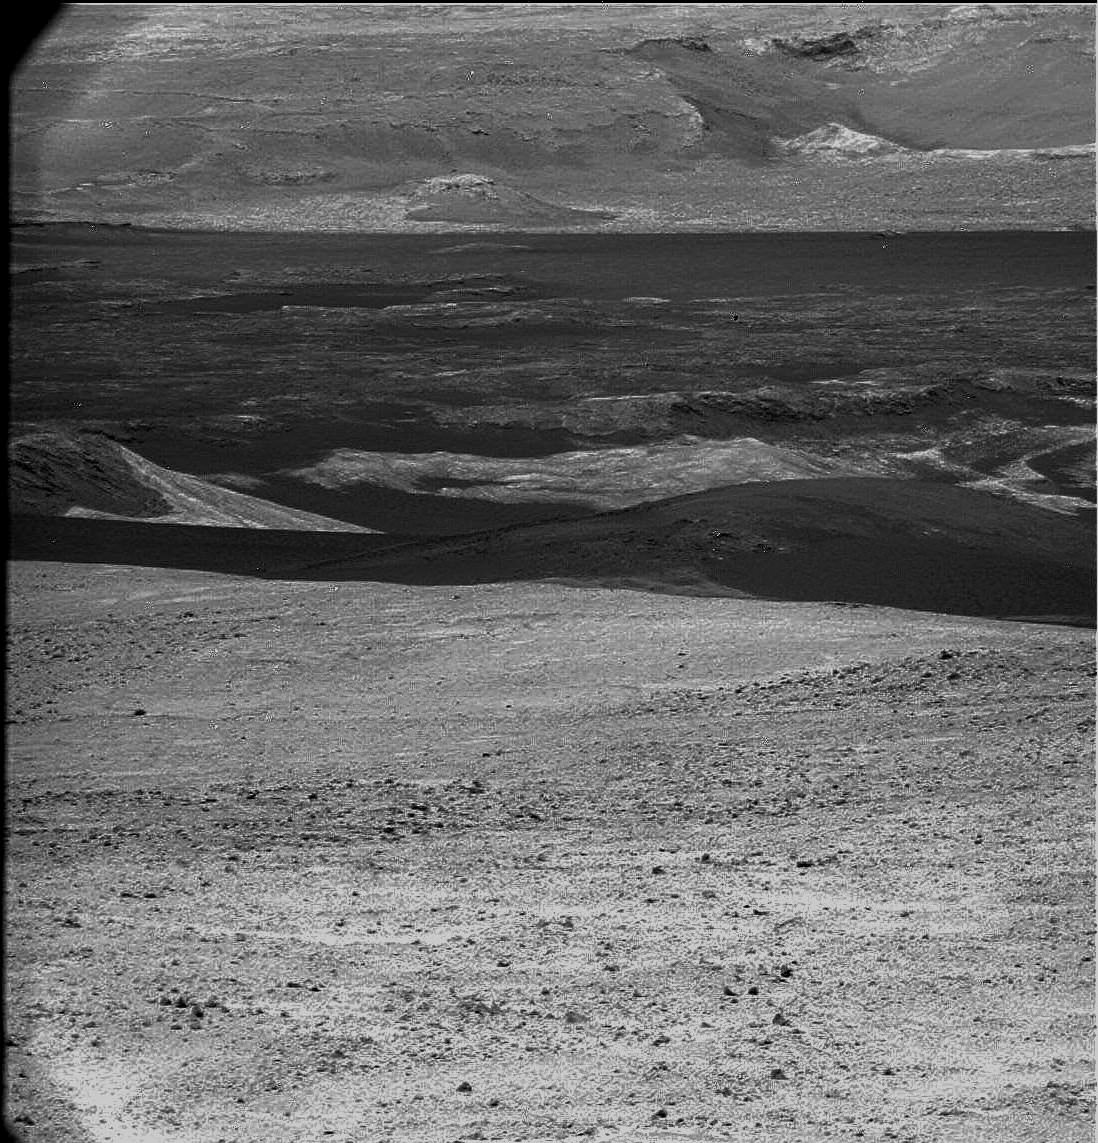
So far, Curiosity has rolled across a barely dusty plain in Gale Crater. Here’s a look of things to come. In black-and-white image from Curiosity, there appear to be big dunes to cross to get to the foothills of Aeolis Mons, or Mount Sharp.

A black-and-white but still breathtaking view of the dusty terrain between Curiosity’s current location and the foothills of Aeolis Mons, or Mount Sharp. Credit: NASA/JPL/Stu Atkinson

Curiosity has nearly finished robotic arm tests. Once complete, the rover will be able to touch and examine its first Mars rock.

“We’re about to drive some more and try to find the right rock to begin doing contact science with the arm,” said Jennifer Trosper, Curiosity mission manager at NASA’s Jet Propulsion Laboratory in Pasadena, Calif, in a press release.

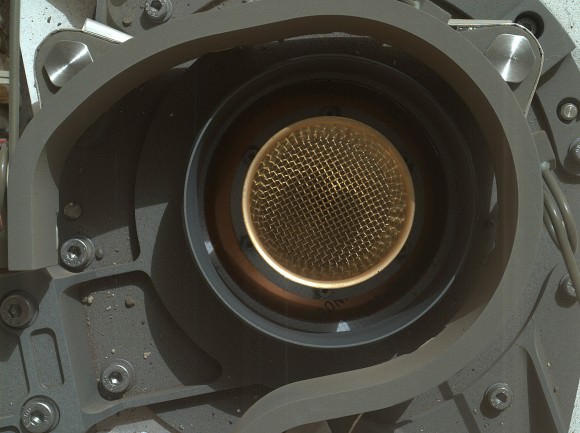
This image from NASA’s Curiosity rover shows the open inlet where powered rock and soil samples will be funneled down for analysis. It was taken by the Mars Hand Lens Imager (MAHLI) on Curiosity’s 36th Martian day, or sol, of operations on Mars (Sept. 11, 2012). MAHLI was about 8 inches (20 centimeters) away from the mouth of the Chemistry and Mineralogy (CheMin) instrument when it took the picture. The entrance of the funnel is about 1.4 inches (3.5 centimeters) in diameter. The mesh screen is about 2.3 inches (5.9 centimeters) deep. The mesh size is 0.04 inches (1 millimeter). Once the samples have gone down the funnel, CheMin will be shooting X-rays at the samples to identify and quantify the minerals.

Engineers and scientists use images like these to check out Curiosity’s instruments. This image is a composite of eight MAHLI pictures acquired at different focus positions and merged onboard the instrument before transmission to Earth; this is the first time the MAHLI performed this technique since arriving at Curiosity’s field site inside Gale Crater. The image also shows angular and rounded pebbles and sand that were deposited on the rover deck during landing on Aug. 5, 2012 PDT (Aug. 6, 2012 EDT).

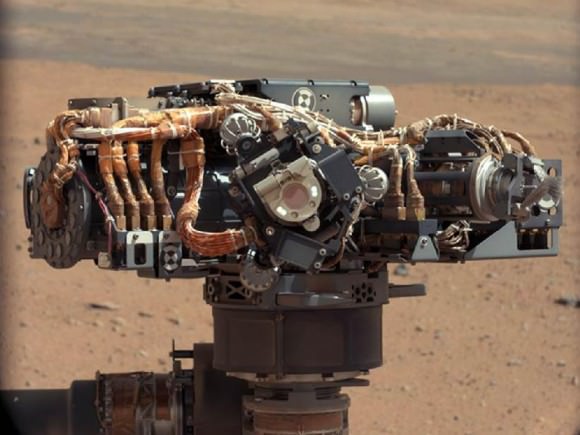
Two science instruments, a camera called Mars Hand Lens Imager, or MAHLI, that can take close-up color images and a tool called Alpha Particle X-ray Spectrometer (APXS) that can determine the elemental composition of a rock, also have passed tests. The instruments are mounted on a turret at the end of the robotic arm and can be placed in contact with target rocks. The adjustable focus MAHLI camera produced images this week of objects near and far; of the underbelly of Curiosity, across inlet ports and a penny that serves as a calibration target on the rover.

This close-up image shows tiny grains of Martian sand that settled on the penny that serves as a calibration target on NASA’s Curiosity rover. The larger grain under Abraham Lincoln’s ear is about 0.2 millimeters across. The grains are classified as fine to very fine sand.

The Mars Hand Lens Imagery (MAHLI) on the Curiosity rover taken by the Mast Camera on the 32nd Martian day, or sol, of operations on the surface. Engineers imaged MAHLI to inspect the dust cover and to ensure that the tool’s LED lights are functional. Scientists enhanced the image to show the scene as it would appear under Earth’s lighting conditions. This helps in analyzing the background terrain.

Check out more images from the Mars Science Laboratory teleconference.

Image credit: NASA/JPL-Caltech/MSSS

The Unusually Colossal Kepler Supernova

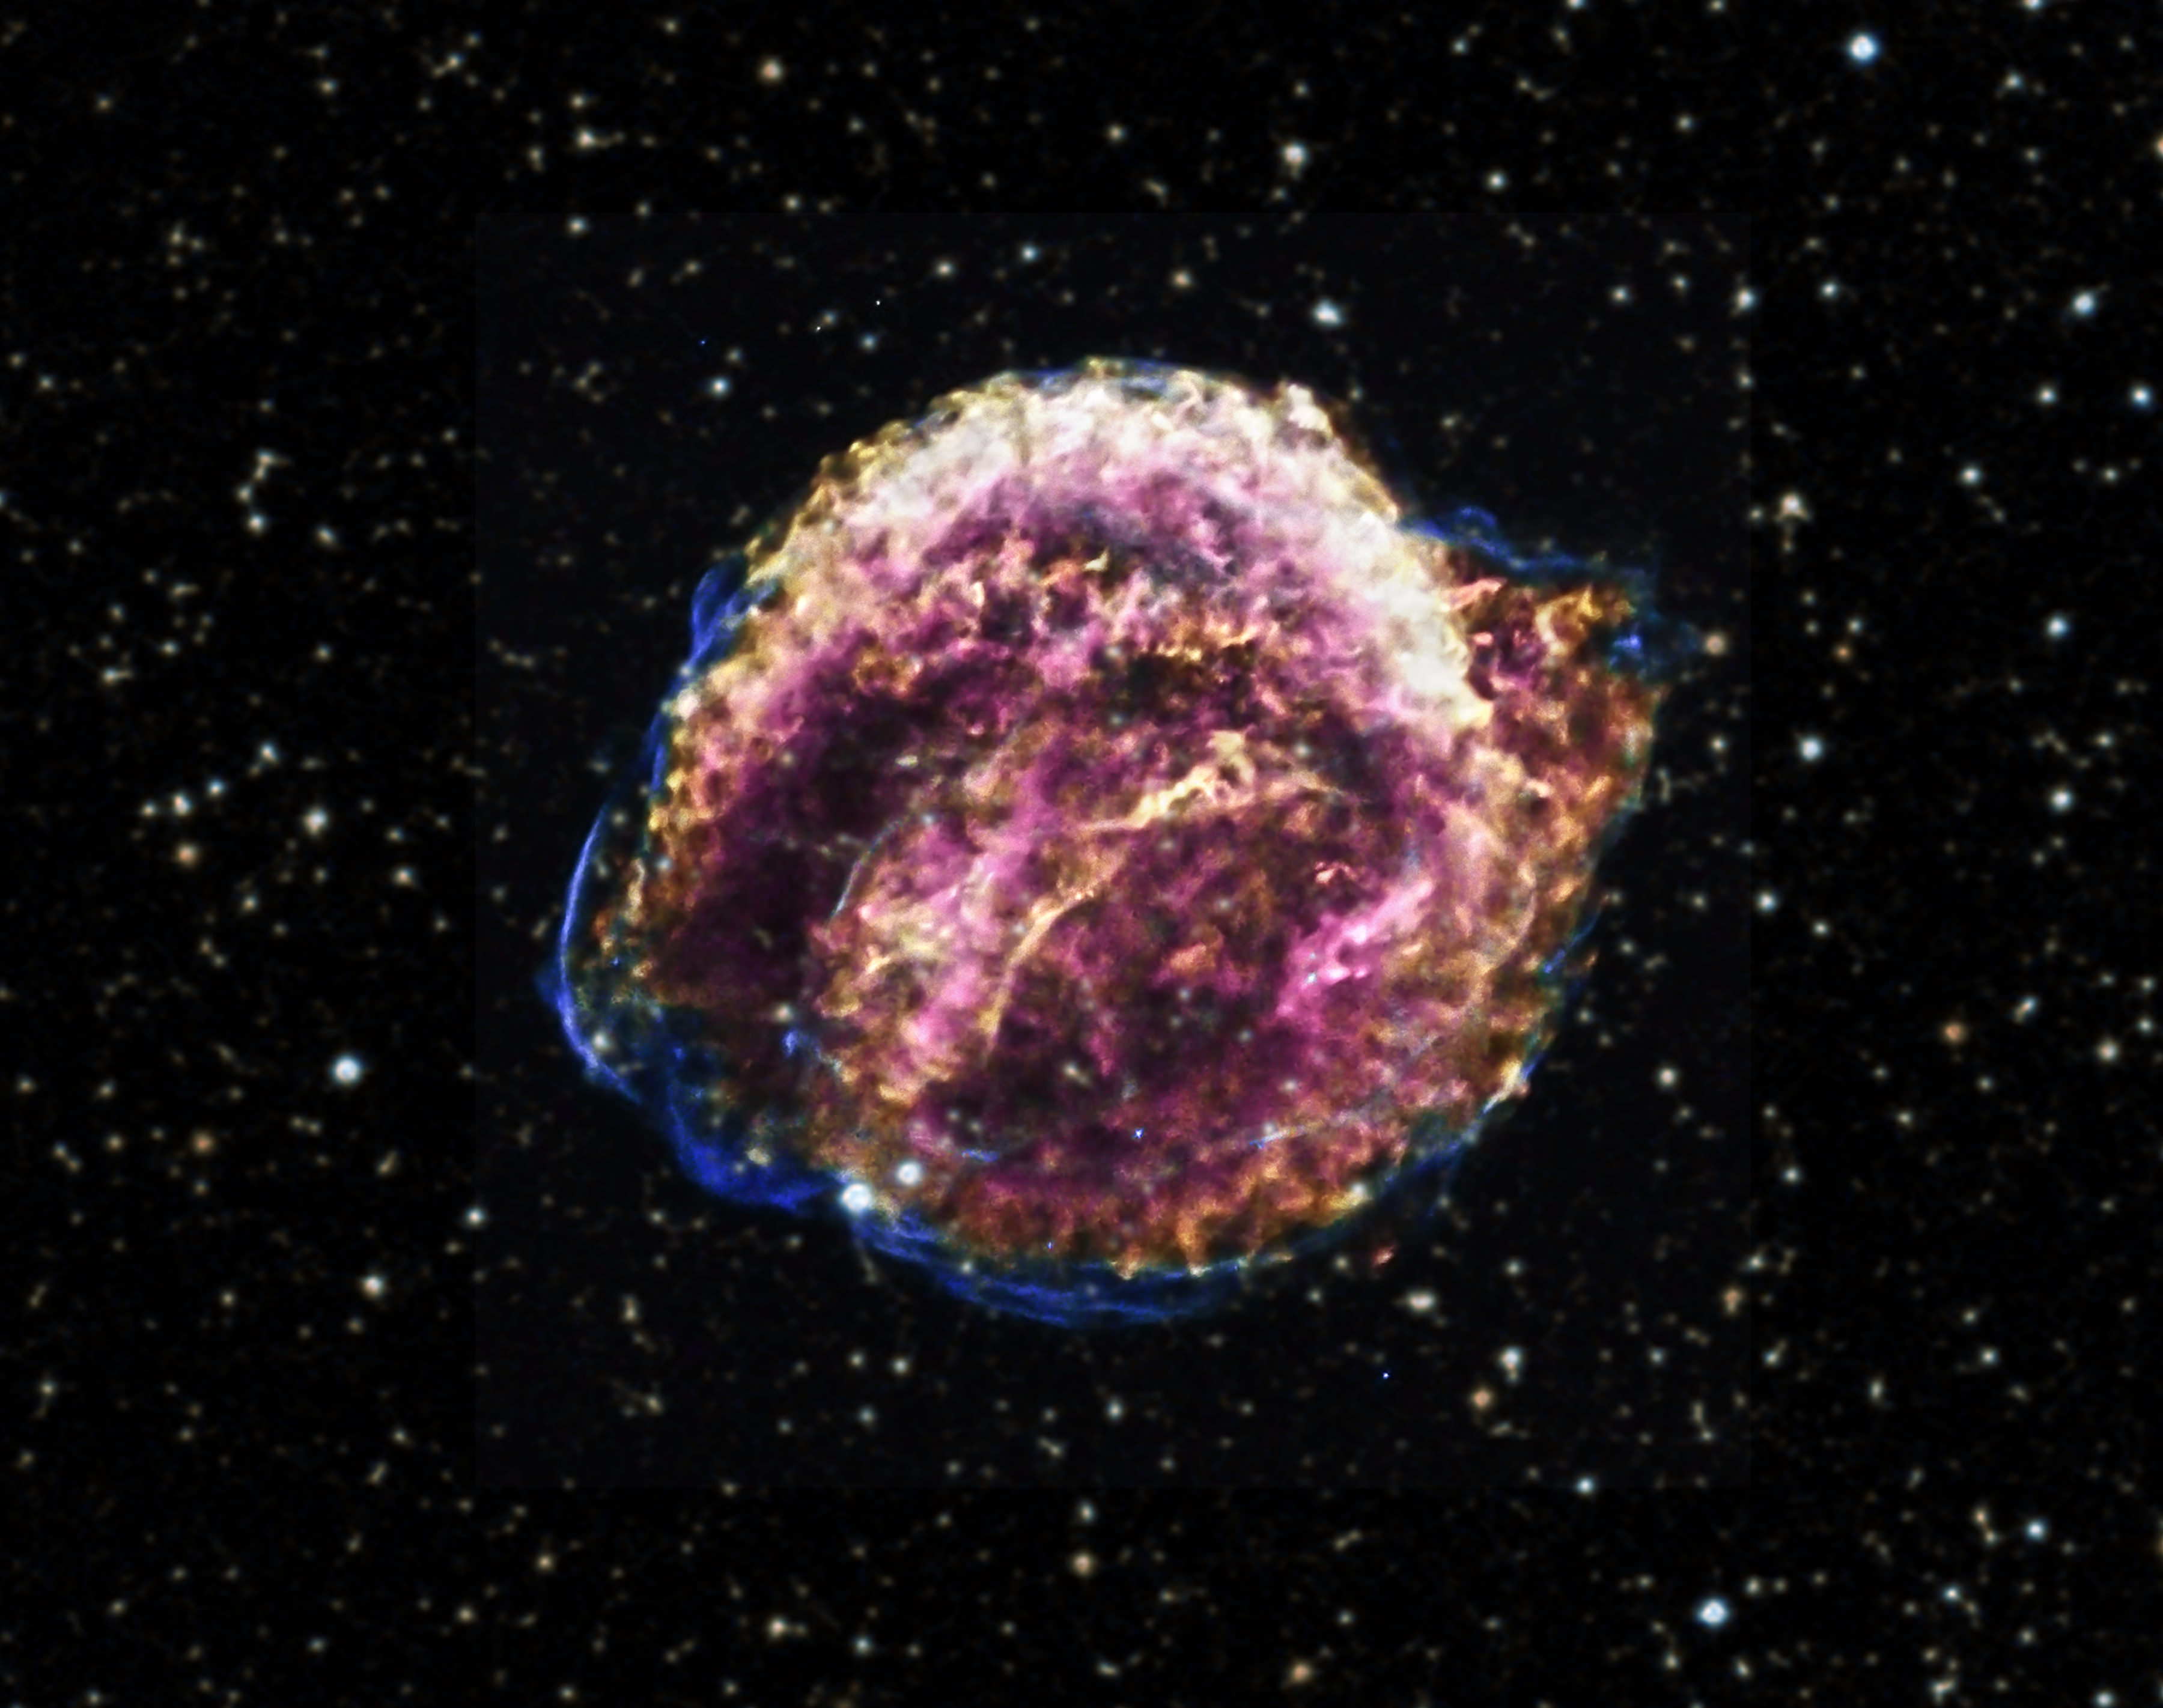
A composite image of Chandra X-ray data shows a rainbow of reds, yellows, green, blue and purple, from lower to higher energies. Optical data from the Digitized Sky Survey, shown in pale yellow and blue, offer a starry background for the image. Optical: DSS

An arc of hot gas that spewed from the Kepler Supernova offers tantalizing clues that the cataclysmic stellar explosion of 1604 was not only more powerful than previously thought but also farther away according to a recent study using Chandra X-ray Observatory data published in the September 1, 2012 edition of The Astrophysical Journal.

A new star appeared in the autumn skies of 1604. Although it was described by other astronomers, it was famous astronomer Johannes Kepler who thoroughly detailed the the second supernova sighting in a generation. The star shined more brilliant than Jupiter and remained visible – even during the day – over several weeks.

Look for Kepler’s Supernova at the foot of the constellation Ophiuchus, the Serpent Bearer, in visible light and you won’t see much. But the hot gas and dust glow brightly in the X-ray images from Chandra. Astronomers have long puzzled over Kepler’s Supernova. Astronomers now know the explosion that created the remnant was a Type Ia supernova. Supernovae of this class occur when a white dwarf, the white-hot dead core of a once Sun-like star, gains mass by either merging with another white dwarf or drawing gas onto its surface from a larger companion star until temperatures soar and thermonuclear processes spiral out of control resulting in a detonation that destroys the star.

Kepler’s Supernova is a bit different because the expanding debris cloud is shaped by gas and dust clouds throughout the area. Most Type Ia supernovae are symmetrical; nearly perfect expanding bubbles of material. A quick look at the Chandra image of the supernova and one notices the bright arc of material across the top edge of shockwave. In one model, a pre-supernova white dwarf and its companion were moving through a nebulous area creating a bow shock, like a boat plowing through water, in front. Another model suggests that the glowing arc is the edge of the supernova shockwave as it passes through an area of increasingly dense gas and dust. Both models push the distance of the supernova from the previously believed 13,000 light-years to more than 20,000 light-years from Earth, scientists say in the paper.

Scientists also found large amounts of iron by looking at the X-ray light from Chandra meaning that the explosion was far more powerful than an average Type Ia supernova. Astronomers have observed a similar Type Ia supernova using Chandra and an optical telescope in the Large Magellanic Cloud.

Kepler’s Supernova is the last Milky Way supernova visible to the naked eye. It was the second supernova to be observed in that generation after SN 1572 in Cassiopeia studied by the famous astronomer Tycho Brahe.

Source: http://chandra.harvard.edu

About the author: John Williams is owner of TerraZoom, a Colorado-based web development shop specializing in web mapping and online image zooms. He also writes the award-winning blog, StarryCritters, an interactive site devoted to looking at images from NASA’s Great Observatories and other sources in a different way. A former contributing editor for Final Frontier, his work has appeared in the Planetary Society Blog, Air & Space Smithsonian, Astronomy, Earth, MX Developer’s Journal, The Kansas City Star and many other newspapers and magazines. Follow John on Twitter @terrazoom.

Holy Galaxify Batman! Galaxy Zoo Allows Users to Put Their Name in Big Lights

If you’re going to put your name in lights, you might as well go big; REALLY big. And with millions of galaxies forming all sorts of shapes including letters, numbers and punctuation, GalaxyZoo has created a way for you to do just that.

More than 250,000 people, sorting through about a million images, have taken part in the Galaxy Zoo project since its launch in 2007. “Their findings have ranged from the scientifically exciting to the weird and wonderful,” says the Galaxy Zoo team. And among the weird, the Zooites – that’s what project volunteers call themselves – have found an alphabet of galaxies.

The new “font,” available for anyone to use, is a way to thank all the Zooites for their hard work. But now a new challenge awaits.

Starting today, the Galaxy Zoo now has more than 250,000 new images of galaxies, most of which have never been seen by humans…. and the GZ team really wants them to be seen by humans!

But first, the reward:

Galaxy Zoo team member Dr. Steven Bamford, of the University of Nottingham, created the website at http://www.mygalaxies.co.uk allowing users to create a message in stars.

“We’d like to thank all those that have taken part in Galaxy Zoo in the past five years. Humans are better than computers at pattern recognition tasks like this, and we couldn’t have got so far without everyone’s help,” says Galaxy Zoo principal investigator Dr. Chris Lintott from the University of Oxford, in a press release. “Now we’ve got a new challenge, and we’d like to encourage volunteers old and new to get involved. You don’t have to be an expert — in fact we’ve found not being an expert tends to make you better at this task. There are too many images for us to inspect ourselves, but by asking hundreds of thousands of people to help us we can find out what’s lurking in the data.”

New images available at the Galaxy Zoo website come from large surveys with NASA‘s Hubble Space Telescope as well as ground-based imagery from the Sloan Digital Sky Survey.

“The two sources of data work together perfectly: the new images from Sloan give us our most detailed view of the local universe, while the CANDELS survey from the Hubble telescope allows us to look deeper into the universe’s past than ever before,” says Astronomer and Galaxy Zoo team member Kevin Schawinski from ETH Zurich in Switzerland.

Team members are quick to point out, however, that the quirky nature of the galactic alphabet is not the focus of Galaxy Zoo. Finding unusual galaxies that resemble animals and letters help scientists learn about galaxy interactions as well as the formation and evolution of the biggest structures in the Universe.

Image Credit: Sloan Digital Sky Survey, NASA Hubble Space Telescope and Galaxy Zoo


About the author:John Williams is owner of TerraZoom, a Colorado-based web development shop specializing in web mapping and online image zooms. He also writes the award-winning blog, StarryCritters, an interactive site devoted to looking at images from NASA’s Great Observatories and other sources in a different way. A former contributing editor for Final Frontier, his work has appeared in the Planetary Society Blog, Air & Space Smithsonian, Astronomy, Earth, MX Developer’s Journal, The Kansas City Star and many other newspapers and magazines.

Changing Hues Signal Transition of Seasons at Saturn

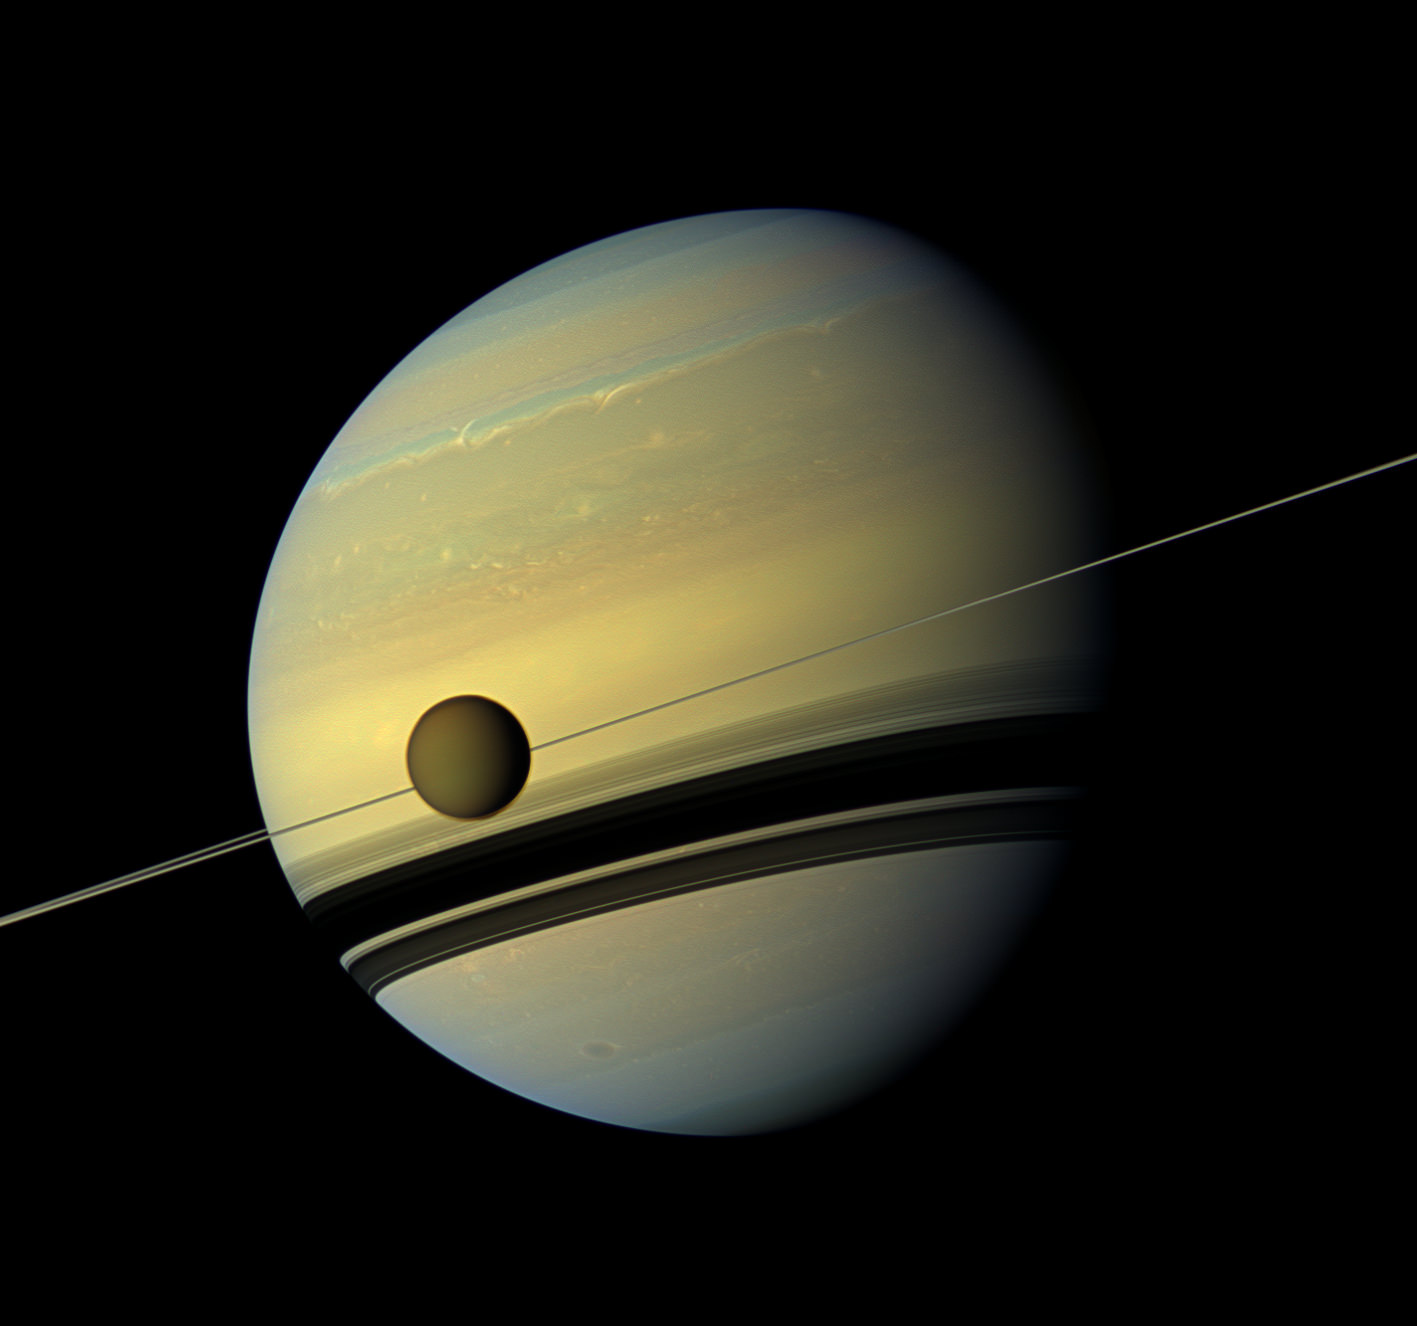
The giant moon Titan passes in front of Saturn in this natural-color, wide-angle view from NASA’s Cassini spacecraft. Image Credit: NASA/JPL-Caltech/SSI

[SPOILER ALERT: Viewing these images will force you to change your computer wallpaper]

Here on Earth, it’s almost time for the burst of fall color that signals the change of seasons in the Northern Hemisphere. Saturn’s color too is transforming subtly as the gas giant slips into a Saturnian spring and autumn as seen in this series of true-color images from NASA’s Cassini spacecraft.

Titan, a moon larger than the planet Mercury, hangs before the rings and changing colors of Saturn in the first of four spectacular images release by NASA and the Cassini Imaging Central Laboratory for Operations (CICLOPS).

“For no other reason than that they are gorgeous, the Cassini imaging team is releasing today a set of fabulous images of Saturn and Titan…in living color…for your day-dreaming enjoyment,” said Carolyn Porco, Cassini imaging team lead based at the Space Science Institute in Boulder, Colordo, in an email blast.

When Cassini arrived at Saturn eight years ago, the planet’s northern hemisphere, locked in winter, showed azure blue. Now as winter passes to the southern hemisphere, the colors are reversing as the blue fades from the north and rises in the south.

“Note that our presence at Saturn for the last eight years has made possible the sighting of subtle changes with time, and one such change is obvious here,” Porco said. “As the seasons have advanced, and spring has come to the north and autumn to the south throughout the Saturn system, the azure blue in the northern winter Saturnian hemisphere that greeted Cassini upon its arrival in 2004 is now fading; and it is now the southern hemisphere, in its approach to winter, that is taking on a bluish hue.”

Scientists believe that the increasing blue color in the south likely is due to the increasing intensity of ultraviolet light from the Sun which produces the haze. Methane in the atmosphere also absorbs light toward the red end of the spectrum while reflecting blue light. This view looks from just above the ring plane with the Sun shining from above casting broad shadows on the colorful clouds of Saturn. The image was taken on May 6, 2012 from about 778,000 kilometers (483,000 miles) from Titan.

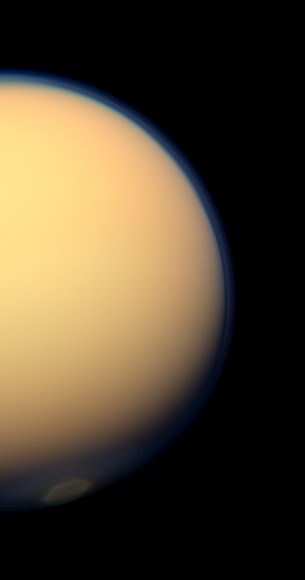
Some of the views, including this image of a vortex at Titan’s south pole are only possible because of a newly tilted, or inclined, orbit that takes Cassini high over the poles of Saturn and its moons. Scientists first noticed the detached mass of clouds over the south pole in March. The swirling mass of the vortex stands out clearly against the golden cloud deck surrounding Titan.

The recently formed south polar vortex stands out against Titan in this natural-color view from NASA’s Cassini spacecraft. Image Credit: NASA/JPL-Caltech/SSI

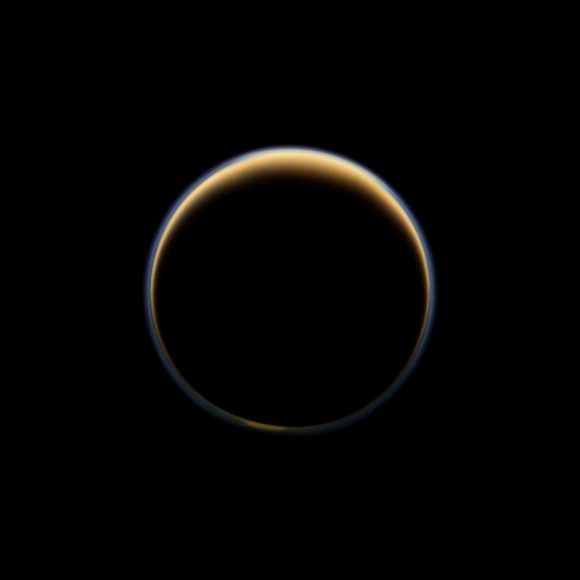
Sunlight scattering through Titan’s atmosphere forms a ring of color as NASA’s Cassini spacecraft cruises along the night side of Saturn’s largest moon. Image Credit: NASA/JPL-Caltech/SSI

A glowing hint of the polar vortex shows in this image looking toward the night-time, Saturn-facing side of Titan. Sunlight scattering through Titan’s atmosphere forms the ring of color in this image taken about 216,000 kilometers (134,000 miles) from Titan.

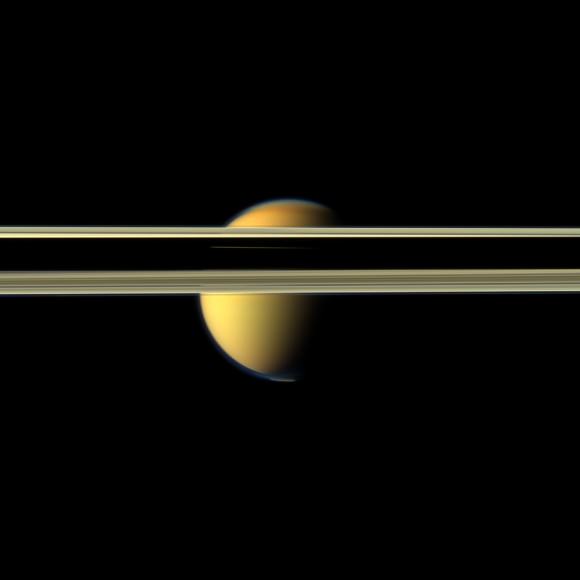
Saturn’s rings cut colorful Titan in half in this image from NASA’s Cassini spacecraft. Image Credit: NASA/JPL-Caltech/SSI

The rings obscure Titan in the final image of the quartet. The image is taken from just above the northern, sunlit side of the ring plane. Saturn’s shadow cast along the rings create the dark swath in the center of the image but if you look close, you can see a tiny sliver of Titan through the Cassini Division, the largest gap in Saturn’s wide rings.

“Cassini has been in orbit now for the last eight years, and despite the fact that we can’t know exactly what the next five years will show us, we can be certain that whatever it is will be wondrous,” said Porco.

About the author: John Williams is owner of TerraZoom, a Colorado-based web development shop specializing in web mapping and online image zooms. He also writes the award-winning blog, StarryCritters, an interactive site devoted to looking at images from NASA’s Great Observatories and other sources in a different way. A former contributing editor for Final Frontier, his work has appeared in the Planetary Society Blog, Air & Space Smithsonian, Astronomy, Earth, MX Developer’s Journal, The Kansas City Star and many other newspapers and magazines.

Take a Trip to Explore Gale Crater

Mount Sharp Compared to Three Big Mountains on Earth

Images from the Curiosity rover on Mars are truly spectacular but a large mosaic from the THEMIS camera aboard NASA’s Mars Odyssey orbiter gives a grand perspective of our new foothold on Mars. Take some time to rove and explore Gale Crater.

The viewer, created using a web-imaging technology from Zoomify, is set to move between points of interest, such as Mars Science Laboratory’s landing site in Aeolis Palus, Glenelg, and Aeolis Mons/Mount Sharp itself. The layered sediments flanking Mount Sharp make it the primary target for Curiosity’s two-year mission. Take control at anytime by clicking on the image. This will stop the automatic roving and leave you in control to explore the terrain of Gale Crater. Use your mouse or the toolbar controls to pan and zoom around the image. You can also use the dropdown in the upper right to take you directly to certain points of interest in the image. Over time, we will add to this interactive feature as more geological points of interest are identified.

THEMIS stands for Thermal Emission Imaging System which is a multiband visible and infrared camera aboard Odyssey. The comprehensive mosaic is pieced together from 205 individual scenes, most taken recently but some dating to 2002 shortly after Odyssey entered Mars orbit in 2001. These images were taken before MSL landed on Mars. Even so, as large as the SUV-sized rover is, it would be too small to see in these images. The smallest details in this image are 18 meters or 60 feet across.

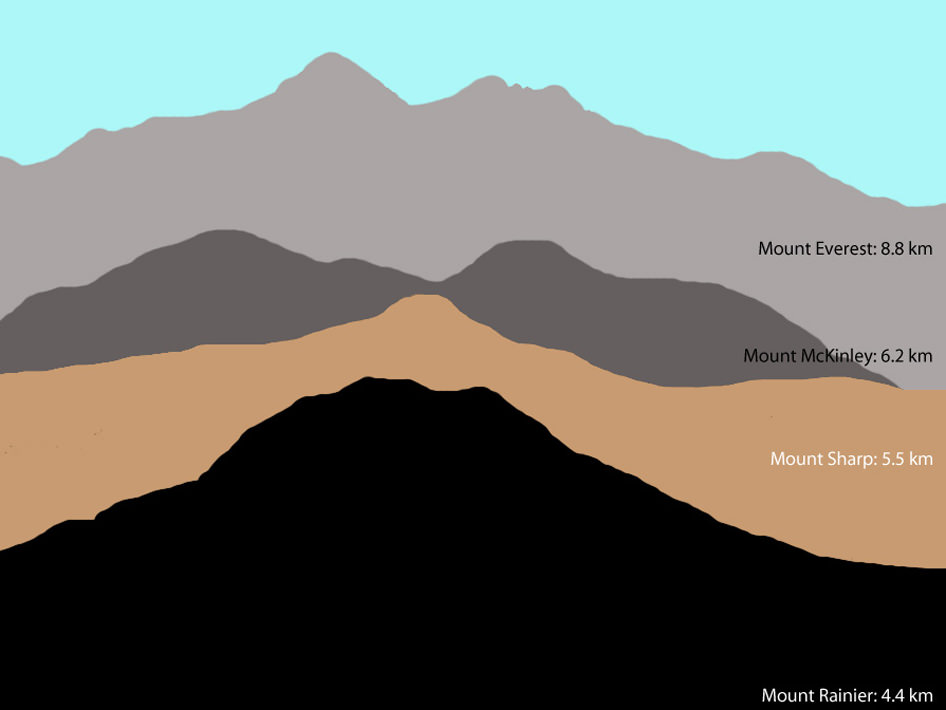
This illustration shows the size of Aoelis Mons (Mount Sharp) in comparison to three large mountains on Earth. The elevation of Mount Sharp is given in kilometers above the floor of Gale Crater. The heights of the Earth mountains are given in kilometers above sea level. Image credit: Tanya Harrison, NASA/JPL-Caltech/MSSS
Gale Crater is 154 kilometers (96 miles) wide. Near the center rises Aeolis Mons, a 5 km (3 mile) high mound of layered sediments, informally dubbed Mount Sharp, after planetary geologist Robert Sharp who died in 2004. Scientists for a time referred to the conical mountain as “The Mound.” The mountain, which would stand among the highest on Earth, cannot be seen from Earth and was unknown before planetary probes visited the Red Planet.

“The reason we decided to assemble such a large, comprehensive mosaic of Gale Crater was to give ourselves a better sense of the context around the landing site, said Jonathon Hill, a Mars research at Arizona State University who assembled the mosaic, a press release. “This will help us to better understand what Curiosity sees and measures as it roves the surface.”

Gale Crater zoom tour created by John Williams (TerraZoom) using Zoomify.

About the author: John Williams is owner of TerraZoom, a Colorado-based web development shop specializing in web mapping and online image zooms. He also writes the award-winning blog, StarryCritters, an interactive site devoted to looking at images from NASA’s Great Observatories and other sources in a different way. A former contributing editor for Final Frontier, his work has appeared in the Planetary Society Blog, Air & Space Smithsonian, Astronomy, Earth, MX Developer’s Journal, The Kansas City Star and many other newspapers and magazines.

Hubble’s Hidden Treasures Unveiled

A quick check of Hubble’s gallery shows just 1,300 images; however more than raw 700,000 images reside in a vast archive with hundreds of potentially jaw-dropping astronomical scenes just waiting to be uncovered. That was the idea behind the European Space Agency’s international contest called Hubble’s Hidden Treasures. And now with the hard work of amateur astronomers and more than 3,000 submissions, some of Hubble’s incredible celestial treasures are revealed.

“The response was impressive, with almost 3000 submissions,” the ESA said in a press release. “More than a thousand of these images were fully processed: a difficult and time-consuming task. We’ve already started featuring the best of these in our Hubble Picture of the Week series.”

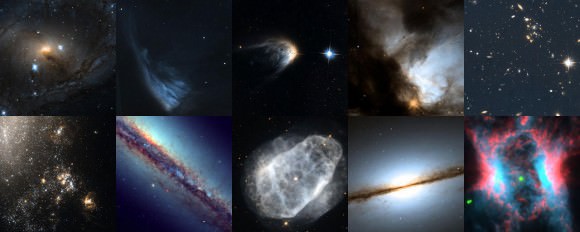
The top 10 images selected in the Hubble Hidden Treasures basic imaging category. Top row: NGC 6300 by Brian Campbell, V* PV Cephei by Alexey Romashin, IRAS 14568-6304 by Luca Limatola, NGC 1579 by Kathlyn Smith, B 1608+656 by Adam Kill Bottom row: NGC 4490 by Kathy van Pelt, NGC 6153 by Ralf Schoofs, NGC 6153 by Matej Novak, NGC 7814 by Gavrila Alexandru, NGC 7026 by Linda Morgan-O’Connor

Credit: NASA & ESA

Judges ranked images from two categories, an image processing category and basic image searching category. Judges sifted through 1189 entries in the image processing category; a painstaking process of finding promising data and creating an attractive image using professional imaging software. But even if contestants didn’t have the technical know-how to create large mosaics and combine color filters, they could find stunning images in the Hubble archive using using simple online tools. The ESA received more than 1600 entries in this category.

“Every week, we search the archive for hidden treasures, process the scientific data into attractive images and publish them as the Hubble Picture of the Week,” says the ESA on their Hidden Treasures website. “But the archive is so vast that nobody really knows the full extent of what Hubble has observed.”

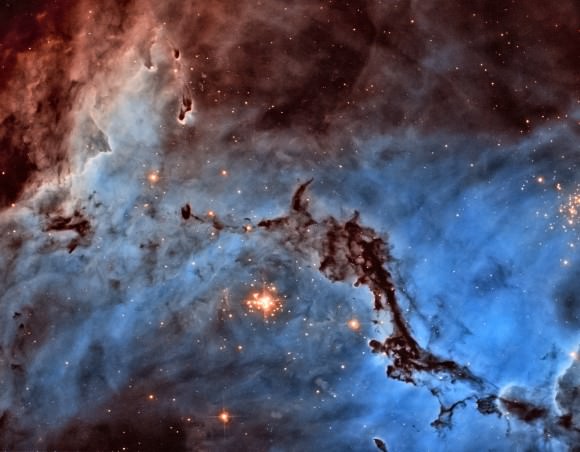
Josh Lake of the United States won with this awesome image of NGC 1763, part of the N11 star-forming region of the Large Magellanic Cloud.

First place in the processed category, which asked contestants to find promising data within the archive and process that scene into an attractive image, went to Josh Lake, from the United States. The image, which won the public vote, narrowly edged out other images. Lake produced a bold two-color image that is not in natural colors but contrasts light from glowing hydrogen and nitrogen. In natural colors, the two glowing gasses produce almost indistinguishable shades of red. Lake’s image separates them out into red and blue offering a dramatic view of the structure.

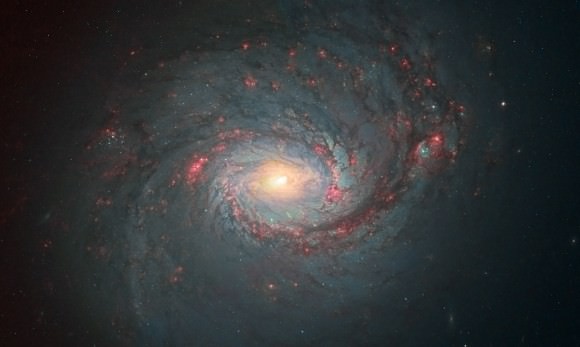
Messier 77 produced by Andre van der Hoeven, of the Netherlands came in a close second.

Andre van der Hoeven of the Netherlands came in a close second. The jury noted the impressive nature of Messier 77 in the image as well as the processing which combines several datasets from separate instruments to create the amazing image.

“This was my hardest job until now,” van der Hoeven says on the Flickr page. “Combining the different datasets to get equal colors was really hard. M77 was not fully covered by one dataset, so I had to combine channels of the WFPC2 with different wavelengths and tune the colors to get them to fit. But the result is in my opinion quite astonishing.”

We are as surprised as him that this image had not been released before.

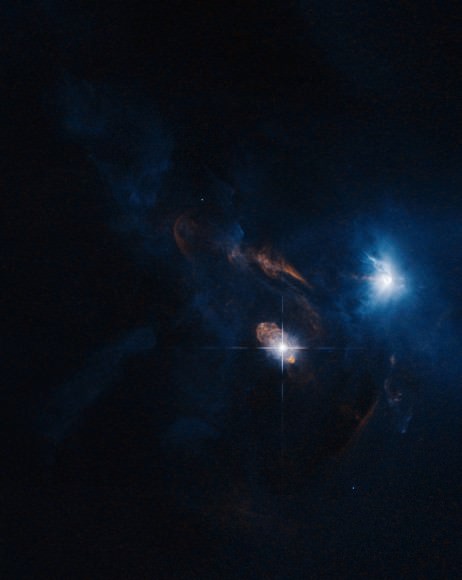
Judy Schmidt of the United States entered this image of XZ Tauri, a new star lighting up a nearby cloud of gas and dust. She entered several images into the contest.

Third place went to an interesting image of XZ Tauri, a newborn star spraying gas into its surroundings as well as lighting up a nearby cloud of gas. The panel said it was a challenging dataset to process because Hubble captured only two colors in the region. “Nevertheless, the end result is an attractive image, and an unusual object that we would never have found without her help,” the panel said.

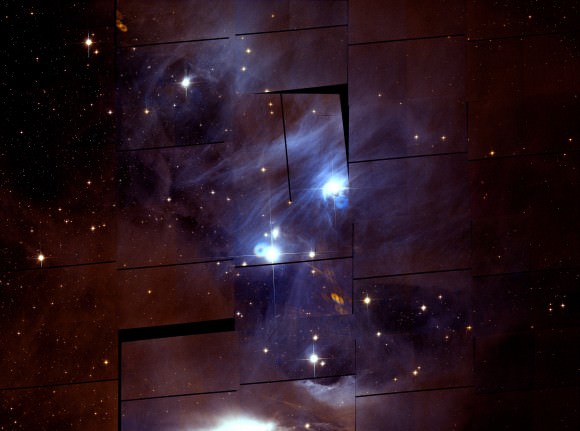
Revealing the challenge of many Hubble mosaics, the jury was impressed with the technical achievement Renaud Houdinet showed in putting together this ambitious view. He called this “The Great Mosaic Disaster in Chamaeleon. “Sometimes, things don’t turn out as they ought,” Houdinet admits on the Flickr description. Chamaeleon 1 is a large nebula near the south celestial pole and was not covered in one single Hubble image.

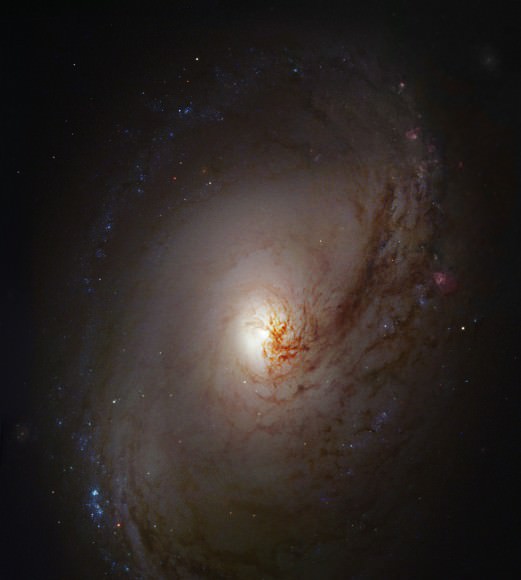
Robert Gendler took fifth place with an image of spiral galaxy Messier 96. You may know Gendler’s work as his version of Hubble’s image of NGC 3190 is the default image on the desktop of new Apple computers.

Top image caption: Top ten images selected in the Hubble Hidden Treasures image processing competition. Top row: NGC 1763 by Josh Lake, M 77 by Andre van der Hoeven, XZ Tauri by Judy Schmidt, Chamaeleon I by Renaud Houdinet, M 96 by Robert Gendler. Bottom row: SNR 0519-69 by Claude Cornen, PK 111-2.1 by Josh Barrington, NGC 1501 by kyokugaisha1, Abell 68 by Nick Rose, IC 10 by Nikolaus Sulzenauer. Credit: NASA & ESA

Links:

About the Author: John Williams is owner of TerraZoom, a Colorado-based web development shop specializing in web mapping and online image zooms. He also writes the award-winning blog, StarryCritters, an interactive site devoted to looking at images from NASA’s Great Observatories and other sources in a different way. A former contributing editor for Final Frontier, his work has appeared in the Planetary Society Blog, Air & Space Smithsonian, Astronomy, Earth, MX Developer’s Journal, The Kansas City Star and many other newspapers and magazines.

Want To Live On Mars Time? There’s An App For That

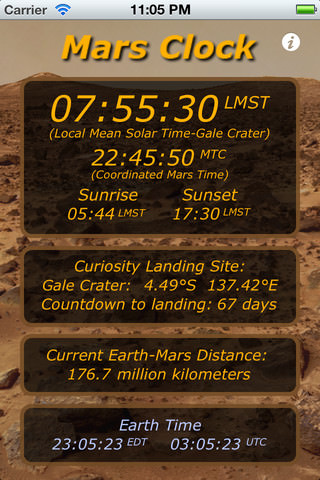
Screenview from Mars Clock, available from the Apple Store, that displays Mars time.

You’ve listened to all of JPL’s Curiosity telecons, you can recite the nail-biting sequence of events during MSL’s “Seven Minutes of Terror,” and you’ve devoured thousands of pixels of image data beamed back to Earth. But are you ready to live on Mars time? With a couple of well-timed apps from Google Play and Apple’s app store, you can.

MarsClock, available for Android devices at Google play is a free app written by Scott Maxwell, rover driver for Curiosity. The app, which has been downloaded between 1,000 and 5,000 times, lets you see times for all three of NASA’s Mars Rovers, Spirit, Opportunity and Curiosity. The app allows the user to set single alarms or alarms that repeat every sol. A sol is a full Martian day which is about 24 hours, 39 minutes in Earth time.

Perhaps you shun Android devices for your Apple device whether it’s an iPhone, iPad or iPod. Never fear, you too can be everyone’s favorite Martian living on Mars time. Mars Clock, by SunlightAndTime, is a 99-cent app that displays Mars time and a host of other Mars time goodies. Features include local mean solar time for the rover, coordinated Mars time, sunrise and sunset times for the Curiosity landing site (I think this might be the coolest feature), current season, a countdown to landing feature (which is counting up since MSL landed on Mars on August 5th), current Earth time, a distance calculator between the Earth and Mars and radio communications delay estimate.

While it might be hard to add 40 minutes to your day to live as a Martian or as the JPL team that operates the Curiosity rover, these apps sure do make it more fun.

Seeking the Moon’s Rare Atmosphere

Using the dim light of distant stars reflecting off of the surface of the Moon, scientists using a spectrometer aboard NASA’s Lunar Reconnaissance Orbiter have found traces of the Moon’s tenuous atmosphere. But don’t expect to take off your protective spacesuit. The Moon’s atmosphere is made of helium.

“The question now becomes, does the helium originate from inside the Moon, for example, due to radioactive decay in rocks, or from an exterior source, such as the solar wind.” says Dr. Alan Stern, LAMP principal investigator and associate vice president of the Space Science and Engineering Division at Southwest Research Institute, Boulder, Colo.

Scientists designed the Lyman Alpha Mapping Project (LAMP) spectrometer aboard LRO to map the lunar surface but the confirmation that helium surrounds Earth’s largest natural satellite was a bonus, Stern told Universe Today.

“LAMP was designed to simply do what we had not done in 40 years; to look closely at the surface of the Moon,” Stern said. “This really is a breakthrough, a capability discovery.”

LAMP’s findings support work done by the Lunar Atmosphere Composition Experiment, or LACE, that was left behind by Apollo 17 astronauts in 1972. LAMP is designed to examine far ultraviolet emissions in the tenuous atmosphere above the Moon’s surface.

Some elements found on the Moon, such as carbon or sodium, can be studied from Earth. Helium is not one of these, Stern says. Helium only shows very weakly in the far ultraviolet part of the spectrum. The signature is too weak to be seen from the 250,000 miles separating the Moon from Earth. Earth’s ozone layer also absorbs ultraviolet radiation making detection from ground-based detectors impossible.

And with LAMP moving over the lunar surface, we can see more than we’d see with a simple lander, Stern said.

During its mission, LACE detected argon but so far only helium has been confirmed from LAMP’s spectrograph. Although, the noble gas argon is much fainter than helium to the spectrograph, LAMP will seek this and other gases as well.

John Williams is a science writer and owner of TerraZoom, a Colorado-based web development shop specializing in web mapping and online image zooms. He also writes the award-winning blog, StarryCritters, an interactive site devoted to looking at images from NASA’s Great Observatories and other sources in a different way. A former contributing editor for Final Frontier, his work has appeared in the Planetary Society Blog, Air & Space Smithsonian, Astronomy, Earth, MX Developer’s Journal, The Kansas City Star and many other newspapers and magazines.

Look at the Size of that Thing! – A Close Look at Odysseus Crater

Credit: NASA/JPL/Space Science Institute

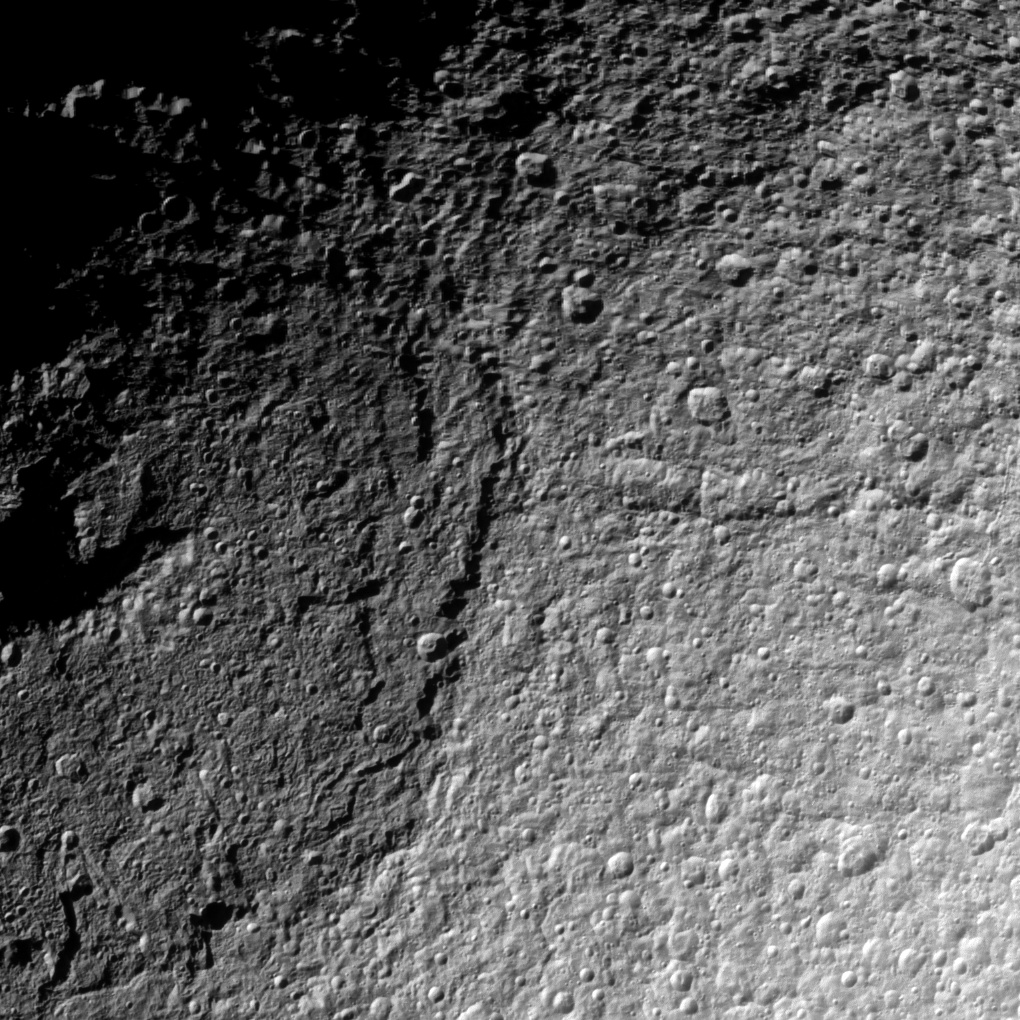
Behold the battered terrain of the massive crater Odysseus in this new image from Cassini.

Check out the cassinified image of the fractured surface

When Voyager first imaged the huge Herschel Crater on Mimas, scientists could not help comparing the small and battered moon to the Death Star in George Lucas’ science-fiction adventure Star Wars. But Saturn’s moon Tethys is also home to a massive crater; the remains of an ancient impact that nearly destroyed the tiny moon. Odysseus Crater dominates the surface of Tethys covering two-thirds of the surface. The tiny moon is just 1062 kilometers, or 660 miles, across. Using information from Voyager and Cassini, scientists found that the heavily cratered and fractured moon is made up of mostly water ice with a small amount of rock.

Odysseus Crater takes up the entire left side of this image.

With the Sun over Cassini’s shoulder, the spacecraft took this image of the northern part of Odysseus June 28, 2012 while the spacecraft zipped along just 72,000 kilometers (45,000 miles) above Tethys. If you’re interested, the resolution of this image is about 430 meters (1,409 feet) per pixel; meaning that one pixel takes up 430 meters in the image.

John Williams is a science writer and owner of TerraZoom, a Colorado-based web development shop specializing in web mapping and online image zooms. He also writes the award-winning blog, StarryCritters, an interactive site devoted to looking at images from NASA’s Great Observatories and other sources in a different way. A former contributing editor for Final Frontier, his work has appeared in the Planetary Society Blog, Air & Space Smithsonian, Astronomy, Earth, MX Developer’s Journal, The Kansas City Star and many other newspapers and magazines.

Which Planet is This? A Gale Crater Doppelganger

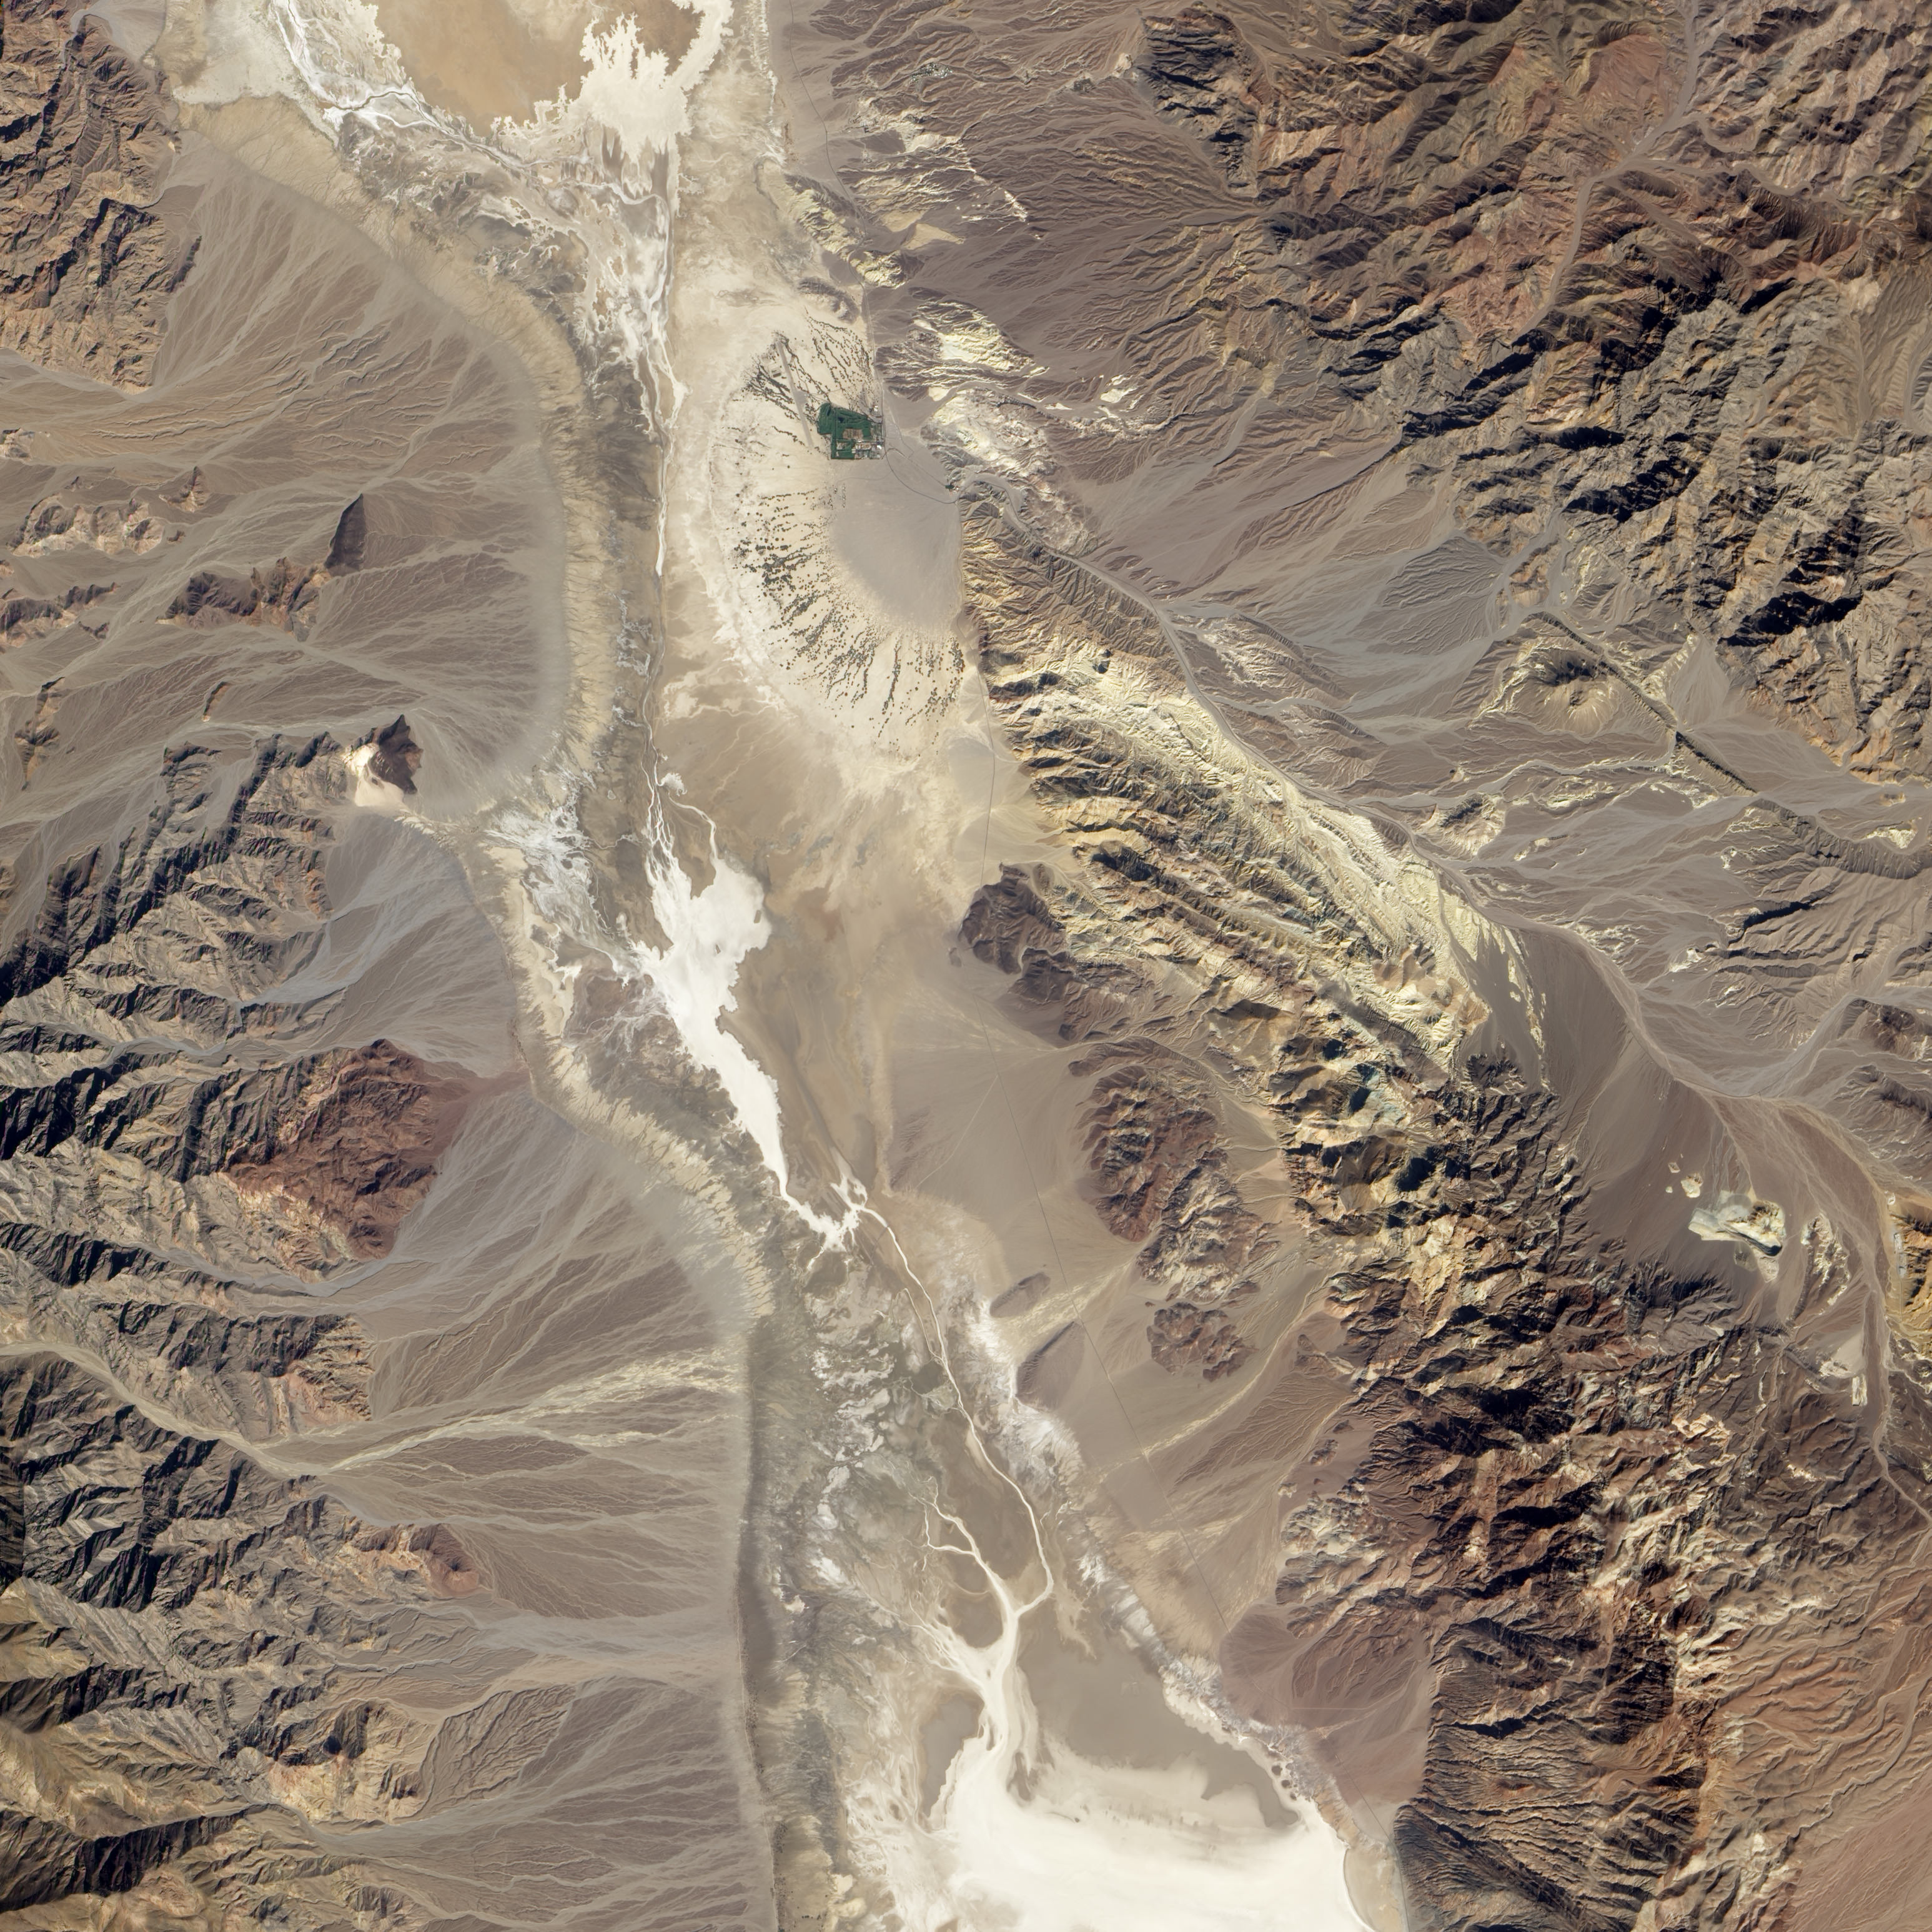
The Badwater Basin region of California’s Death Valley acquired by NASA’s Earth Observing-1 satellite (EO-1) on October 23, 2002. Alluvial fans in the image are remarkably similar to the terrain that the Curiosity rover will explore on Mars. Image and annotations from NASA Earth Observatory

Leave it to NASA’s Earth Observtory folks to come up with a terrestrial image that captures the familiar terrain the car-sized rover Curiosity will explore on Mars.

“You would really be forgiven for thinking that NASA was trying to pull a fast one on you, and we actually put a rover out in the Mojave Desert and took a picture,” said project scientist John Grotzinger during a recent press conference.

Curiosity set down along a fan-shaped apron of dirt and debris known as an alluvial fan. The landform likely formed when liquid water flowed down the side of Gale Crater through a network of stream channels and valleys onto the crater floor. Although no liquid water seems to exist on the surface of Mars, the tell-tale traces of liquid water’s flow is abundant.

Gaze down onto the Badwater Basin area of California’s Death Valley National Park in this image from NASA’s Earth Observing-1 Satellite (EO-1). Take a peek at the earthimagified version. Alluvial fans are abundant in this image. Occasional storms send flash floods rushing down canyons in this arid landscape. The water transports sediment from the mountains and deposits them in the fan-shaped patterns we see in the image. The white region to the left of the image is a salt flat; the remains of a dried up lake. Scientists note that Gale Crater is also a basin with no outlets so water that pooled in the crater may leave behind similar salts and deposits.

The NASA site also points out that many features, including wind, volcanism, and alternating wet and dry conditions, make this area a perfect laboratory for planning missions to Mars. In fact, a dark patch just north of the large alluvial fan to the left of the image is called Mars Hill due to its similarity to features seen at the Viking 1 landing site. Viking 1 landed on Mars July 20, 1976.

There is a primary difference between the landscapes and features of Gale Crater and Badwater Basin and that is age. The features of Death Valley are billions of years younger than those found on Mars and the site continues to be shaped by water. Scientists believe water stopped flowing on Mars billions of years ago; the sediments deposited by ancient rivers on Mars buried by eons of wind-driven erosion.

John Williams is a science writer and owner of TerraZoom, a Colorado-based web development shop specializing in web mapping and online image zooms. He also writes the award-winning blog, StarryCritters, an interactive site devoted to looking at images from NASA’s Great Observatories and other sources in a different way. A former contributing editor for Final Frontier, his work has appeared in the Planetary Society Blog, Air & Space Smithsonian, Astronomy, Earth, MX Developer’s Journal, The Kansas City Star and many other newspapers and magazines.