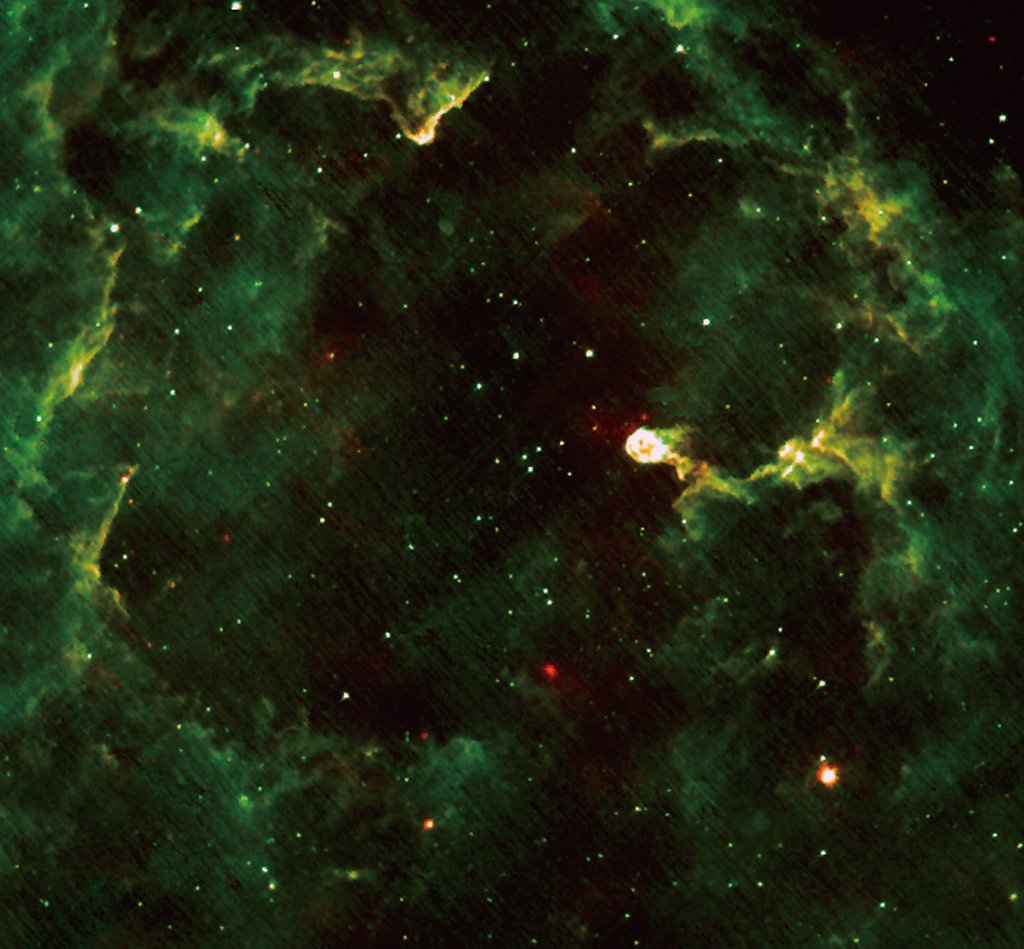
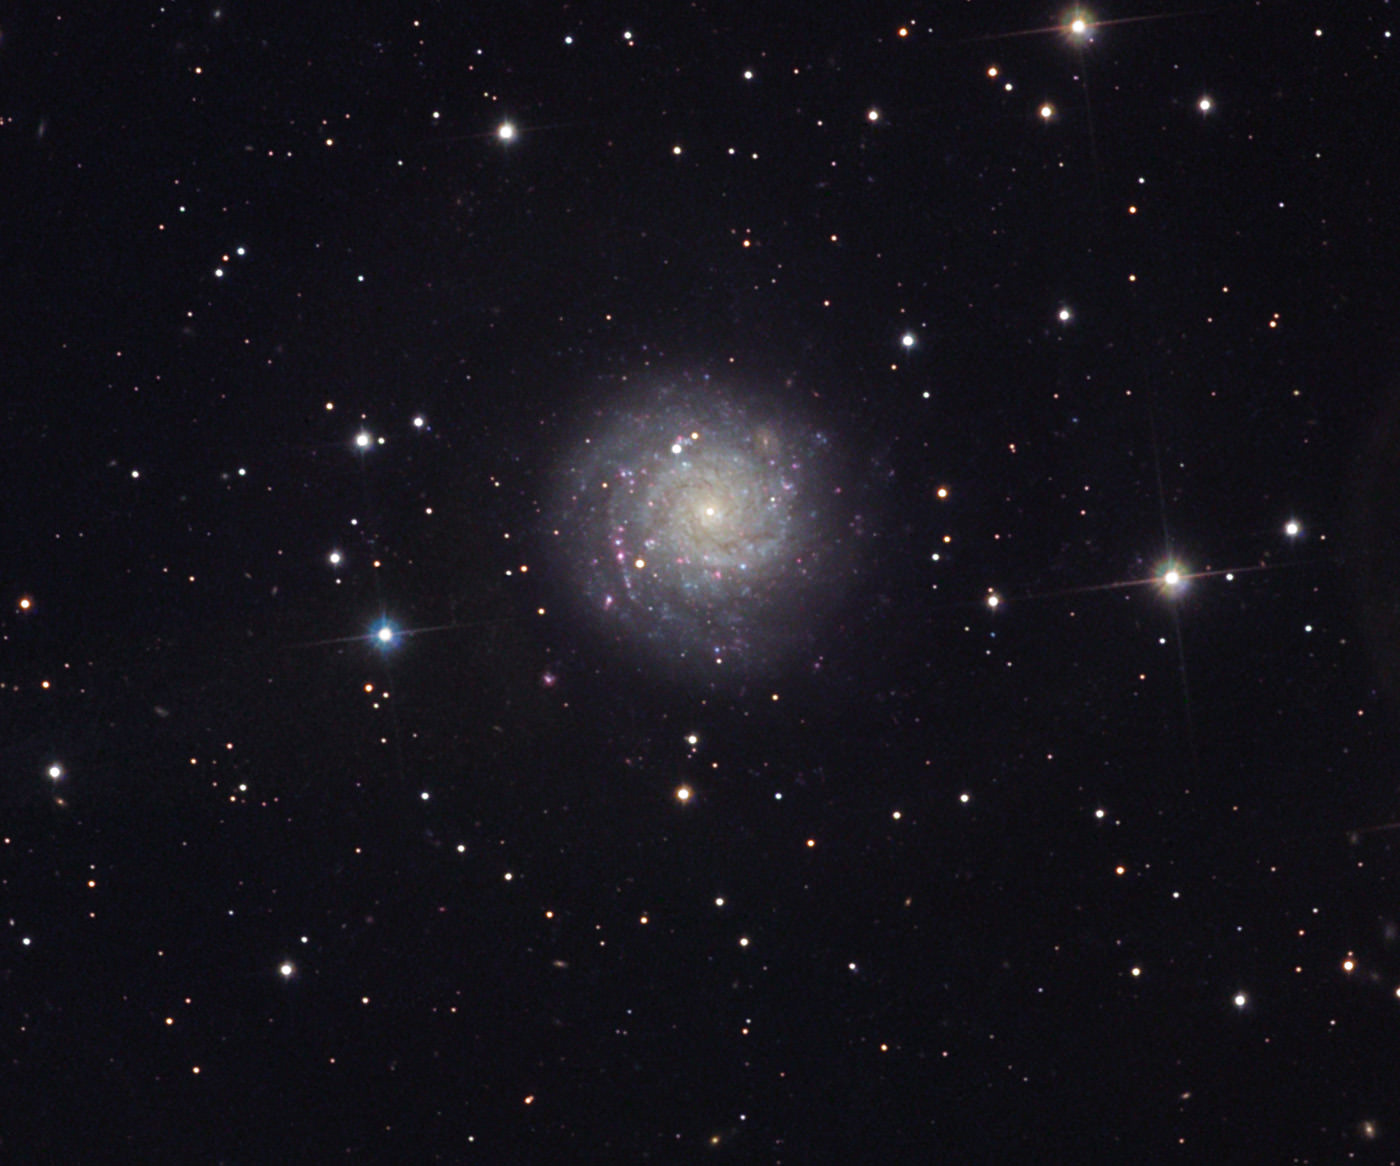
What was SN 1961V?

NGC 1058. Image credit: Bob Ferguson and Richard Desruisseau/Adam Block/NOAO/AURA/NSF

[/caption]

Up there in the sky! It’s a supernova! It’s a Luminous Blue Variable eruption! It’s…. well, we’re not sure….

In July of 1961, a star in the spiral galaxy NGC 1058 blew up, but in a very odd fashion. The time to reach its peak brightness was several months as well as a slow decline including a three year plateau. Narrow spectral lines revealed a slow expansion velocity of 2,000 km sec-1. Some proposed it was an unusual supernova. Others claimed it was an especially energetic eruption of a Luminous Blue Variable (LBV) star like Eta Carinae. The infamous Fritz Zwicky called it a “Type V Supernova” which meant a supernova in name only, but could be anything as it was simply an “impostor”. For nearly 50 years, astronomers have been trying to sort out what this supernova impostor truly was.

One front on which much of the effort has focused is on the nature of the star before the explosion. The host galaxy is a beautiful face on spiral galaxy and was a tempting target for many observations well before the eruption. This has allowed astronomers to use archival images to determine properties of the parent star. And what a whopper it was. The star had an absolute magnitude near -12! Even Eta Carinae, one of the most massive stars currently known, only has an absolute magnitude of around -5.5. This extreme luminosity led astronomers towards early estimates for its mass to be as much as a staggering 2,000 M! While this is certainly incorrect, it still reveals just how massive SN 1961V’s progenitor truly was. Most estimates now put it in the range of 100 – 200 M.

A key difference between a supernova and an eruption is the remnant. In the case of a supernova, it is expected that the result would be a neutron star or black hole. If the object were an eruption, even a large one, the star would remain intact. In this vein, many astronomers have also attempted to inspect the remnant. However, due to the shell of gas and dust created in either scenario, imaging the objects has proven to be a challenge. While prior to the event, the culprit stuck out like a sore thumb, the remnant is lost in a haze of other stars.

Numerous telescopes have been aimed at the region to attempt to ferret out the leftovers including the powerful Hubble, but many attempts have remained inconclusive. Recently, the Spitzer Space telescope was employed to study the region, and although not intended for studying individual stars, its infrared vision can allow it to pierce the veil of dust and potentially find the source responsible. If there is still an intense IR source, it would mean the star survived, and the supernova truly was an impostor.

This attempt at identification was recently undertaken by a team of astronomers from Ohio State University, led by Christopher Kochanek. Upon inspection, the team was unable to conclusively identify a source with sufficient intensity as to be a survivor of the SN 1961V event. As such, the team concluded that the event Zwicky defined as a “supernova impostor” was a “‘supernova impostor’ impostor”.

The team compared it to another recent supernova, SN 2005gl, which also had a supermassive progenitor and was observed prior to detonation. Previous studies of this supernova suggested that, just prior to the explosion itself, the star underwent a heavy phase of mass loss. If a similar scenario occurred in 1961V, it could explain the unusual expansion velocity. During this time, the star may quake ferociously, imitating LBV eruptions which could explain the pre-nova plateau.

While this comparison relies on a single strongly similar case, it underscores the need “that studies of SN progenitors should evolve from simple attempts to obtain a single snapshot of the star to monitoring their behavior over their final years.” Hopefully, future studies and observations will provide better theoretical simulations and the numerous large surveys will provide sufficient data on stars prior to eruption to better constrain the behavior of these monsters.

Herschel Provides Gravitational Lens Bonanza

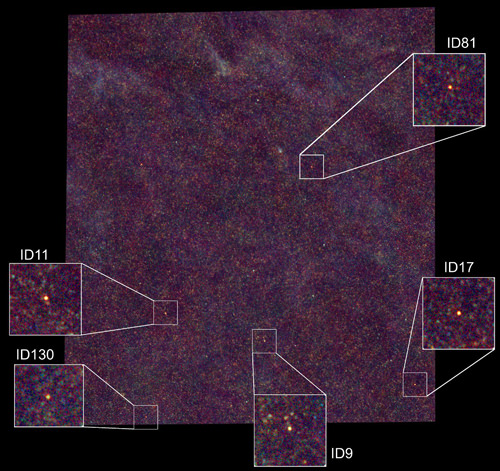
The image shows the first area of sky viewed as part of the Herschel-ATLAS survey. The five inset show enlarged views of the five distant galaxies whose images are being gravitationally lensed by foreground galaxies (unseen by Herschel). The distant galaxies are not only very bright, but also very red in colour in this image, showing that they are brighter at the longer wavelengths measured by the SPIRE instrument. Image credits: ESA/SPIRE/Herschel-ATLAS/SJ Maddox (top); ESA/NASA/JPL-Caltech/Keck/SMA (bottom).

[/caption]

One of the predictions of Einstein’s predictions from general relativity was that gravity could distort space itself and potentially, act as a lens. This was spectacularly confirmed in 1919 when, during a solar eclipse, Arthur Eddington observed stars near the Sun were distorted from their predicted positions. In 1979, this effect was discovered at much further distances when astronomers found it to distort the image of a distant quasar, making one appear as two. Several other such cases have been discovered since then, but these instances of gravitational lensing have proven difficult to find. Searches for them have had a low success rate in which less than 10% of candidates are confirmed as gravitational lenses. But a new method using data from Herschel may help astronomers discover many more of these rare occurrences.

The Herschel telescope is one of the many space telescopes currently in use and explores the portion of the spectrum from the far infrared to the submillimeter regime. A portion of its mission is to produce a large survey of the sky resulting in the Herschel ATLAS project which will take deep images of over 550 square degrees of the sky.

While Herschel explores this portion of the electromagnetic spectrum in far greater detail than its predecessors, in many ways, there’s not much to see. Stars emit only very faintly in this range. The most promising targets are warm gas and dust which are better emitters, but also far more diffuse. But it’s this combination of facts that will allow Herschel to potentially discover new lenses with improved efficiency.

The reason is that, although galaxies lack strong emission in this regime in the modern universe, ancient galaxies gave off far more since during the first 4 billion years. During that time, many galaxies were dominated by dust being warmed by star formation. Yet due to their distance, they too should be faint… Unless a gravitational lens gets in the way. Thus, the majority of small, point-like sources in the ALTAS collection are likely to be lensed galaxies. As Dr Mattia Negrello, of the Open University and lead researcher of the study explains, “The big breakthrough is that we have discovered that many of the brightest sources are being magnified by lenses, which means that we no longer have to rely on the rather inefficient methods of finding lenses which are used at visible and radio wavelengths.”

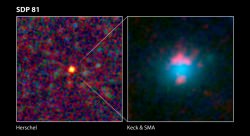
These panels show a zoom of one of the lenses, with high resolution images from Keck (optical light, blue) and the submillimeter Array (sub-millimetre light, red). Image credits: ESA/NASA/JPL-Caltech/Keck/SMA

Already, this new technique has turned up at least five strong candidates. A paper, to be published in the current issue of Science discusses them. Each of them received followup observations from the Z-Spec spectrometer on the California Institute of Technology Submillimeter Observatory. The furthest of these these objects, labeled as ID81, showed a prominent IR spectral line had a redshift of 3.04, putting it at a distance of 11.5 billion lightyears. Additionally, each system showed the spectral profile of the foreground galaxy, demonstrating that the combined light received was indeed two galaxies and the bright component was a gravitational lens.

This method of using gravitational lenses will allow the Herschel team to probe distant galaxies in detail never before achieved. As with all telescopes, longer wavelengths of observations result in less resolution which means that, even if one of the distant systems were to be broken into distinct portions, Herschel would be unable to resolve them. But the fact that we can see them at all means their spectral signatures of the galaxies as a whole can still be studied. Additionally, as Professor Steve Eales from Cardiff University and the other leader of the survey noted: “We can also use this technique to study the lenses themselves.” This potential to explore the mass of the nearby galaxies may help astronomers to understand and constrain the enigmatic Dark Matter that makes up ~80% of the mass in our universe.

Dr Loretta Dunne of Nottingham University and joint-leader of the Herschel-ATLAS survey adds, “What we’ve seen so far is just the tip of the iceberg. Wide area surveys are essential for finding these rare events and since Herschel has only covered one thirtieth of the entire Herschel-ATLAS area so far, we expect to discover hundreds of lenses once we have all the data. Once found, we can probe the early Universe on the same physical scales as we can in galaxies next door.”

Hartley 2 Spawns Meteor Shower

Universe Image Gallery

[/caption]

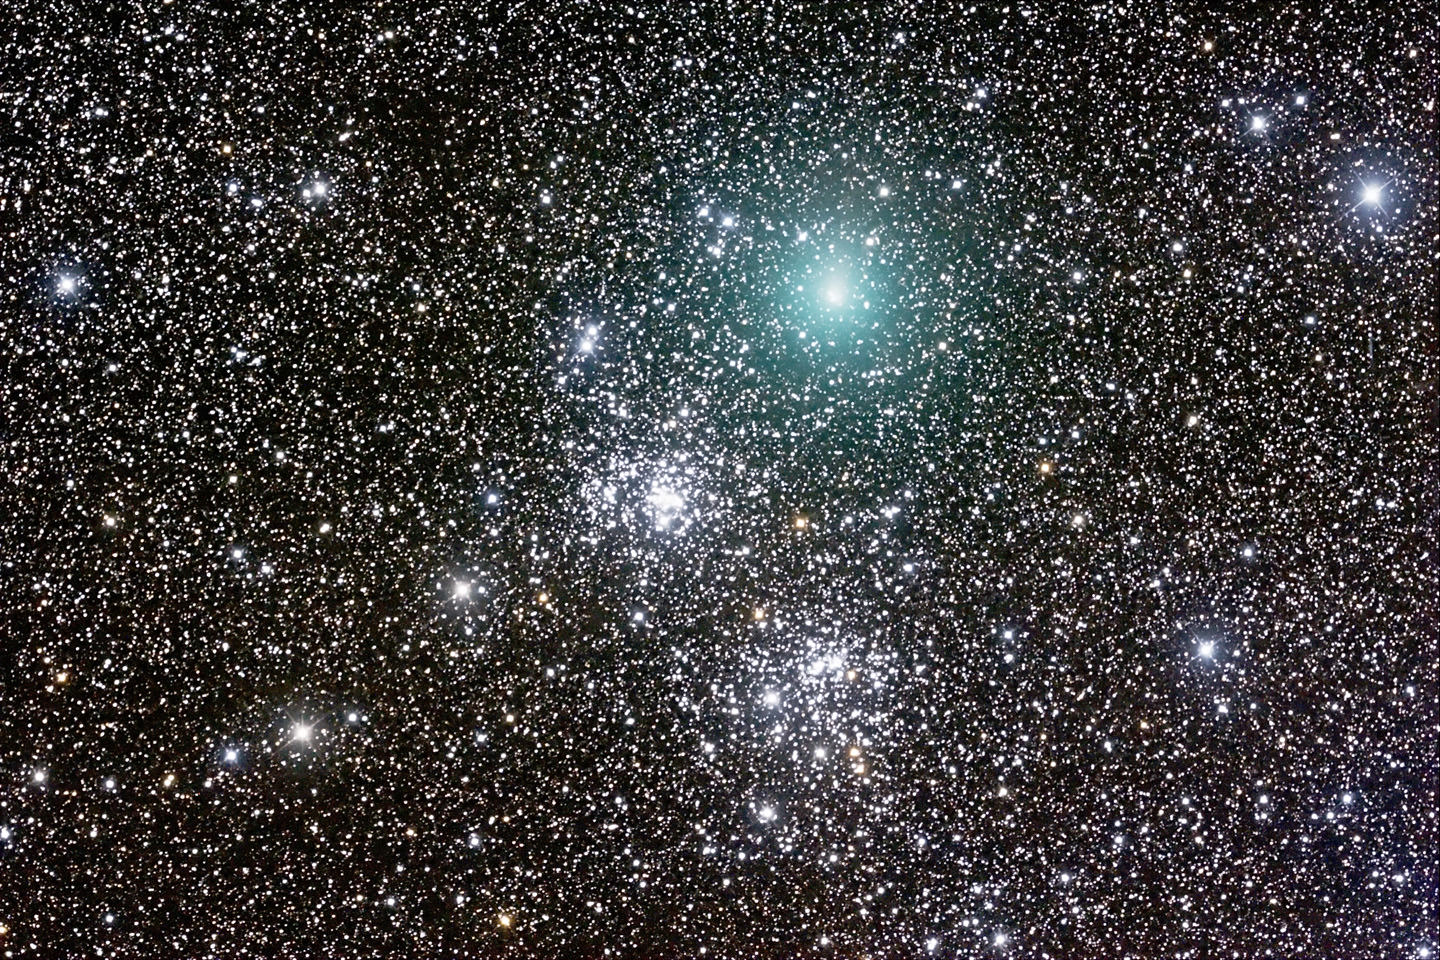
The comet of the year for 2010 seems to be Hartley 2. Although this comet is receding from Earth now (its closest approach was in the latter half of October) and growing fainter, it seems to have left us with one last hurrah: The spawning a brief meteor shower.


Although other comets, such as 2009 R1 (McNaught) and 2P/Encke have passed earlier this year, none has presented an especially tempting target for amateur astronomers (both McNaught and Encke were too close to the Sun during perihelion to be easily observed). Additionally, Hartley is the target of a flyby of the Deep Impact probe bringing it further attention.

Meanwhile, observationally, the comet has been somewhat difficult to observe. I went out on October 17th to hunt for it with a 4″ telescope, but despite my best efforts, couldn’t find it. Although the comet was predicted to reach 5th magnitude, the growing nucleus has apparently become so diffuse, reaching over 1° in the sky, that it’s hard to spot. Undeterred, I attempted again this past weekend with my 8″ SCT. Again, my attempts were frustrated. Even a 15 second exposure with my camera barely brought out more than a smudge.

Yet that night we observed several bright meteors radiating from near Cassiopeia which is where Hartley had been a few weeks prior. We checked to ensure there weren’t any other annual meteor showers from that region. Sure enough, there weren’t, and we wondered if there might be a connection between Hartley’s passing and the meteors we witnessed.

Sure enough, just such a shower was a predicted possibility. Whether or not the shower would occur would depend on just how much dust Hartley had given off in the past and how diffuse the cloud had grown (on this pass and others) since its closest approach to Earth was still 12 million km. Although the meteors my friends and I witnessed were notable (around 2nd to 3rd magnitude) they came from the wrong direction. Meteors spawning from Hartley should have a radiant in Cygnus, the swan. But while ours may not have caught these “Hartley-ids”, others have been witnessing a far grander show in the past few nights that seem to come from the right direction.

In Seascape California, Helga Cabral caught a bright fireball. “I saw a bright white ball and tail, arcing towards the ocean. It was quite beautiful and it looked like it was headed out to sea and so picture perfect it could have been a movie!” A similar fireball was reported the same night near Boston, Massachusetts by Teresa Witham. The predicted peak of this shower occurs tonight so if you have a chance and clear skies, go out and look. As with most showers, there may be some stragglers just before and after so you may be able to catch some for the next few nights if conditions tonight aren’t favorable.

Meteors from Hartley 2 will have a relatively low velocity upon entering our atmosphere since the comet is traveling roughly in the same direction. As such, the expected velocity as it hits our planet is a mere 7 miles a second. The result of this is that they will likely travel slowly across the sky, taking perhaps as much as a few seconds. In contrast, the Leonid showers coming later this month have a relative velocity of 45 miles per second, which causes the meteors to streak across the entire sky in less than a second. The lower velocity for the Hartley-ids will also mean they won’t undergo as much frictional heating and will likely glow fainter shades of reds and yellows.

What Hanny’s Voorwerp Reveals About Quasar Deaths

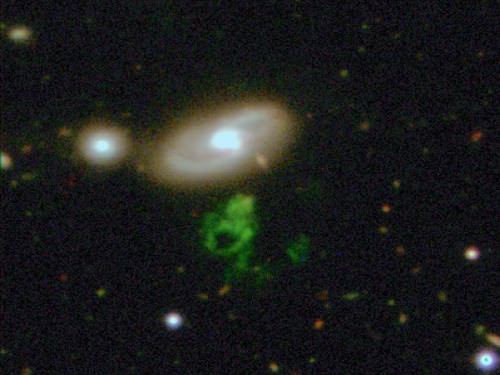
The green "blob" is Hanny's Voorwerp. Credit: Dan Herbert, Peter Smith, Matt Jarvis, Galaxy Zoo Team, Isaac Newton Telescope

[/caption]

Hanny’s Voorwerp is a popular topic of conversation due to its novel discovery by Hanny Van Arkel perusing images from the Galaxy Zoo project. The tale has become so well known, it was made into a comic book (view here as .pdf, 35MB). But another aspect of the story is how enigmatic the object is. Objects that are so green are rare and it lacked a direct power source to energize it. It was eventually realized a quasar in the neighboring galaxy, IC 2497 could supply the necessary energy. Yet images of the galaxy couldn’t confirm a sufficiently energetic quasar. A new paper discusses what may have happened to the source.


The evidence that a quasar must be involved comes from the green color of the voorwerp itself. Spectra of the object has shown that this coloration is due to a strong level of ionized oxygen, specifically the λ5007 line of O III. While other scenarios could account for this feature alone, the spectra also contained He II emission as well as Ne V and the lines were especially narrow. Should star formation or shockwaves energize the gas, the motions would cause Doppler broadening. An quasar powered Active Galactic Nucleus (AGN) was the best fit.

But when telescopes searched for this quasar in the galaxy, it proved elusive. Optical images from WIYN Observatory were unable to resolve the expected point source. Radio observations discovered an object emitting in this range, but far below the amount of energy necessary to power the luminous Voorwerp. Two solutions have been proposed:

“1) the quasar in IC 2497 features a novel geometry of obscuring material and is obscured at an unprecedented level only along our line of sight, while being virtually unobscured towards the Voorwerp; or 2) the quasar in IC 2497 has shut down within the last 70,000 years, while the Voorwerp remains lit up due to the light travel time from the nucleus.”

Recent observations from Suzaku have ruled out the first of these possibilities due to the lack of potassium absorption that would be expected if light from the galaxy were being absorbed in a significant amount. Thus, the conclusion is that the AGN has dropped in total output by at least two orders of magnitude, but more likely by four. In many ways, this is not entirely unexpected since quasars are plentiful in the distant universe where raw material on which to feed was more plentiful. In the present universe, quasars rarely have such material available and can’t maintain it indefinitely.

Analogs exist within our own galaxy. X-Ray Binaries (XRBs) are stellar mass black holes which form similar accretion disks and can shut down and excite on short timescales (~1 year). The authors of the new paper attempted to scale up a model XRB system to determine if the timescales would fit with the ~70,000 year upper limit imposed by the travel time. While they found a good agreement with the output from direct accretion itself (10,000–100,000 years) the team found a discrepancy in the disk. In XRBs, the material around the black hole is heated as well, and takes some time to cool down. In this case, the core of the galaxy should still retain a hot disc of material which isn’t present.

This oddity demonstrates that there is still a large amount of knowledge to be gained on the physics surrounding these objects. Fortunately, the relatively close proximity of IC 2497 allows for the potential for detailed followup studies.

Planets and their Remnants around White Dwarfs

The white dwarf G29-38. Many stars, including our Sun, end their lives as white dwarfs. Determining the masses of white dwarf stars is key to the new technique of determining a star's age. Image Credit: NASA

[/caption]

While supernovae are the most dramatic death of stars, 95% of stars will end their lives in a far more quiet fashion, first swelling up to a red giant (perhaps a few times for good measure) before slowly releasing their outer layers into a planetary nebula and fading away as a white dwarf. This is the fate of our own sun which will expand nearly to the orbit of Mars. Mercury, Venus, and Earth will be completely consumed. But what will happen to the rest of the planets in the system?

While many stories have suggested that as the star reaches the red giant phase, even before swallowing the Earth, the inner planets will become inhospitable while the habitable zone will expand to the outer planets, perhaps making the now frozen moons of Jupiter the ideal beach getaway. However, these situations routinely only consider planets with unchanging orbits. As the star loses mass, orbits will change. Those close in will experience drag due to the increased density of released gas. Those further out will be spared but will have orbits that slowly expand as the mass interior to their orbit is shed. Planets at different radii will feel the combination of these effects in different ways causing their orbits to change in ways unrelated to one another.

This general shaking up of the orbital system will result in the system becoming once again, dynamically “young”, with planets migrating and interacting much as they would when the system was first forming. The possible close interactions can potentially crash planets together, fling them out of the system, into looping elliptical orbits, or worse, into the star itself. But can evidence of these planets be found?

A recent review paper explores the possibility. Due to convection in the white dwarf, heavy elements are quickly dragged to lower layers of the star removing traces of elements other than hydrogen and helium in the spectra. Thus, should heavy elements be detected, it would be evidence of ongoing accretion either from the interstellar medium or from a source of circumstellar material. The author of the review lists two early examples of white dwarfs with atmospheres polluted in this respect: van Maanen 2 and G29-38. The spectra of both show strong absorption lines due to calcium while the latter has also had a dust disk detected around the star?

But is this dust disk a remnant of a planet? Not necessarily. Although the material could be larger objects, such as asteroids, smaller dust sized grains would be swept from the solar system due to radiation pressure from the star during the main sequence lifetime. Much like planets, the asteroids orbits would be perturbed and any passing too close to the star could be torn apart tidally and pollute the star as well, albeit on a much smaller scale than a digested planet. Also along these lines is the potential disruption of a potential Oort cloud. Some estimates have predicted that a planet similar to Jupiter may have it’s orbit expanded as much as a thousand times, which would likely scatter many into the star as well.

The key to sorting these sources out may again lie with spectroscopy. While asteroids and comets could certainly contribute to the pollution of the white dwarf, the strength of the spectral lines would be an indirect indicator of the averaged rate of absorption and should be higher for planets. Additionally, the ratio of various elements may help constrain where the consumed body formed in the system. Although astronomers have found numerous gaseous planets in tight orbits around their host stars, it is suspected that these formed further out where temperatures would allow for the gas to condense before being swept away. Objects formed closer in would likely be more rocky in nature and if consumed, their contribution to the spectra would be shifted towards heavier elements.

With the launch of the Spitzer telescope, dust disks indicative of interactions have been found around numerous white dwarfs and improving spectral observations have indicated that a significant number of systems appear polluted. “If one attributes all metal-polluted white dwarfs to rocky debris, then the fraction of terrestrial planetary systems that survive post-main sequence evolution (at least in part) is as high as 20% to 30%”. However, with consideration for other sources of pollution, the number drops to a few percent. Hopefully, as observations progress, astronomers will begin to discover more planets around stars between the main sequence and white dwarf region to better explore this phase of planetary evolution.

A Comet that Gives Twice?

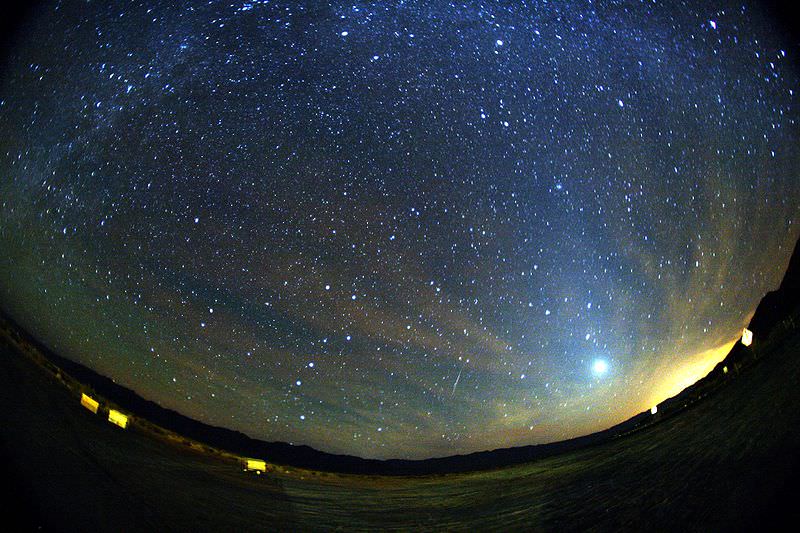
A green and red Orionid meteor striking the sky below Milky Way and to the right of Venus. Zodiacal light is also seen at the image The trail appears slightly curved due to edge distortion in the lens. Taken by Mila Zinkova

[/caption]

While historically, meteor showers were portents of ill omens, we know today that they are the remnants of ejecta from comets entering our atmosphere. Many showers have had their parent comets identified. But a new study is suggesting that two meteor showers, the December Monocerotids and the November Orionids, may share the same parent.


The possibility of a single comet providing multiple showers isn’t too difficult to imagine. Since comets orbit the Sun in elliptical paths there are two potential points the path can intersect Earth’s orbit: Once on the way in and once on the way out. The trouble is that comets don’t tend to orbit directly in the ecliptic plane (defined by the plane on which the Earth orbits the Sun). Thus, comets only puncture through this plane at points known as “nodes”. As a body passes from the upper half to the lower (where upper and lower are the halves defined by Earth’s north and south poles respectively) this point of intersection of the orbit with the ecliptic plane is known as the descending node. When it heads back up, this is the ascending node. If both nodes happen to lie near enough to Earth’s orbital path, the potential for two meteor showers exists. Another possibility is that orbital evolution cause the nodes to change their position and, over time, crossed Earth’s orbit at two different points.

In principle, identifying a parent comet for two showers is much simpler with the first method. In that instance, the comet still orbits in the same path (or near enough) to be conclusively identified as the progenitor. If such an instance were to arise due to orbital evolution, the case must be much more indirect since interactions with planets, even at fairly large distances, can induce large uncertainties in the orbital history.

The December Monocerotids have been associated with a comet known as C/1917 F1 Mellish. Unfortunately for the researchers, the current orbital characteristics of the comet did not feature nodes in Earth’s orbit and did not match the November Orionids. Thus, to establish a connection between the two meteor streams, the team of astronomers from Comenius University in Slovakia, looked at the characteristics of the showers. In order to track these characteristics, the team utilized a publicly available database of meteor recordings from SonotaCo which uses webcams to capture video of meteors and then compute the orbital characteristics of the debris. However, the two showers did share suspiciously similar distributions of sizes (and thus brightnesses) of meteors as well as the velocity and less so, but still notable, the eccentricity.

This led the team to suspect that the node had evolved across Earth’s orbit sweeping by once in the past to create the stream of debris that forms the November shower, and more recently, crossed our orbit to create the December shower. If this hypothesis were correct, the team expected to also find subtle differences hinting that the November shower was older. Sure enough, the November Orionids show a larger dispersion of velocities than that of the December shower.

In the future, the team plans to revise the orbital characteristics of the parent comet. While they were able to show that the precession of the orbit would allow for the situation described, it was only one of a number of possible solutions. Thus, refining the knowledge of the orbit, perhaps from archival photographic plates, would allow the team to better constrain the path and determine the orbital history sufficiently to reinforce or refute their scenario.

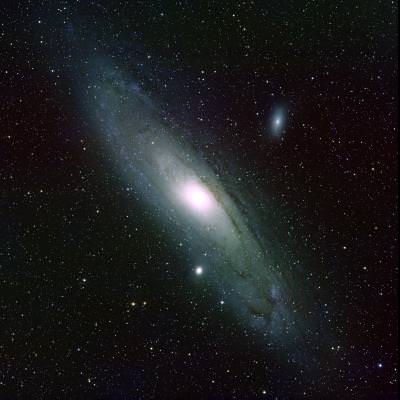
Where’s M31’s Thick Disc?

Within our own galaxy, the thick disc is a distinct population of stars that resides above and below the main (thin) disc. Its stars have a larger range of velocities, are generally older and more metal poor. While astronomers aren’t entirely sure how it formed (remnants of accretion of small galaxies or ejection from the thin disc), it’s certainly there and analogues have been observed in other galaxies, more than 10 megaparsecs away. If these thick discs are truly a product of mergers, then galaxies showing evidence of mergers in other regards should show the presence of this second population as well. Yet in the case of M31, the Andromeda galaxy, the closest major galaxy to our own, which is thought to have a rich merger history, traces of the thick disc have proved elusive. So where is it?


Part of the problem in finding this galactic component is the angle at which the galaxy is presented to us. The galaxies for which a thick disc component have been detected (aside from our own) all lie edge on. This makes the process of finding the thick component greatly simplified. Astronomers can use photometric systems designed for detecting different populations of stars (young vs. old) and observe the change in distribution. When galaxies are presented closer to face on, the projection of the thick component onto the thin makes the identification far more difficult. The Andromeda galaxy is somewhere in between these two extremes and makes an angle of 77° on the sky (where 90° is edge on).

Due to this difficulty, another method is necessary to search for this extended population. Since 2002, a team led by Michelle Collins of Cambridge university has been using the Keck II telescope to search for the expected disc. To do this, the team has been using spectroscopic observations of numerous red giant stars to determine if a specific sub-population can be found with thick disc characteristics. While a sub-population has been discovered before in M31, its velocity dispersion was too low, and the distribution was too closely tied to the classical thin disc to truly be considered the missing component. Instead, it is referred to as the “extended disc”.

But where others have failed, Collins’ team has prevailed. From her team’s study, a recent paper claims to have discovered the thick disc and with such a large sample, have made some interesting observations about its nature. The first is that M31’s thick disc is nearly three times as thick. Additionally, the average velocity of both the thin and thick discs are notably higher (thinM31 = 32.0 kms-1, thinMW = 20.0 kms-1; thickM31 = 45.7 kms-1, thickMW = 40.0 km-1). If the thick disc is indeed related to mergers, then this may indicate that M31 has undergone a more intensive period of recent interactions than our own galaxy. However, the team notes that, from their observations alone, they are unable to constrain the formation methods of this component. While other studies have shown that accretion and ejection each leave distinct fingerprints, the necessary components were not mapped in sufficient detail to distinguish between the two.

Interstellar Scintilation

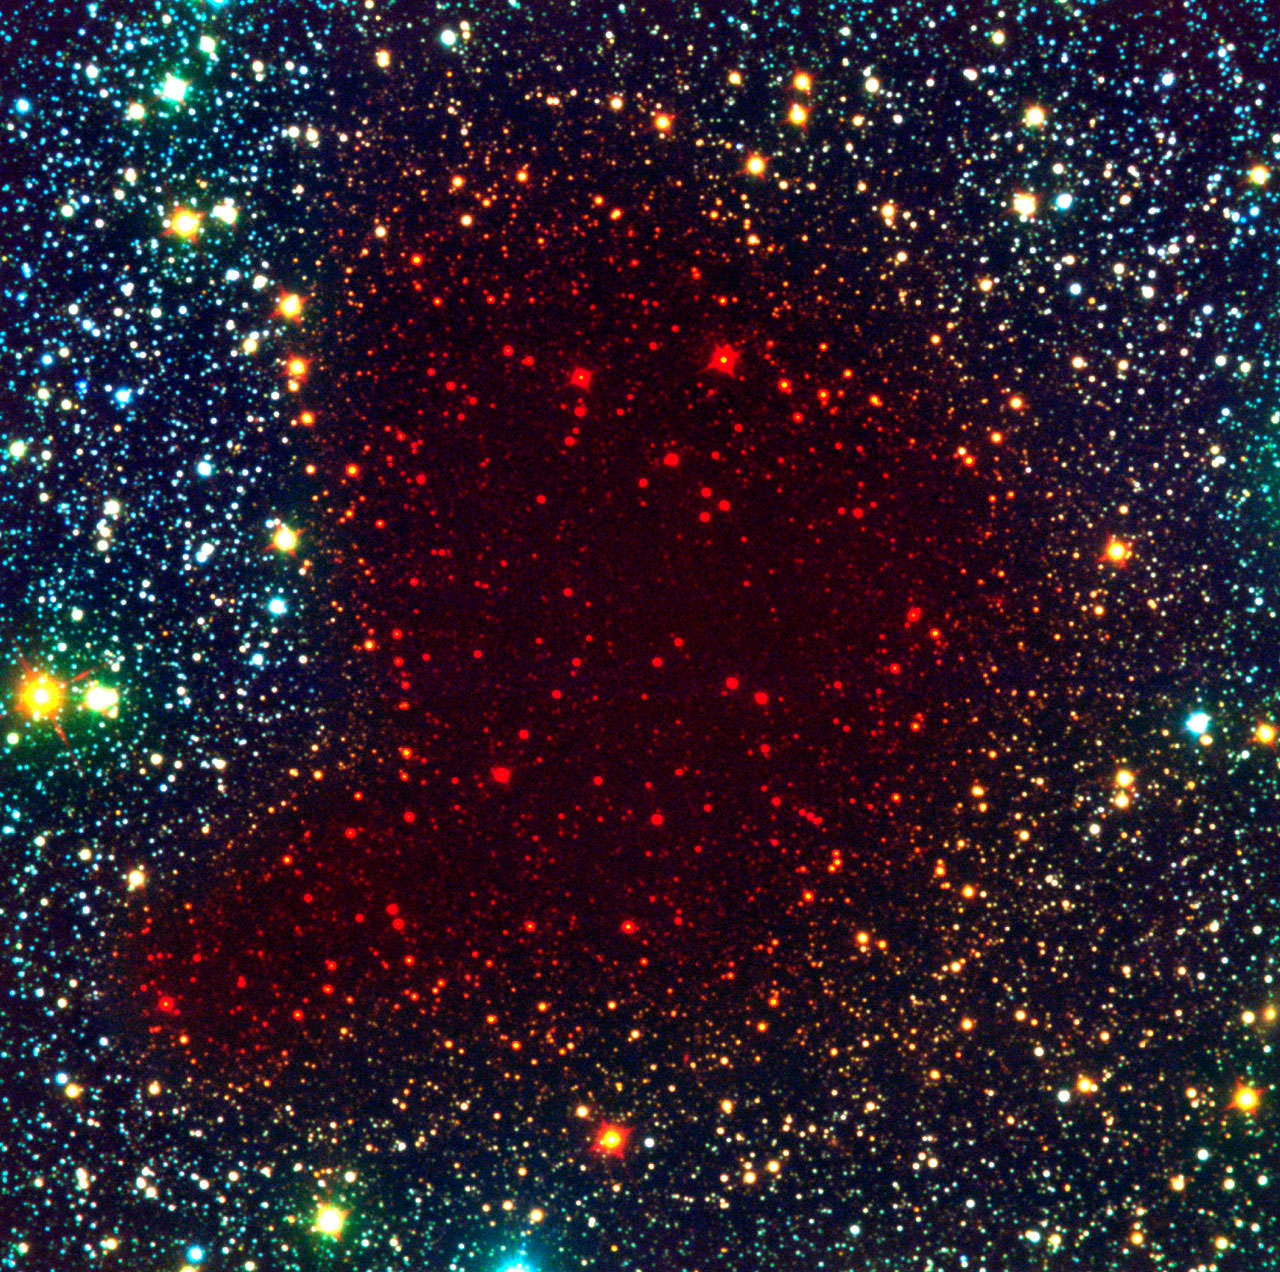
Barnard 68 (Credit: ESO)

[/caption]

Anyone who has looked at stars in the night sky (especially ones low on the horizon) has undoubtedly seen the common effect of twinkling. This effect is caused by turbulence in the atmosphere as small over densities cause the path of the light to bend ever so slightly. Often, vivid color shifts occur since the effects are wavelength dependent. All of this happens in the short distance between the edge of the atmosphere and our eyes. Yet often times, giant molecular clouds lie between our detectors and a star. Could these clouds of gas and dust cause a twinkling effect as well?


In theory, there’s no reason they shouldn’t. As the giant molecular clouds intercepting the incoming starlight move and distort, so too should the path of the light. The difference is that, due to the extremely low density and extremely large size, the timescales over which this distortion would take place would be far longer. Should it be discovered, it would provide astronomers another method by which to discover previously hidden gas.

Doing this is precisely the goals of a team of astronomers working from the Paris University and Sharif University in Iran. To get and understanding of what to expect, the team first simulated the effect, taking into account the properties of the cloud (distribution, velocity, etc…) as well as refraction and reflection. They estimated that, for a star in the Large Magellanic Cloud with light passing through typical galactic H2 gas, this would produce twinkles with changes taking around 24 minutes.

Yet there are many other effects which can produce modulations on the same timescale such as variable stars. Additional constraints would be necessary to claim that a change would be due to a twinkling effect and not a product of the star itself. As stated before, the effect is different for different wavelengths which would produce a “variation of the characteristic time scale … between the red side of the optical spectrum and the blue side.”

With expectations in hand, the team began searching for this effect in areas of the sky in which they knew especially high densities of gas to exist. Thus, they pointed their telescopes towards dense nebulae known as Bok globules like Barnard 68 (pictured above). Observations were taken using the 3.6 meter ESO NTT-SOFI telescope since it had the capabilities to also take infrared images and better explore the potential effects on the red side of the spectrum.

From their observations over two nights, the team discovered one instance in which the modulation of brightness in the different wavelengths followed the predicted effects. However, they note that from a single observation of their effects, it does not conclusively demonstrate the principle. The team also observed stars in the direction of the Small Magellanic Cloud to attempt to observe this twinkling effect in that direction due to previously undetected clouds along the line of sight. In this attempt, they were unsuccessful. Further similar observations along these lines in the future could help to constrain the amount of cold gas within the galaxy.

The Hunt for Young Exoplanets

While there is a great deal of excitement and effort in the hopes of finding small, terrestrial sized exoplanets, another realm of exoplanet discovery that is often overlooked is that of ones of differing ages to explore how planetary systems can evolve. The first discovered exoplanet orbited a pulsar, showing that planets can be hardy enough to survive the potential violent deaths of their parent stars. On the other end, young planets can help astronomers constrain how planets form and a potential new discovery may help in those regards.


Historically, astronomers have often avoided looking at stars younger than about 100 million years. Their young nature tends to make them unruly. They are prone to flares and other eccentric behaviors that often make observations messy. Additionally, many young stars often retain debris disks or are still embedded in the nebula in which they formed which also obscures observations.

Despite this, some astronomers have begun developing targeted searches for young exoplanets. The age of the exoplanet is not independently derived, but instead, taken from the age of the host star. This too can be difficult to determine. For isolated stars, there are precious few methods (such as gyrochronology) and they generally have large errors associated with them. Thus, instead of looking for isolated stars, astronomers searching for young exoplanets have tended to focus on clusters which can be dated more easily using the main sequence turn off method.

Through this methodology, astronomers have searched clusters and other groups, such as Beta Pictoris which turned up a planet earlier this year. The Beta Pic moving group boasts an age of ~12 million years making it one of the youngest associations currently known.

Trumpler 37 (also known as IC 1396 and the Elephant Trunk Nebula) is one of the few clusters with an even younger age of 1-5 million years. This was one of several young clusters observed by a team of German astronomers led by Gracjan Maciejewski of Jena University. The group utilized an array of telescopes across the world to continuously monitor Trumpler 37 for several weeks. During that time, they discovered numerous flares and variable stars, as well as a star with a dip in its brightness that could be a planet.

The team cautions that the detection may not be a planet. Several objects can mimic planetary transit lightcurves such as “the central transit of a low-mass star in front of a large main-sequence star or red giant, grazing eclipses in systems consisting of two main-sequence stars and a contamination of a fainter eclipsing binary along the same line of sight.” Due to the physics of small objects, the size of brown dwarfs and many Jovian type planets are similar leading difficulty in distinguishing from the light curve alone. Spectroscopic results will have to be undertaken to confirm the object truly is a planet.

However, assuming it is, based on the size of the dip in brightness, the team predicts the planet is about twice the radius of Jupiter, and about 15 times the mass. If so, this would be in good agreement with models of planetary formation for the expected age. Ultimately, planets of such age will help test our understanding of how planets form, whether it be from a single gravitational collapse early on, or slow accretion over time.

Breaking News: The Sun Worked 175 Years Ago!

The sunspot butterfly diagram. This modern version is constructed (and regularly updated) by the solar group at NASA Marshall Space Flight Center.

[/caption]

You’ll have to forgive my title. After writing so many articles as moderately as I could, I couldn’t help but engage in a bit of sensationalism of my own, especially in the interest of sarcasm. Although it’s not especially exciting that the sun has indeed been working for nearly two centuries (indeed, much longer than that), what is interesting is how using historical data, scientists have confirmed that process we see today have been relatively consistent since 1825.


The observations revolve around a familiar diagram known as the Butterfly diagram (pictured above). This diagram depicts the position of sunspots at various latitudes on the sun’s surface as time progresses. At the beginning of a cycle, sunspots start of at high latitudes and as the cycle progresses, appear at lower and lower latitudes until they disappear and the cycle repeats. The pattern formed resembles the wings of a butterfly, thereby giving the diagram its name.

Although sunspots have been observed as far back as 364 BC by Chinese astronomers, telescopic observations of them did not start until the early 1600’s. Continuous observation of the sun and its spots started in 1876 at the Royal Greenwich Observatory. There Edward Maunder recognized the pattern of sunspots and published them in the format that is the now famous Butterfly diagram in 1904. The diagram, as its usually shown only comprises data starting from around 1876 and continuing until present day. But the use of new records have extended the diagram back an additional 51 years, covering four new solar cycles. Although many observations exist with total sunspot counts, this new set of data includes detailed documentation of the position of the spots on the solar disc.

The observations were created by German astronomer Heinrich Schwabe. Originally an apothecary, he won a telescope in a lottery in 1825 and was fascinated, selling his family business four years later. Schwabe observed the Sun compulsively attempting to discover a new planet with an orbit interior to Mercury by witnessing it transiting the Sun. Although this effort was doomed to failure, Schwabe maintained detailed records of the sunspots. He even recognized the pattern of spots occurred in an 11 year cycle and published the discovery in 1843. It was met with little attention for several years until it was included in Alexander von Humboldt’s Kosmos. Due to this discovery, the 11 year solar cycle is also referred to as the Schwabe cycle.

From 1825 until 1867, Schwabe compiled at least 8468 observations of the Sun’s disc, drawn on 5cm circles. On his death, these documents, as well as the rest of his scientific works, were donated to the Royal Astronomical Society of London, and in 2009, were provided to a team of researchers for digitization. From the 8468 drawings, 7299 “have a coordinate system which is found to be aligned with the celestial equator” making them suitable for translation into scientific data.

Thus far, the team has converted 11% of the images into usable data and already, it has created a detailed butterfly diagram preceding those produced elsewhere. From it, the astronomers undertaking the conversion have made some interesting observations. The cycle beginning around 1834 was weaker than others around that time. The following one, starting around 1845, displayed a notable asymmetry where sunspots in the southern hemisphere were conspicuously lacking for the first 1-2 years of the cycle, whereas most cycles are fairly well mirrored. Although unusual, such phase shifts are not unprecedented. In fact, another study using historical records has demonstrated that, for the last 300 years, one hemisphere has always led (although not usually so greatly) for several cycles before trading off.

As with the recently discussed historical project on weather trends this reanalysis of historical data is one of many such projects giving us a broader picture of the trends we see today and how they have changed over time. While undoubtedly, many will be demonstrated to be mundane and familiar, undeserving of the exaggerated significance of my title, this is how science works: by expanding our knowledge to test our expectations.

NOTE: I’d Emailed the team asking for permission to show their image of the historical butterfly diagram, but since I haven’t gotten permission, I didn’t reproduce it here. But you can still view it in the paper. Go do so. It’s awesomely familiar.