A Star Is About To Go 2.5% The Speed Of Light Past A Black Hole

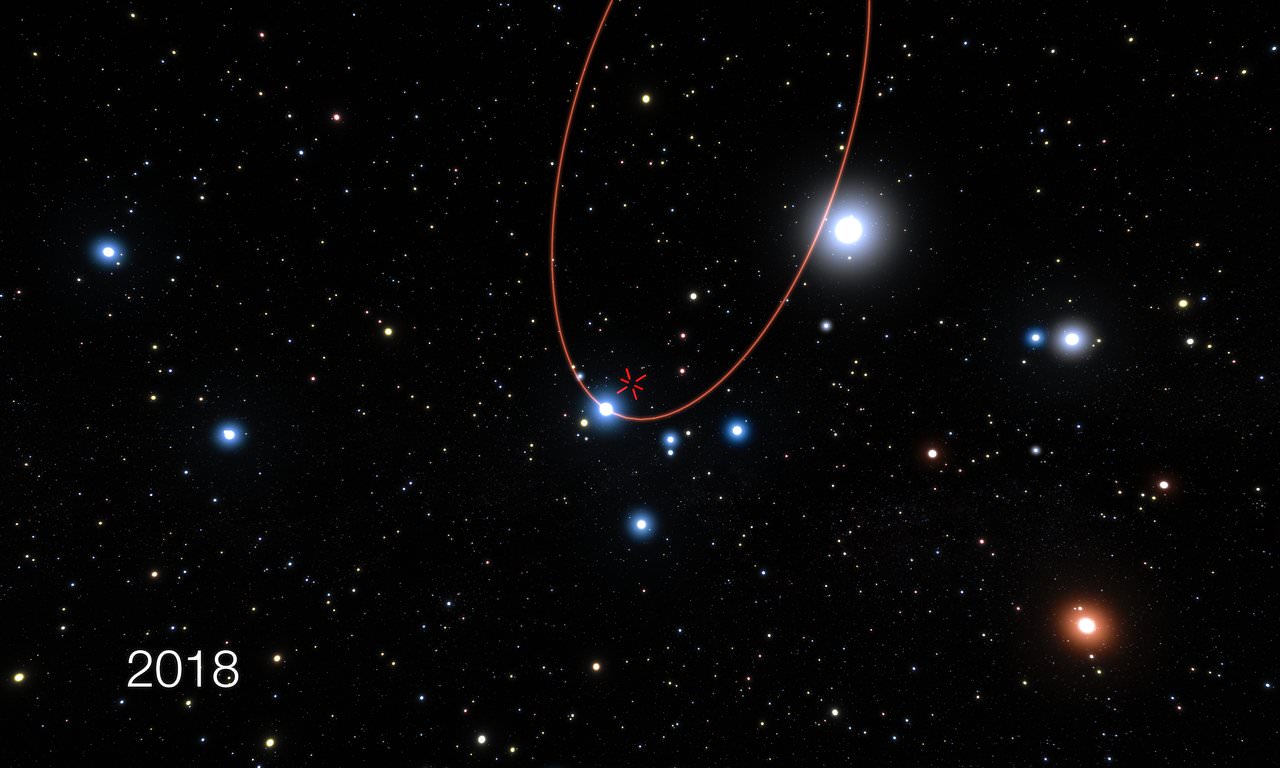
Artist’s impression of the star S2 passing very close to the supermassive black hole at the centre of the Milky Way. Credit: ESO

Since it was first discovered in 1974, astronomers have been dying to get a better look at the Supermassive Black Hole (SBH) at the center of our galaxy. Known as Sagittarius A*, scientists have only been able to gauge the position and mass of this SBH by measuring the effect it has on the stars that orbit it. But so far, more detailed observations have eluded them, thanks in part to all the gas and dust that obscures it.

Luckily, the European Southern Observatory (ESO) recently began work with the GRAVITY interferometer, the latest component in their Very Large Telescope (VLT). Using this instrument, which combines near-infrared imaging, adaptive-optics, and vastly improved resolution and accuracy, they have managed to capture images of the stars orbiting Sagittarius A*. And what they have observed was quite fascinating.

One of the primary purposes of GRAVITY is to study the gravitational field around Sagittarius A* in order to make precise measurements of the stars that orbit it. In so doing, the GRAVITY team – which consists of astronomers from the ESO, the Max Planck Institute, and multiple European research institutes – will be able to test Einstein’s theory of General Relativity like never before.
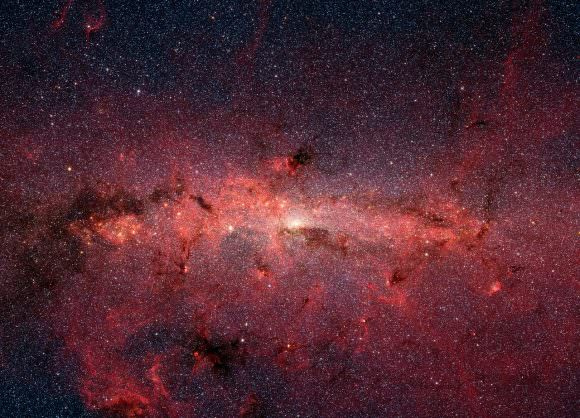
The core of the Milky Way. Credit: NASA/JPL-Caltech/S. Stolovy (SSC/Caltech)
Spitzer image of the core of the Milky Way Galaxy. Credit: NASA/JPL-Caltech/S. Stolovy (SSC/Caltech)

In what was the first observation conducted using the new instrument, the GRAVITY team used its powerful interferometric imaging capabilities to study S2, a faint star which orbits Sagittarius A* with a period of only 16 years. This test demonstrated the effectiveness of the GRAVITY instrument – which is 15 times more sensitive than the individual 8.2-metre Unit Telescopes the VLT currently relies on.

This was an historic accomplishment, as a clear view of the center of our galaxy is something that has eluded astronomers in the past. As GRAVITY’s lead scientist, Frank Eisenhauer – from the Max Planck Institute for Extraterrestrial Physics in Garching, Germany – explained to Universe Today via email:

“First, the Galactic Center is hidden behind a huge amount of interstellar dust, and it is practically invisible at optical wavelengths. The stars are only observable in the infrared, so we first had to develop the necessary technology and instruments for that. Second, there are so many stars concentrated in the Galactic Center that a normal telescope is not sharp enough to resolve them. It was only in the late 1990′ and in the beginning of this century when we learned to sharpen the images with the help of speckle interferometry and adaptive optics to see the stars and observe their dance around the central black hole.”

But more than that, the observation of S2 was very well timed. In 2018, the star will be at the closest point in its orbit to the Sagittarius A*  – just 17 light-hours from it. As you can see from the video below, it is at this point that S2 will be moving much faster than at any other point in its orbit (the orbit of S2 is highlighted in red and the position of the central black hole is marked with a red cross).

When it makes its closest approach, S2 will accelerate to speeds of almost 30 million km per hour, which is 2.5% the speed of light. Another opportunity to view this star reach such high speeds will not come again for another 16 years – in 2034. And having shown just how sensitive the instrument is already, the GRAVITY team expects to be able make very precise measurements of the star’s position.

In fact, they anticipate that the level of accuracy will be comparable to that of measuring the positions of objects on the surface of the Moon, right down to the centimeter-scale. As such, they will be able to determine whether the motion of the star as it orbits the black hole are consistent with Einstein’s theories of general relativity.

“[I]t is not the speed itself to cause the general relativistic effects,” explained Eisenhauer, “but the strong gravitation around the black hole. But the very  high orbital speed is a direct consequence and measure of the gravitation, so we refer to it in the press release because the comparison with the speed of light and the ISS illustrates so nicely the extreme conditions.
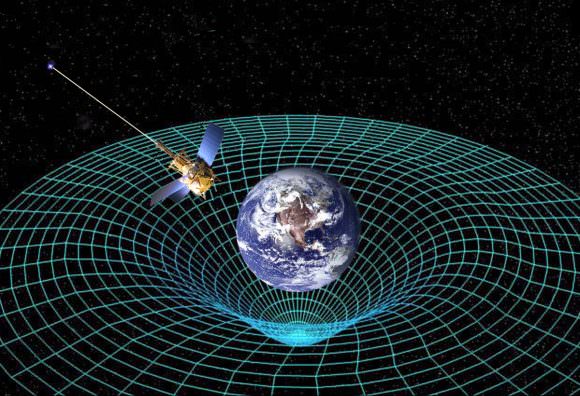
Artist's impression of the influence gravity has on space time. Credit: space.com
Artist’s impression of the influence gravity has on space-time. Credit: space.com

As recent simulations of the expansion of galaxies in the Universe have shown, Einstein’s theories are still holding up after many decades. However, these tests will offer hard evidence, obtained through direct observation. A star traveling at a portion of the speed of light around a supermassive black hole at the center of our galaxy will certainly prove to be a fitting test.

And Eisenhauer and his colleagues expect to see some very interesting things. “We hope to see a “kick” in the orbit.” he said. “The general relativistic effects increase very strongly when you approach the black hole, and when the star swings by, these effects will slightly change the direction of the
orbit.”

While those of us here at Earth will not be able to “star gaze” on this occasion and see R2 whipping past Sagittarius A*, we will still be privy to all the results. And then, we just might see if Einstein really was correct when he proposed what is still the predominant theory of gravitation in physics, over a century later.

Further Reading: eso.org

What are the Different Masses of the Planets?

Planets and other objects in our Solar System. Credit: NASA.

It is a well known fact that the planets of the Solar System vary considerably in terms of size. For instance, the planets of the inner Solar System are smaller and denser than the gas/ice giants of the outer Solar System. And in some cases, planets can actually be smaller than the largest moons. But a planet’s size is not necessarily proportional to its mass. In the end, how massive a planet is has more to do with its composition and density.

So while a planet like Mercury may be smaller in size than Jupiter’s moon Ganymede or Saturn’s moon Titan, it is more than twice as massive than they are. And while Jupiter is 318 times as massive as Earth, its composition and density mean that it is only 11.21 times Earth’s size. Let’s go over the planet’s one by one and see just how massive they are, shall we?

Mercury:

Mercury is the Solar System’s smallest planet, with an average diameter of 4879 km (3031.67 mi). It is also one of its densest at 5.427 g/cm3, which is second only to Earth. As a terrestrial planet, it is composed of silicate rock and minerals and is differentiated between an iron core and a silicate mantle and crust. But unlike its peers (Venus, Earth and Mars), it has an abnormally large metallic core relative to its crust and mantle.

All told, Mercury’s mass is approximately 0.330 x 1024 kg, which works out to 330,000,000 trillion metric tons (or the equivalent of 0.055 Earths). Combined with its density and size, Mercury has a surface gravity of 3.7 m/s² (or 0.38 g).

Internal structure of Mercury: 1. Crust: 100–300 km thick 2. Mantle: 600 km thick 3. Core: 1,800 km radius. Credit: MASA/JPL

Venus:

Venus, otherwise known as “Earth’s Sister Planet”, is so-named because of its similarities in composition, size, and mass to our own. Like Earth, Mercury and Mars, it is a terrestrial planet, and hence quite dense. In fact, with a density of 5.243 g/cm³, it is the third densest planet in the Solar System (behind Earth and Mercury). Its average radius is roughly 6,050 km (3759.3 mi), which is the equivalent of 0.95 Earths.

And when it comes to mass, the planet weighs in at a hefty 4.87 x 1024 kg, or 4,870,000,000 trillion metric tons. Not surprisingly, this is the equivalent of 0.815 Earths, making it the second most massive terrestrial planet in the Solar System. Combined with its density and size, this means that Venus also has comparable gravity to Earth – roughly 8.87 m/s², or 0.9 g.

Earth:

Like the other planets of the inner Solar System, Earth is also a terrestrial planet, composed of metals and silicate rocks differentiated between an iron core and a silicate mantle and crust. Of the terrestrial planets, it is the largest and densest, with an average radius of 6,371.0 km (3,958.8 mi) and a mean of density of 5.514 g/cm3.

The Earth's layers, showing the Inner and Outer Core, the Mantle, and Crust. Credit: discovermagazine.com
The Earth’s layers, showing the Inner and Outer Core, the Mantle, and Crust. Credit: discovermagazine.com

And at 5.97 x 1024 kg (which works out to 5,970,000,000,000 trillion metric tons) Earth is the most massive of all the terrestrial planets. Combined with its size and density, Earth experiences the surface gravity that we are all familiar with – 9.8 m/s², or 1 g.

Mars:

Mars is the third largest terrestrial planet, and the second smallest planet in our Solar System. Like the others, it is composed of metals and silicate rocks that are differentiated between a iron core and a silicate mantle and crust. But while it is roughly half the size of Earth (with a mean diameter of 6792 km, or 4220.35 mi), it is only one-tenth as massive.

In short, Mars has a mass of 0.642 x1024 kg, which works out to 642,000,000 trillion metric tons, or roughly 0.11 the mass of Earth. Combined with its size and density – 3.9335 g/cm³ (which is roughly 0.71 times that of Earth’s) – Mars has a surface gravity of 3.711 m/s² (or 0.376 g).

Jupiter:

Jupiter is the largest planet in the Solar System. With a mean diameter of 142,984 km, it is big enough to fit all the other planets (except Saturn) inside itself, and big enough to fit Earth 11.8 times over. But with a mass of 1898 x 1024 kg (or 1,898,000,000,000 trillion metric tons), Jupiter is more massive than all the other planets in the Solar System combined – 2.5 times more massive, to be exact.

upiter's structure and composition. (Image Credit: Kelvinsong CC by S.A. 3.0)
Jupiter’s structure and composition. (Image Credit: Kelvinsong CC by S.A. 3.0)

However, as a gas giant, it has a lower overall density than the terrestrial planets. It’s mean density is 1.326 g/cm, but this increases considerably the further one ventures towards the core. And though Jupiter does not have a true surface, if one were to position themselves within its atmosphere where the pressure is the same as Earth’s at sea level (1 bar), they would experience a gravitational pull of 24.79 m/s2 (2.528 g).

Saturn:

Saturn is the second largest of the gas giants; with a mean diameter of 120,536 km, it is just slightly smaller than Jupiter. However, it is significantly less massive than its Jovian cousin, with a mass of 569 x 1024 kg (or 569,000,000,000 trillion metric tons). Still, this makes Saturn the second most-massive planet in the Solar System, with 95 times the mass of Earth.

Much like Jupiter, Saturn has a low mean density due to its composition. In fact, with an average density of 0.687 g/cm³, Saturn is the only planet in the Solar System that is less dense than water (1 g/cm³).  But of course, like all gas giants, its density increases considerably the further one ventures towards the core. Combined with its size and mass, Saturn has a “surface” gravity that is just slightly higher than Earth’s – 10.44 m/s², or 1.065 g.

Diagram of Saturn's interior. Credit: Kelvinsong/Wikipedia Commons
Diagram of Saturn’s interior. Credit: Kelvinsong/Wikipedia Commons

Uranus:

With a mean diameter of 51,118 km, Uranus is the third largest planet in the Solar System. But with a mass of 86.8 x 1024 kg (86,800,000,000 trillion metric tons) it is the fourth most massive – which is 14.5 times the mass of Earth. This is due to its mean density of 1.271 g/cm3, which is about three quarters of what Neptune’s is. Between its size, mass, and density, Uranus’ gravity works out to 8.69 m/s2, which is 0.886 g.

Neptune:

Neptune is significantly larger than Earth; at 49,528 km, it is about four times Earth’s size. And with a mass of 102 x 1024 kg (or 102,000,000,000 trillion metric tons) it is also more massive – about 17 times more to be exact. This makes Neptune the third most massive planet in the Solar System; while its density is the greatest of any gas giant (1.638 g/cm3). Combined, this works out to a “surface” gravity of 11.15 m/s2 (1.14 g).

As you can see, the planets of the Solar System range considerably in terms of mass. But when you factor in their variations in density, you can see how a planets mass is not always proportionate to its size. In short, while some planets may be a few times larger than others, they are can have many, many times more mass.

We have written many interesting articles about the planets here at Universe. For instance, here’s Interesting Facts About the Solar System, What are the Colors of the Planets?, What are the Signs of the Planets?, How Dense are the Planets?, and What are the Diameters of the Planets?.

For more information, check out Nine Planets overview of the Solar System, NASA’s Solar System Exploration, and use this site to find out what you would weigh on other planets.

Astronomy Cast has episodes on all of the planets. Here’s Episode 49: Mercury to start!

Centaurs Keep Their Rings From Greedy Gas Giants

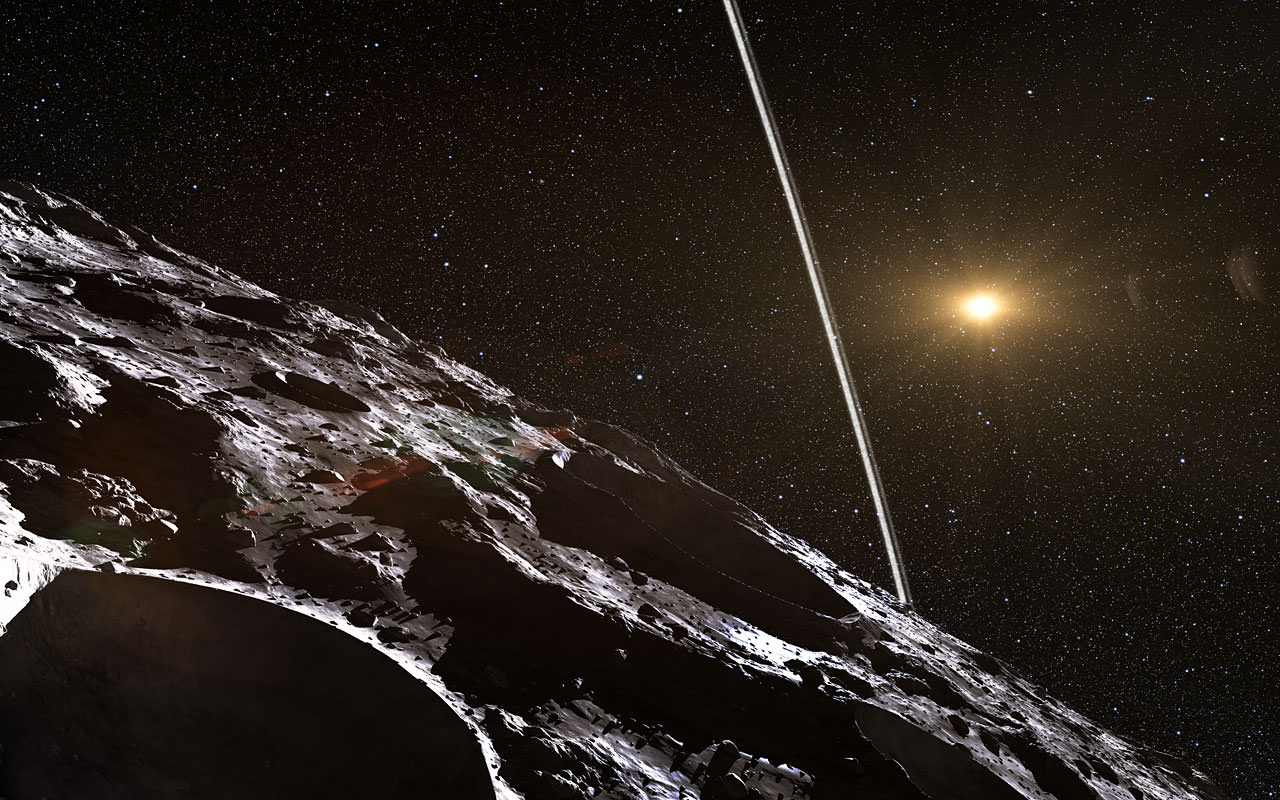
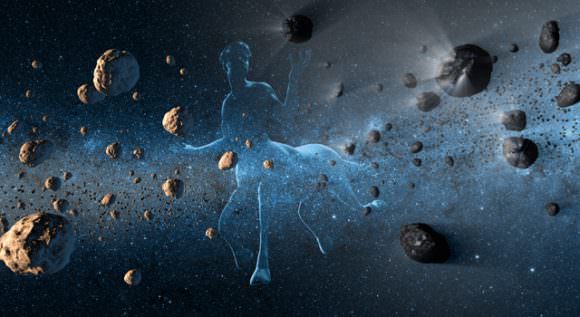
Artist's impression of what the rings of the asteroid Chariklo would look like from the small body's surface. The rings' discovery was a first for an asteroid. Credit: ESO/L. Calçada/Nick Risinger (skysurvey.org)

When we think of ring systems, what naturally comes to mind are planets like Saturn. It’s beautiful rings are certainly the most well known, but they are not the only planet in our Solar System to have them. As the Voyager missions demonstrated, every planet in the outer Solar System – from Jupiter to Neptune – has its own system of rings. And in recent years, astronomers have discovered that even certain minor planets – like the Centaur asteroids 10199 Chariklo and 2006 Chiron – have them too.

This was a rather surprising find, since these objects have such chaotic orbits. Given that their paths through the Solar System are frequently altered by the powerful gravity of gas giants, astronomers have naturally wondered how a minor planet could retain a system of rings. But thanks to a team of researchers from the Sao Paulo State University in Brazil, we may be close to answering that question.

In a study titled “The Rings of Chariklo Under Close Encounters With The Giant Planets“, which appeared recently in The Astrophysical Journal, they explained how they constructed a model of the Solar System that incorporated 729 simulated objects. All of these objects were the same size as Chariklo and had their own system of rings. They then went about the process of examining how interacting with gas giant effected them.

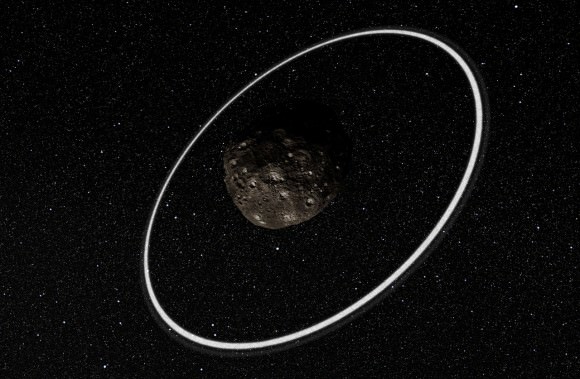
Artist's impression of rings around the asteroid Chariklo. This was the first asteroid where rings were discovered. Credit: ESO/L. Calçada/M. Kornmesser/Nick Risinger (skysurvey.org)
Artist’s impression of rings around the Centaur Chariklo, the first asteroid where rings were discovered. Credit: ESO/L. Calçada/M. Kornmesser/Nick Risinger (skysurvey.org)

To break it down, Centaurs are a population of objects within our Solar System that behave as both comets and asteroids (hence why they are named after the hybrid beasts of Greek mythology). 10199 Chariklo is the largest known member of the Centaur population, a possible former Trans-Neptunian Object (TNO) which currently orbits between Saturn and Uranus.

The rings around this asteroid were first noticed in 2013 when the asteroid underwent a stellar occultation. This revealed a system of two rings, with a radius of 391 and 405 km and widths of about 7 km 3 km, respectively. The absorption features of the rings showed that they were partially composed of water ice. In this respect, they were much like the rings of Jupiter, Saturn, Uranus and the other gas giants, which are composed largely of water ice and dust.

This was followed by findings made in 2015 that indicated that 2006 Chiron – another major Centaur – could have a ring of its own. This led to further speculation that there might be many minor planets in our Solar System that have a system of rings. Naturally, this was a bit perplexing to astronomers, since rings are fragile structures that were thought to be exclusive to the gas giants of our System.

As Professor Othon Winter, the lead researcher of the Sao Paulo team, told Universe Today via email:

“At first it was a surprise to find a Centaur with rings, since the Centaurs have chaotic orbits wandering between the giant planets and having frequent close encounters with them. However, we have shown that in most of the cases the ring system can survive all the close encounters with the giant planets. Therefore,  Centaurs with rings might be much more common than we thought before.”

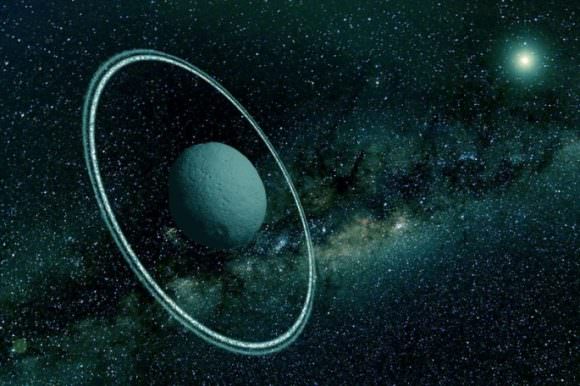
Arist's impression of Chiron and its possible ring. Credit: dailygalaxy.com
Artist’s impression of Chiron, showing a possible ring system. Credit: dailygalaxy.com

For the sake of their study, Winter and his colleagues considered the orbits of 729 simulated clones of Chariklo as they orbited the Sun over the course of 100 million years. From this, Winter and his colleagues found that each Centaur averaged about 150 close encounters with a gas giant, within one Hill radius of the planet in question. As Winter described it:

“The study was made in two steps. First we considered a set of more than 700 clones of Chariklo. The clones had initial trajectories that were slightly different from Chariklo for statistical purposes (since we are dealing with chaotic trajectories) and computationally simulated their orbital evolution forward in time (to see their future) and also backward in time (to see their past). During these simulations we archived the information of all the close encounters (many thousands) they had with each of the giant planets.”

“In the second step, we performed simulations of each one of the close encounters found in the first step, but now including a disk of particles around Chariklo  (representing the ring particles). Then, at the end of each simulation we analyzed what happened to the particles. Which ones were removed from Chariklo  (escaping its gravitational field)? Which ones were strongly disturbed (still orbiting around Chariklo)? Which ones did not suffer any significant effect?”

In the end, the simulations showed that in 90 percent of the cases, the rings of the Centaurs survived their close encounters with gas giants, whereas they were disturbed in 4 percent of cases, and were stripped away only 3 percent of the time. Thus, they concluded that if there is an efficient mechanism that creates the rings, then it is strong enough to let Centaurs keep them.

Due to their dual nature, astronomers refer to asteroids that behave as both comets and asteroids as Centaurs. Credit: jpl.nasa.gov
Due to their dual nature, the name Centaur has stuck when referring to objects that act as both comets and asteroids. Credit: jpl.nasa.gov

More than that, their research would seem to indicate that what was considered unique to certain planetary bodies may actually be more commonplace. “It reveals that our Solar System is complex not just as whole or for large bodies,” said Winter, “but even small bodies may show complex structures and even more complex temporal evolution.”

The next step for the research team is to study ring formation, which could show that they in fact picking them up from the gas giants themselves. But regardless of where they come from, its becoming increasingly clear that Centaurs like 10199 Chariklo are not alone. What’s more, they aren’t giving up their rings anytime soon!

Further Reading: iopscience.iop.org
Time For NASA To Double Down On Journey To Mars

Looking to the future of space exploration, NASA and TopCoder have launched the "High Performance Fast Computing Challenge" to improve the performance of their Pleiades supercomputer. Credit: NASA/MSFC

Since the Authorization Act of 2010, NASA has been pushing ahead with the goal of sending astronauts to Mars by the 2030s. The latter part of this goal has been the subject of much attention in recent years, and for good reason. Sending crewed missions to the Red Planet would be the single-greatest initiative undertaken since the Apollo era, and the rewards equally great.

However, with the scheduled date for a mission approaching, and the upcoming presidential election, NASA is finding itself under pressure to show that they are making headway. Despite progress being made with both the Space Launch System (SLS) and the Orion Multi-Purpose Crew Vehicle, there are lingering issues which need to be worked out before NASA can mount its historic mission to Mars.

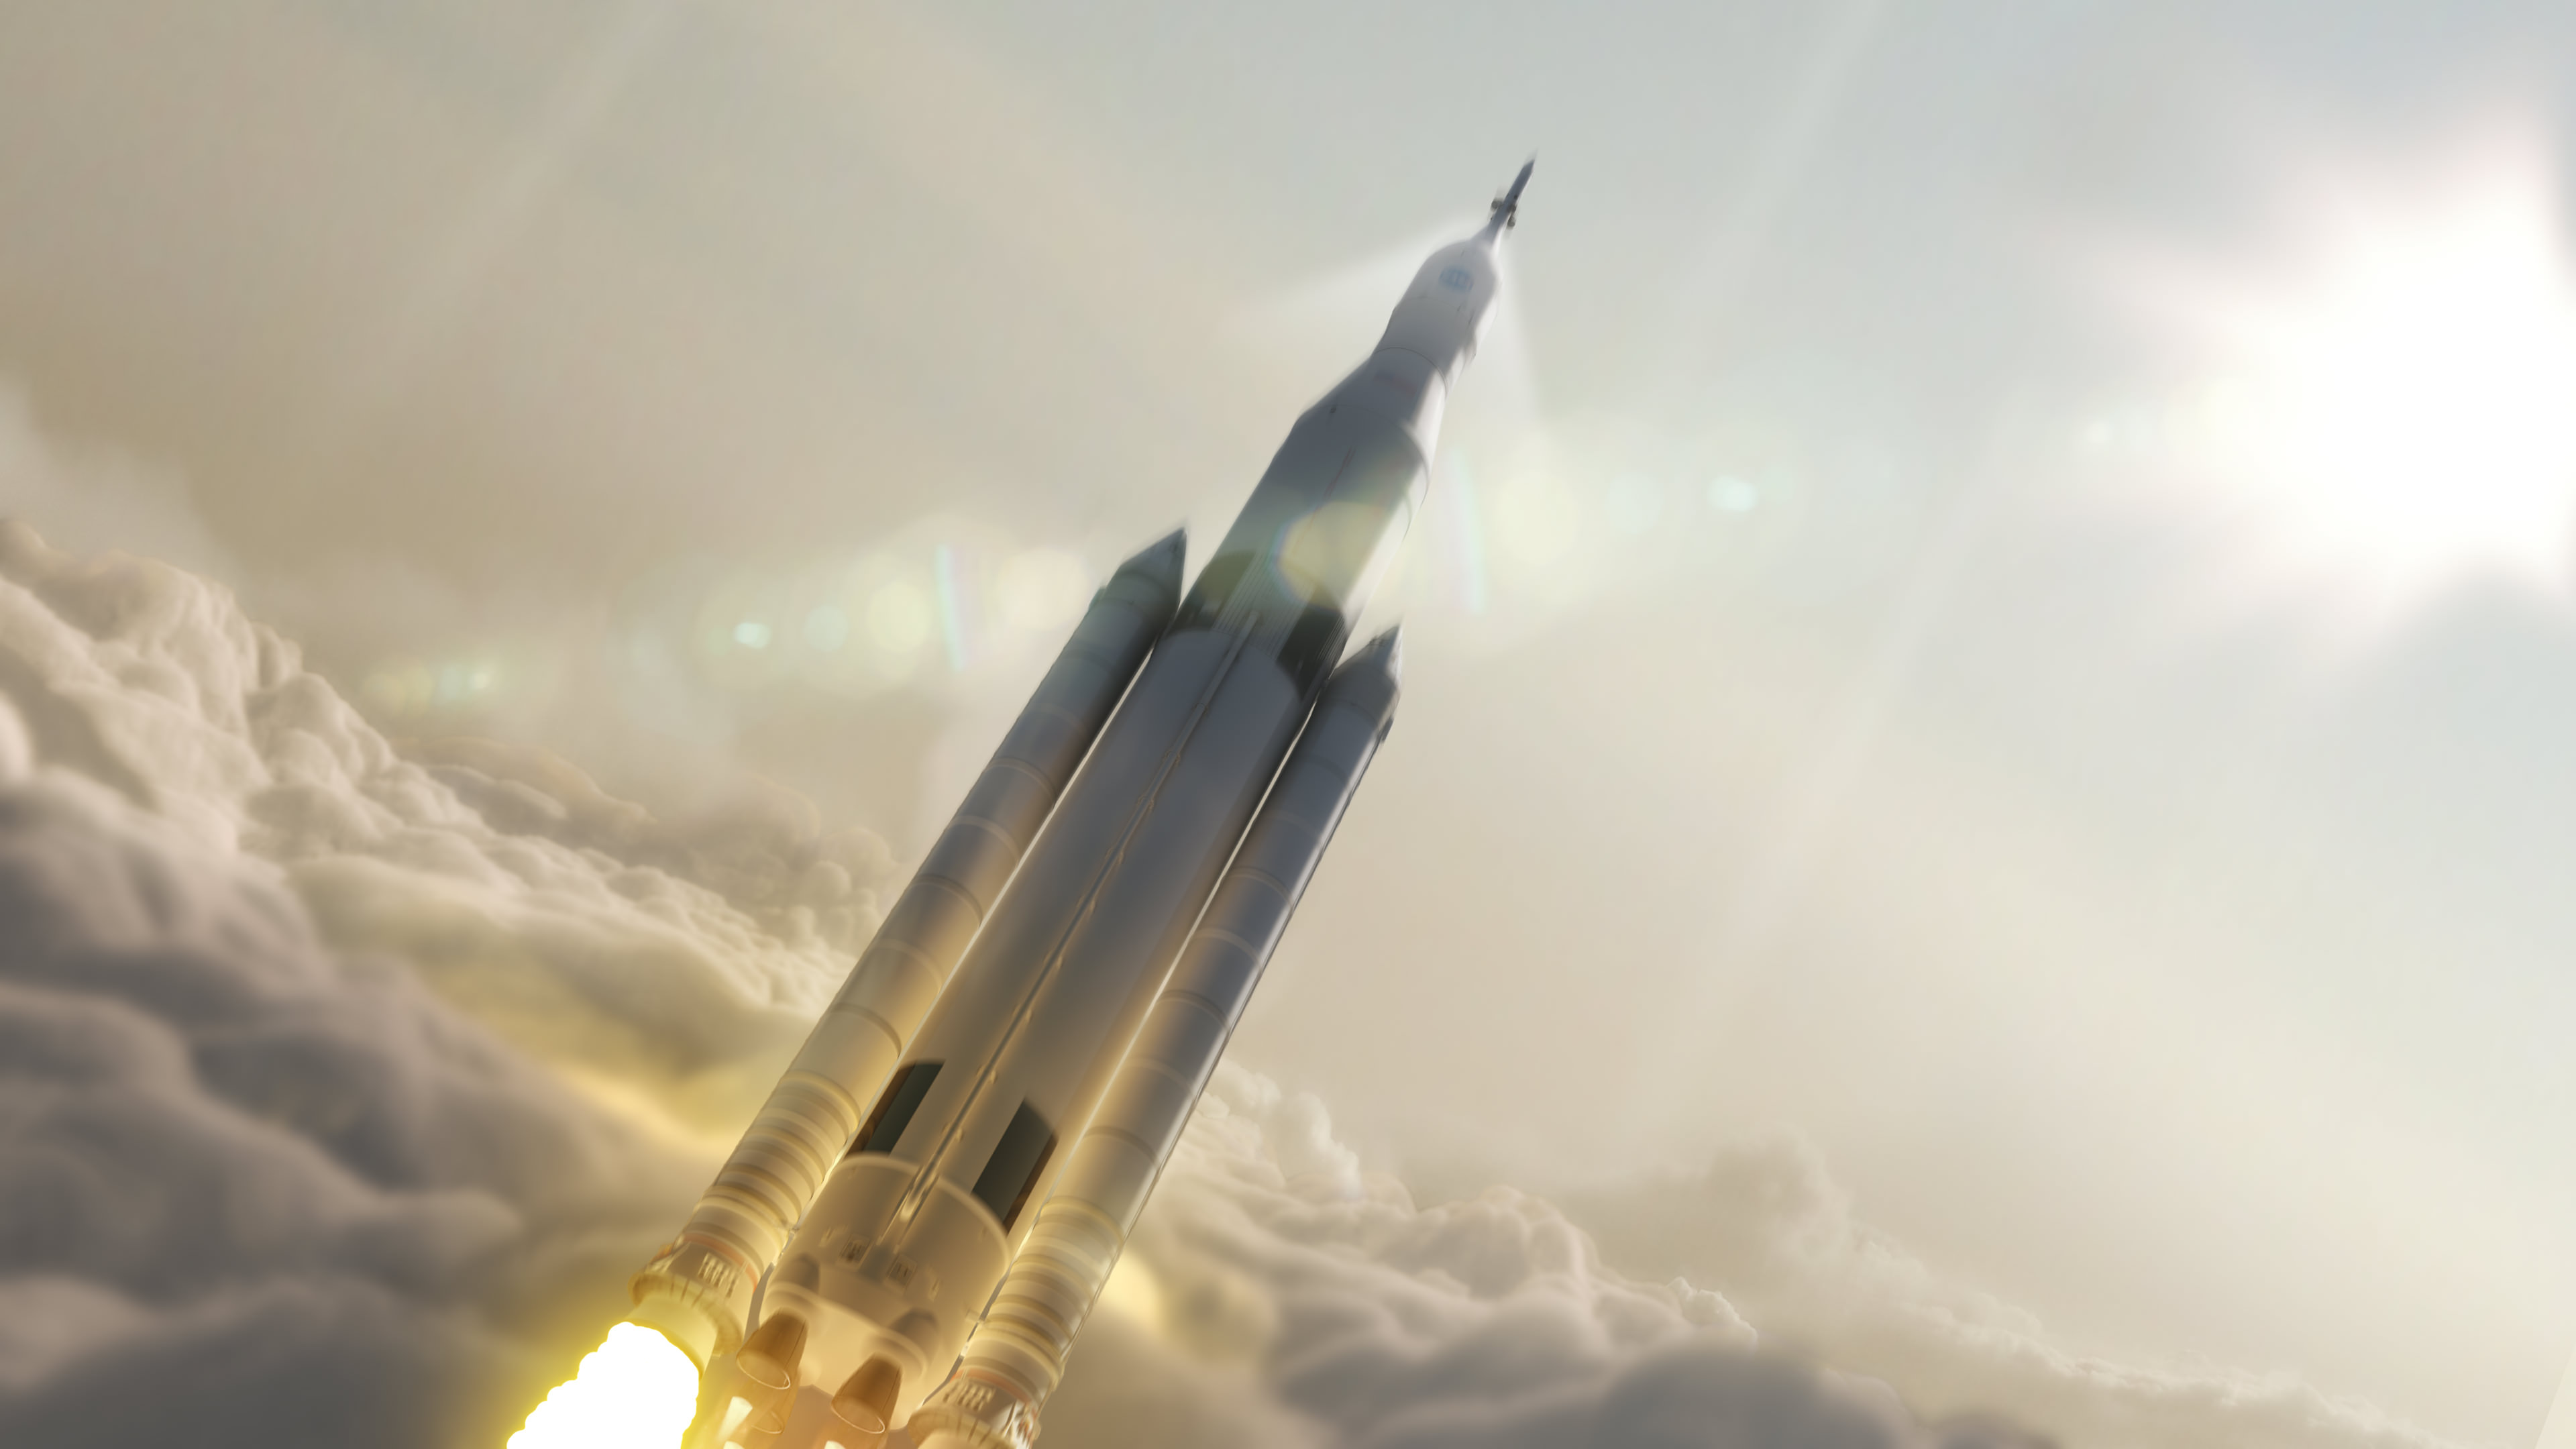
One of the biggest issues is that of assigned launched missions that will ensure that the SLS is tested many times before a crewed mission to Mars is mounted. So far, NASA has produced some general plans as part of it’s “Journey to Mars“, an important part of which is the use of the SLS and Orion spacecraft to send a crew beyond low-Earth orbit and explore a near-Earth asteroid by 2025.

NASA's Journey to Mars. NASA is developing the capabilities needed to send humans to an asteroid by 2025 and Mars in the 2030s. Credit: NASA/JPL
NASA’s Journey to Mars. NASA is developing the capabilities needed to send humans to an asteroid by 2025 and Mars in the 2030s. Credit: NASA/JPL

This plan is not only intended to provide their astronauts with experience working beyond LEO, but to test the SLS and Orion’s capabilities, not to mention some vital systems – such as Solar Electric Propulsion (SEP), which will be used to send cargo missions to Mars. Another major step is  Exploration Mission 1 (EM-1), the first planned flight of the SLS and the second uncrewed test flight of the Orion spacecraft (which will take place on September 30th, 2018).

However, beyond this, NASA has only one other mission on the books, which is Exploration Mission 2 (EM-2). This mission will involve the crew performing a practice flyby of a captured asteroid in lunar orbit, and which is scheduled for launch in 2023. This will be the first crewed test of the Orion spacecraft, and also the first time American astronauts have left low-Earth orbit since the Apollo 17 mission in 1972.

While significant, these mission remain the only two assigned flights for the SLS and Orion. Beyond these, dozens more have been proposed as part of NASA’s three phase plan to reach Mars. For instance, between 2018 and the 2030s, NASA would be responsible for launching a total of 32 missions in order to send the necessary hardware to near-Mars space before making crewed landings on Phobos and then to Mars.

In accordance with the “Evolvable Mars Campaign” – which was presented last year by NASA’s Human Exploration and Operations Mission Directorate (HEOMD) – Phase One (the “Earth Reliant” phase) of this plan would involve two launches in 2028, which would be responsible for transporting a habitation module, an SEP module, and a exploration vehicle to cis-lunar space.

This would be followed by two SLS flights in 2029, bringing the Trans-Earth Injection (TEI) stage to cis-lunar space, followed by a crew to perform the final checks on the Phobos Hab. By 2030, Phase Two (known as the “Proving Ground” phase) would begin with the last elements – the Earth Orbit Insertion (EOI) stage and taxi elements – being launched to cis-lunar orbit, and then all the equipment being sent to near-Mars space for pre-deployment.

By 2031, two more SLS missions would take place, where a Martian Hab would be launched, followed in 2032 by the launches of the Mars Orbit Insertion (MOI) and Trans-Mars Injection (TMI) stages. By 2033, Phase Three (the “Earth Independent” phase) would begin, where the Phobos crew would be transported to the Transit Hab, followed by the final crewed mission to the Martian surface.

Accomplishing all of this would require that NASA commit to making regular launches over the next few years. Such was the feeling of Bill Gerstenmaier – NASA’s Associate Administrator for Human Exploration and Operations – who recently indicated that NASA will need to mount launches at least once a year to establish a “launch cadence” with the SLS.

Mission proposals of this kind were also discussed at the recent Aerospace Safety Advisory Panel (ASAP) meeting – which meets annually to discuss matters relating to NASA’s safety performance. During the course of the meeting, Bill Hill – the Deputy Associate Administrator for Exploration Systems Development (ESD) in NASA’s Human Exploration and Operations Mission Directorate (HEOMD) – provided an overview of the latest developments in NASA’s planned mission.

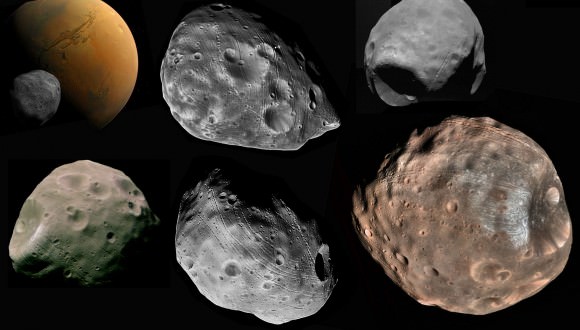
The many faces of Mars inner moon, Phobos (Credit: NASA)
The many faces of Mars inner moon, Phobos. Credit: NASA

By and large, the meeting focused on possible concepts for the Mars mission, which included using SEP and chemical propellants for sending hardware to cis-lunar space and near-Mars space, in advance of a mission to Phobos and the Martian surface. Two scenarios were proposed that would rely to these methods to varying extents, both of which called for a total of 32 SLS launches.

However, the outcome of this meeting seemed to indicate that NASA is still thinking over its long-term options and has not yet committed to anything beyond the mission to a near-Earth asteroid. For instance, NASA has indicated that it is laying the groundwork for Phase One of the Mars mission, which calls for flight testing to cis-lunar space.

However, according to Hill, NASA is currently engaged in “Phase 0” of the three phase plan, which involves the use of the ISS to test crew health via long duration space flight. In addition, there are currently no plans for developing Phases Two and Three of the mission. Other problems, such as the Orion spacecraft’s heatshield – which is currently incapable of withstanding the speed of reentry coming all the way from Mar – have yet to be resolved.

Another major issue is that of funding. Thanks to the Obama administration and the passage of the Authorization Act of 2010, NASA has been able to take several crucial steps towards developing their plan for a mission to Mars. However, in order to take things to the next level, the US government will need to show a serious commitment to ensuring that all aspects of the plan get the funding they need.

And given that it is an election year, the budget environment may be changing in the near future. As such, now is the time for the agency to demonstrate that it is fully committed to every phase of its plan to puts boots on the ground of Mars.

On the other hand, NASA has taken some very positive strides in the past six years, and one cannot deny that they are serious about making the mission happen in the time frame it has provided. They are also on track when it comes to proving key concepts and technology.

In the coming years, with flight tests of the SLS and crewed tests of the Orion, they will be even further along. And given the support of both the federal government and the private sector, nothing should stand in the way of human boots touching red soil by the 2030s.

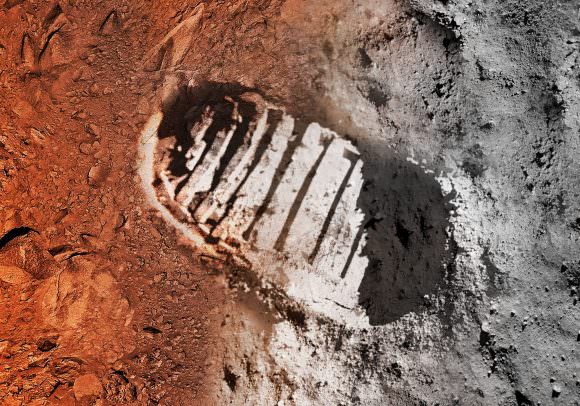
Artist's concept image of a boot print on the moon and on Mars. Credit: NASA/JPL-Caltech
Artist’s concept image of a boot print on the moon and on Mars. Credit: NASA/JPL-Caltech

Further Reading: NASA Spaceflight.com

What Are The Diameters of the Planets?

Planets in the Solar System. Image credit: NASA/JPL/IAU

The planets of our Solar System vary considerably in size and shape. Some planets are small enough that they are comparable in diameter to some of our larger moons – i.e. Mercury is smaller than Jupiter’s moon Ganymede and Saturn’s moon Titan. Meanwhile, others like Jupiter are so big that they are larger in diameter than most of the others combined.

In addition, some planets are wider at the equator than they are at the poles. This is due to a combination of the planets composition and their rotational speed. As a result, some planets are almost perfectly spherical while others are oblate spheroids (i.e. experience some flattening at the poles). Let us examine them one by one, shall we?

Mercury:

With a diameter of 4,879 km (3031.67 mi), Mercury is the smallest planet in our Solar System. In fact, Mercury is not much larger than Earth’s own Moon – which has a diameter of 3,474 km (2158.64 mi). At 5,268 km (3,273 mi) in diameter, Jupiter’s moon of Ganymede is also larger, as is Saturn’s moon Titan – which is 5,152 km (3201.34 mi) in diameter.

Mercury, as imaged by the MESSENGER spacecraft, revealing parts of the never seen by human eyes. Image Credit: NASA/Johns Hopkins University Applied Physics Laboratory/Carnegie Institution of Washington
Mercury, as imaged by the MESSENGER spacecraft, revealing parts of the never seen by human eyes. Credit: NASA/Johns Hopkins University Applied Physics Laboratory/Carnegie Institution of Washington

As with the other planets in the inner Solar System (Venus, Earth, and Mars), Mercury is a terrestrial planet, which means it is composed primarily of metals and silicate rocks that are differentiated into an iron-rich core and a silicate mantle and crust.

Also, due to the fact that Mercury has a very slow sidereal rotational period, taking 58.646 days to complete a single rotation on its axis, Mercury experiences no flattening at the poles. This means that the planet is almost a perfect sphere and has the same diameter whether it is measured from pole to pole or around its equator.

Venus:

Venus is often referred to as Earth’s “sister planet“, and not without good reason. At 12,104 km (7521 mi) in diameter, it is almost the same size as Earth. But unlike Earth, Venus experiences no flattening at the poles, which means that it almost perfectly circular. As with Mercury, this is due to Venus’ slow sidereal rotation period, taking 243.025 days to rotate once on its axis.

The planet Venus, as imaged by the Magellan 10 mission. Credit: NASA/JPL

Earth:

With a mean diameter of 12,756 km (7926 mi), Earth is the largest terrestrial planet in the Solar System and the fifth largest planet overall. However, due to flattening at its poles (0.00335), Earth is not a perfect sphere, but an oblate spheroid. As a result, its polar diameter differs from its equatorial diameter, but only by about 41 km (25.5 mi)

In short, Earth measures 12713.6 km (7900 mi) in diameter from pole to pole, and 12756.2 km (7926.3 mi) around its equator. Once again, this is due to Earth’s sidereal rotational period, which takes a relatively short 23 hours, 58 minutes and 4.1 seconds to complete a single rotation on its axis.

Mars:

Mars is often referred to as “Earth’s twin”; and again, for good reason. Like Earth, Mars experiences flattening at its poles (0.00589), which is due to its relatively rapid sidereal rotational period (24 hours, 37 minutes and 22 seconds, or 1.025957 Earth days).

As a result, it experiences a bulge at its equator which leads to a variation of 40 km (25 mi) between its polar radius and equatorial radius. This works out to Mars having a mean diameter of 6779 km (4212.275 mi), varying between 6752.4 km (4195.75 mi) between its poles and 6792.4 km (4220.6 mi) at its equator.

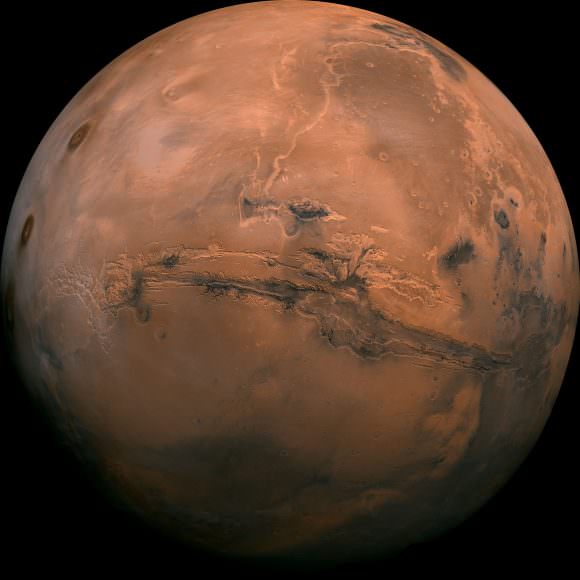
Mosaic of the Valles Marineris hemisphere of Mars, similar to what one would see from orbital distance of 2500 km. Credit: NASA/JPL-Caltech

Jupiter:

Jupiter is the largest planet in the Solar System, measuring some 142,984 km (88,846 mi) in diameter. Again, this its mean diameter, since Jupiter experiences some rather significant flattening at the poles (0.06487). This is due to its rapid rotational period, with Jupiter taking just 9 hours 55 minutes and 30 seconds to complete a single rotation on its axis.

Combined with the fact that Jupiter is a gas giant, this means the planet experiences significant bulging at its equator. Basically, it varies in diameter from 133,708 km (83,082.3 mi) when measured from pole to pole, and 142,984 km (88,846 mi) when measured around the equator. This is a difference of 9276 km (5763.8 mi), one of the most pronounced in the Solar System.

 Saturn:

With a mean diameter of 120,536 km (74897.6 mi), Saturn is the second largest planet in the Solar System. Like Jupiter, it experiences significant flattening at its poles (0.09796) due to its high rotational velocity (10 hours and 33 minutes) and the fact that it is a gas giant. This means that it varies in diameter from 108,728 km (67560.447 mi) when measured at the poles and 120,536 km (74,897.6 mi) when measured at the equator. This is a difference of almost 12,000 km, the greatest of all planets.

This portrait looking down on Saturn and its rings was created from images obtained by NASA's Cassini spacecraft on Oct. 10, 2013. Credit: NASA/JPL-Caltech/Space Science Institute/G. Ugarkovic
This portrait looking down on Saturn and its rings was created from images obtained by NASA’s Cassini spacecraft on Oct. 10, 2013. Credit: NASA/JPL-Caltech/Space Science Institute/G. Ugarkovic

Uranus:

Uranus has a mean diameter of 50,724 km (31,518.43 mi), making it the third largest planet in the Solar System. But due to its rapid rotational velocity – the planet takes 17 hours 14 minutes and 24 seconds to complete a single rotation – and its composition, the planet experiences a significant polar flattening (0.0229). This leads to a variation in diameter of 49,946 km (31,035 mi) at the poles and 51,118 km (31763.25 mi) at the equator – a difference of 1172 km (728.25 mi).

Neptune:

Lastly, there is Neptune, which has a mean diameter of 49,244 km (30598.8 mi). But like all the other gas giants, this varies due to its rapid rotational period (16 hours, 6 minutes and 36 seconds) and composition, and subsequent flattening at the poles (0.0171). As a result, the planet experiences a variation of 846 km (525.68 mi), measuring 48,682 km (30249.59 mi) at the poles and 49,528 km (30775.27 mi) at the equator.

In summary, the planets of our Solar System vary in diameter due to differences in their composition and the speed of their rotation. In short, terrestrial planets tend to be smaller than gas giants, and gas giants tend to spin faster than terrestrial worlds. Between these two factors, the worlds we know range between near-perfect spheres and flattened spheres.

We have written many articles about the Solar System here at Universe Today. Here’s Interesting Facts about the Solar SystemHow Long Is A Day On The Other Planets Of The Solar System?, What Are the Colors of the Planets?, How Long Is A Year On The Other Planets?, What Is The Atmosphere Like On Other Planets?, and How Strong is Gravity on Other Planets?

For more information of the planets, here is a look at the eight planets and some fact sheets about the planets from NASA.

Astronomy Cast has episodes on all the planets. Here is Mercury to start out with.

Scientists Identify the Source of the Moon’s Water

New research finds that asteroids delivered as much 80 percent of the Moon's water. Credit: LPI/David A. Kring

Over the course of the past few decades, our ongoing exploration the Solar System has revealed some surprising discoveries. For example, while we have yet to find life beyond our planet, we have discovered that the elements necessary for life (i.e organic molecules, volatile elements, and water) are a lot more plentiful than previously thought. In the 1960’s, it was theorized that water ice could exist on the Moon; and by the next decade, sample return missions and probes were confirming this.

Since that time, a great deal more water has been discovered, which has led to a debate within the scientific community as to where it all came from. Was it the result of in-situ production, or was it delivered to the surface by water-bearing comets, asteroids and meteorites? According to a recent study produced by a team of scientists from the UK, US and France, the majority of the Moon’s water appears to have come from meteorites that delivered water to Earth and the Moon billions of years ago.

For the sake of their study, which appeared recently in Nature Communications, the international research team examined the samples of lunar rock and soil that were returned by the Apollo missions. When these samples were originally examined upon their return to Earth, it was assumed that the trace of amounts of water they contained were the result of contamination from Earth’s atmosphere since the containers in which the Moon rocks were brought home weren’t airtight. The Moon, it was widely believed, was bone dry.

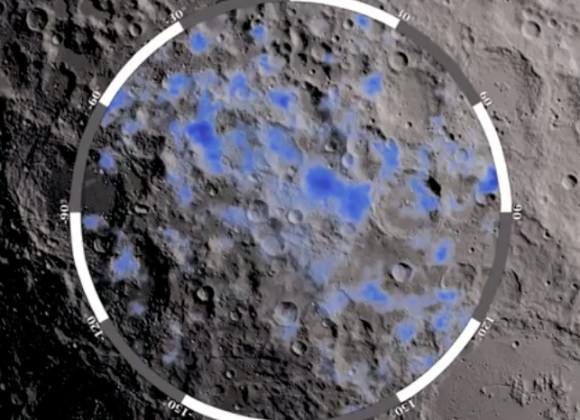
The blue areas show locations on the Moon's south pole where water ice is likely to exist (NASA/GSFC)
The blue areas show locations on the Moon’s south pole where water ice is likely to exist. Credit: NASA/GSFC

However, a 2008 study revealed that the samples of volcanic glass beads contained water molecules (46 parts per million), as well as various volatile elements (chlorine, fluoride and sulfur) that could not have been the result of contamination. This was followed up by the deployment of the Lunar Reconnaissance Orbiter (LRO) and the Lunar Crater Observation and Sensing Satellite (LCROSS) in 2009, which discovered abundant supplies of water around the southern polar region,

However, that which was discovered on the surface paled in comparison the water that was discovered beneath it. Evidence of water in the interior was first revealed by the ISRO’s Chandrayaan-1 lunar orbiter – which carried the NASA’s Moon Mineralogy Mapper (M3) and delivered it to the surface. Analysis of this and other data has showed that water in the Moon’s interior is up to a million times more abundant than what’s on the surface.

The presence of so much water beneath the surface has begged the question, where did it all come from? Whereas water that exists on the Moon’s surface in lunar regolith appears to be the result of interaction with solar wind, this cannot account for the abundant sources deep underground. A previous study suggested that it came from Earth, as the leading theory for the Moon’s formation is that a large Mars-sized body impacted our nascent planet about 4.5 billion years ago, and the resulting debris formed the Moon. The similarity between water isotopes on both bodies seems to support that theory.

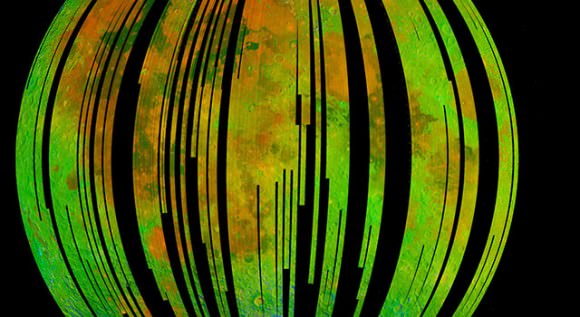
Near-infrared image of the Moon's surface by NASA's Moon Mineralogy Mapper on the Indian Space Research Organization's Chandrayaan-1 mission Image credit: ISRO/NASA/JPL-Caltech/Brown Univ./USGS
Near-infrared image of the Moon’s surface by NASA’s Moon Mineralogy Mapper on the Indian Space Research Organization’s Chandrayaan-1 mission. Credit: ISRO/NASA/JPL-Caltech/Brown Univ./USGS

However, according to Dr. David A. Kring, a member of the research team that was led by Jessica Barnes from Open University, this explanation can only account for about a quarter of the water inside the moon. This, apparently, is due to the fact that most of the water would not have survived the processes involved in the formation of the Moon, and keep the same ratio of hydrogen isotopes.

Instead, Kring and his colleagues examined the possibility that water-bearing meteorites delivered water to both (hence the similar isotopes) after the Moon had formed. As Dr. Kring told Universe Today via email:

“The current study utilized analyses of lunar samples that had been collected by the Apollo astronauts, because those samples provide the best measure of the water inside the Moon. We compared those analyses with analyses of meteoritic samples from asteroids and spacecraft analyses of comets.”

By comparing the ratios of hydrogen to deuterium (aka. “heavy hydrogen”) from the Apollo samples and known comets, they determined that a combination of primitive meteorites (carbonaceous chondrite-type) were responsible for the majority of water to be found in the Moon’s interior today. In addition, they concluded that these types of comets played an important role when it comes to the origins of water in the inner Solar System.

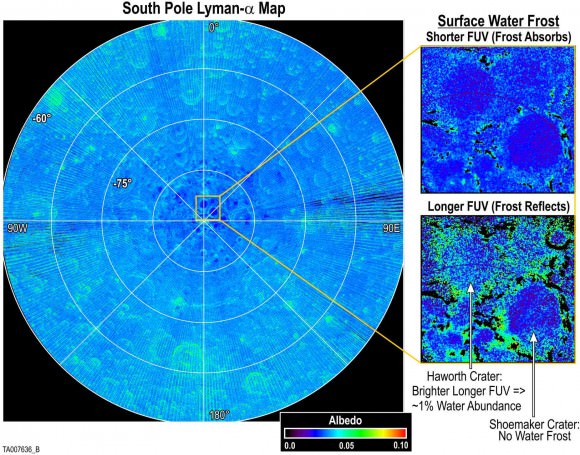
These images produced by the Lyman Alpha Mapping Project (LAMP) aboard NASA's Lunar Reconnaissance Orbiter reveal features at the Moon's northern and southern poles in the regions that lie in perpetual darkness. They show regions that are consistent with having large surface porosities — indicating "fluffy" soils — while the reddening is consistent with the presence of water frost on the surface. Credit: Southwest Research Institute
Images produced by the Lyman Alpha Mapping Project (LAMP) aboard NASA’s Lunar Reconnaissance Orbiter reveal features at the Moon’s northern and southern poles, as well as the presence of water frost. Credit: NASA/SwRI

For some time, scientists have argued that the abundance of water on Earth may be due in part to impacts from comets, trans-Neptunian objects or water-rich meteoroids. Here too, this was based on the fact that the ratio of the hydrogen isotopes (deuterium and protium) in asteroids like 67P/Churyumov-Gerasimenko revealed a similar percentage of impurities to carbon-rich chondrites that were found in the Earth’s coeans.

But how much of Earth’s water was delivered, how much was produced indigenously, and whether or not the Moon was formed with its water already there, have remained the subject of much scholarly debate. Thank to this latest study, we may now have a better idea of how and when meteorites delivered water to both bodies, thus giving us a better understanding of the origins of water in the inner Solar System.

Some meteoritic samples of asteroids contain up to 20% water,” said Kring. “That reservoir of material – that is asteroids – are closer to the Earth-Moon system and, logically, have always been a good candidate source for the water in the Earth-Moon system. The current study shows that to be true. That water was apparently delivered 4.5 to 4.3 billion years ago.

The existence of water on the Moon has always been a source of excitement, particularly to those who hope to see a lunar base established there someday. By knowing the source of that water, we can also come to know more about the history of the Solar System and how it came to be. It will also come in handy when it comes time to search for other sources of water, which will always be a factor when trying to establishing outposts and even colonies throughout the Solar System.

Further Reading: Nature Communications

How Was the Solar System Formed? – The Nebular Hypothesis

Solar System Themed Products
Solar System Montage. Credit: science.nationalgeographic.com

Since time immemorial, humans have been searching for the answer of how the Universe came to be. However, it has only been within the past few centuries, with the Scientific Revolution, that the predominant theories have been empirical in nature. It was during this time, from the 16th to 18th centuries, that astronomers and physicists began to formulate evidence-based explanations of how our Sun, the planets, and the Universe began.

When it comes to the formation of our Solar System, the most widely accepted view is known as the Nebular Hypothesis. In essence, this theory states that the Sun, the planets, and all other objects in the Solar System formed from nebulous material billions of years ago. Originally proposed to explain the origin of the Solar System, this theory has gone on to become a widely accepted view of how all star systems came to be.

Nebular Hypothesis:

According to this theory, the Sun and all the planets of our Solar System began as a giant cloud of molecular gas and dust. Then, about 4.57 billion years ago, something happened that caused the cloud to collapse. This could have been the result of a passing star, or shock waves from a supernova, but the end result was a gravitational collapse at the center of the cloud.

From this collapse, pockets of dust and gas began to collect into denser regions. As the denser regions pulled in more and more matter, conservation of momentum caused it to begin rotating, while increasing pressure caused it to heat up. Most of the material ended up in a ball at the center while the rest of the matter flattened out into disk that circled around it. While the ball at the center formed the Sun, the rest of the material would form into the protoplanetary disc.

The planets formed by accretion from this disc, in which dust and gas gravitated together and coalesced to form ever larger bodies. Due to their higher boiling points, only metals and silicates could exist in solid form closer to the Sun, and these would eventually form the terrestrial planets of Mercury, Venus, Earth, and Mars. Because metallic elements only comprised a very small fraction of the solar nebula, the terrestrial planets could not grow very large.

In contrast, the giant planets (Jupiter, Saturn, Uranus, and Neptune) formed beyond the point between the orbits of Mars and Jupiter where material is cool enough for volatile icy compounds to remain solid (i.e. the Frost Line). The ices that formed these planets were more plentiful than the metals and silicates that formed the terrestrial inner planets, allowing them to grow massive enough to capture large atmospheres of hydrogen and helium. Leftover debris that never became planets congregated in regions such as the Asteroid Belt, Kuiper Belt, and Oort Cloud.

Artist's impression of the early Solar System, where collision between particles in an accretion disc led to the formation of planetesimals and eventually planets. Credit: NASA/JPL-Caltech
Artist’s impression of the early Solar System, where collision between particles in an accretion disc led to the formation of planetesimals and eventually planets. Credit: NASA/JPL-Caltech

Within 50 million years, the pressure and density of hydrogen in the center of the protostar became great enough for it to begin thermonuclear fusion. The temperature, reaction rate, pressure, and density increased until hydrostatic equilibrium was achieved. At this point, the Sun became a main-sequence star. Solar wind from the Sun created the heliosphere and swept away the remaining gas and dust from the protoplanetary disc into interstellar space, ending the planetary formation process.

History of the Nebular Hypothesis:

The idea that the Solar System originated from a nebula was first proposed in 1734 by Swedish scientist and theologian Emanual Swedenborg. Immanuel Kant, who was familiar with Swedenborg’s work, developed the theory further and published it in his Universal Natural History and Theory of the Heavens (1755). In this treatise, he argued that gaseous clouds (nebulae) slowly rotate, gradually collapsing and flattening due to gravity and forming stars and planets.

A similar but smaller and more detailed model was proposed by Pierre-Simon Laplace in his treatise Exposition du system du monde (Exposition of the system of the world), which he released in 1796. Laplace theorized that the Sun originally had an extended hot atmosphere throughout the Solar System, and that this “protostar cloud” cooled and contracted. As the cloud spun more rapidly, it threw off material that eventually condensed to form the planets.

This image from the NASA/ESA Hubble Space Telescope shows Sh 2-106, or S106 for short. This is a compact star forming region in the constellation Cygnus (The Swan). A newly-formed star called S106 IR is shrouded in dust at the centre of the image, and is responsible for the surrounding gas cloud’s hourglass-like shape and the turbulence visible within. Light from glowing hydrogen is coloured blue in this image. Credit: NASA/ESA
The Sh 2-106 Nebula (or S106 for short), a compact star forming region in the constellation Cygnus (The Swan). Credit: NASA/ESA

The Laplacian nebular model was widely accepted during the 19th century, but it had some rather pronounced difficulties. The main issue was angular momentum distribution between the Sun and planets, which the nebular model could not explain. In addition, Scottish scientist James Clerk Maxwell (1831 – 1879) asserted that different rotational velocities between the inner and outer parts of a ring could not allow for condensation of material.

It was also rejected by astronomer Sir David Brewster (1781 – 1868), who stated that:

“those who believe in the Nebular Theory consider it as certain that our Earth derived its solid matter and its atmosphere from a ring thrown from the Solar atmosphere, which afterwards contracted into a solid terraqueous sphere, from which the Moon was thrown off by the same process… [Under such a view] the Moon must necessarily have carried off water and air from the watery and aerial parts of the Earth and must have an atmosphere.”

By the early 20th century, the Laplacian model had fallen out of favor, prompting scientists to seek out new theories. However, it was not until the 1970s that the modern and most widely accepted variant of the nebular hypothesis – the solar nebular disk model (SNDM) – emerged. Credit for this goes to Soviet astronomer Victor Safronov and his book Evolution of the protoplanetary cloud and formation of the Earth and the planets (1972). In this book, almost all major problems of the planetary formation process were formulated and many were solved.

For example, the SNDM model has been successful in explaining the appearance of accretion discs around young stellar objects. Various simulations have also demonstrated that the accretion of material in these discs leads to the formation of a few Earth-sized bodies. Thus the origin of terrestrial planets is now considered to be an almost solved problem.

While originally applied only to the Solar System, the SNDM was subsequently thought by theorists to be at work throughout the Universe, and has been used to explain the formation of many of the exoplanets that have been discovered throughout our galaxy.

Problems:

Although the nebular theory is widely accepted, there are still problems with it that astronomers have not been able to resolve. For example, there is the problem of tilted axes. According to the nebular theory, all planets around a star should be tilted the same way relative to the ecliptic. But as we have learned, the inner planets and outer planets have radically different axial tilts.

Whereas the inner planets range from almost 0 degree tilt, others (like Earth and Mars) are tilted significantly (23.4° and 25°, respectively), outer planets have tilts that range from Jupiter’s minor tilt of 3.13°, to Saturn and Neptune’s more pronounced tilts (26.73° and 28.32°), to Uranus’ extreme tilt of 97.77°, in which its poles are consistently facing towards the Sun.

The latest list of potentially habitable exoplanets, courtesy of The Planetary Habitability Laboratory. Credit: phl.upr.edu
A list of potentially habitable exoplanets, courtesy of The Planetary Habitability Laboratory. Credit: phl.upr.edu

Also, the study of extrasolar planets have allowed scientists to notice irregularities that cast doubt on the nebular hypothesis. Some of these irregularities have to do with the existence of “hot Jupiters” that orbit closely to their stars with periods of just a few days. Astronomers have adjusted the nebular hypothesis to account for some of these problems, but have yet to address all outlying questions.

Alas, it seems that it questions that have to do with origins that are the toughest to answer. Just when we think we have a satisfactory explanation, there remain those troublesome issues it just can’t account for. However, between our current models of star and planet formation, and the birth of our Universe, we have come a long way. As we learn more about neighboring star systems and explore more of the cosmos, our models are likely to mature further.

We have written many articles about the Solar System here at Universe Today. Here’s The Solar System, Did our Solar System Start with a Little Bang?, and What was Here Before the Solar System?

For more information, be sure to check out the origin of the Solar System and how the Sun and planets formed.

Astronomy Cast also has an episode on the subject – Episode 12: Where do Baby Stars Come From?

Hold On To Your Jaw. Pluto Extreme Close Up Best Yet

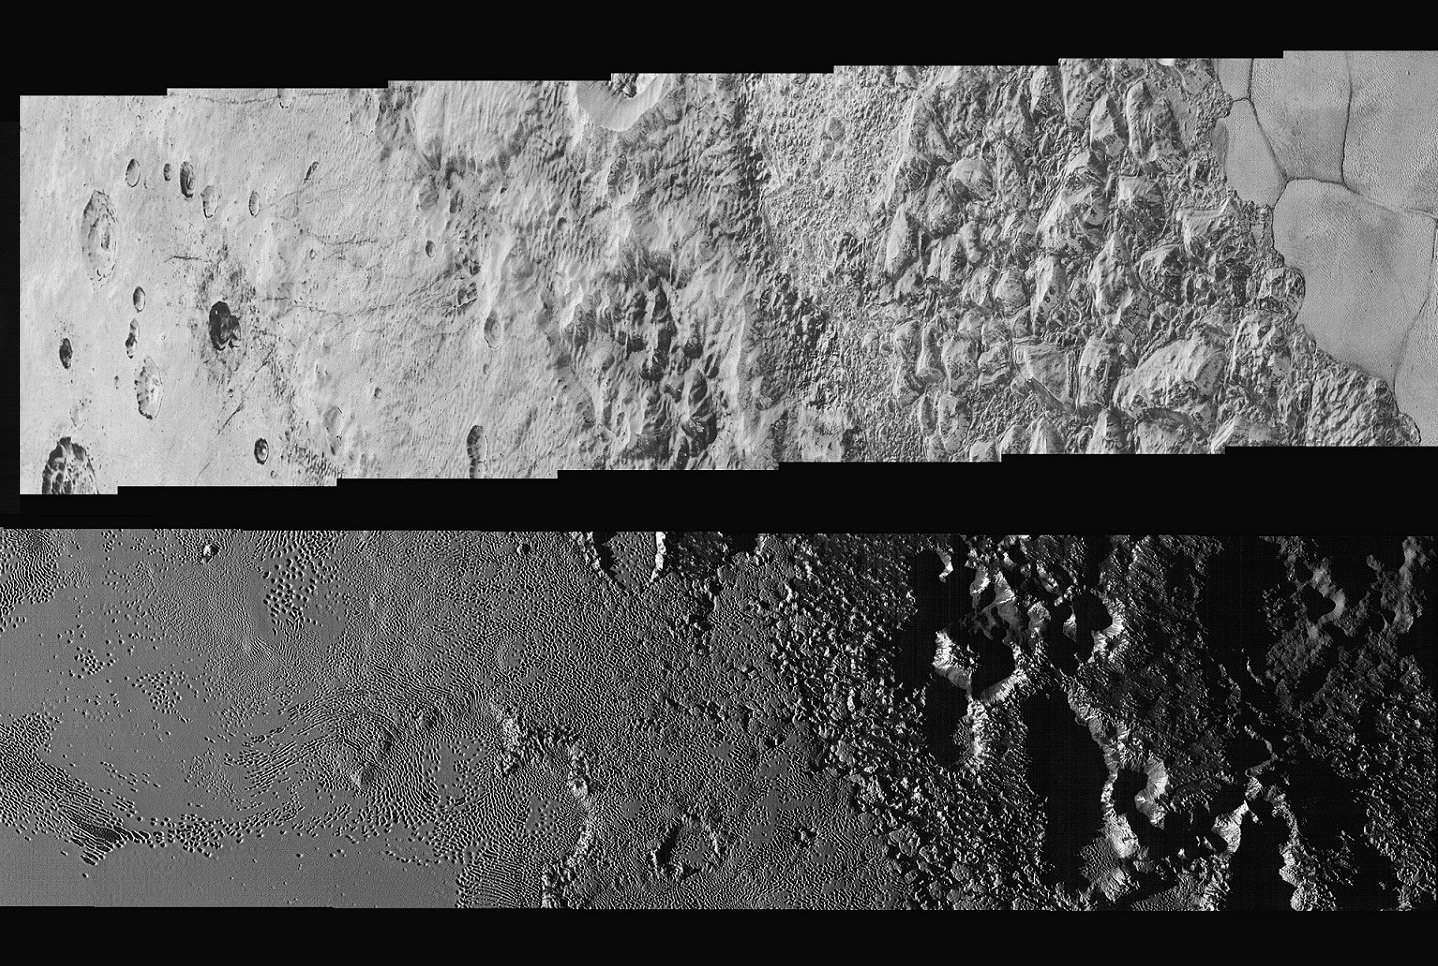
This mosaic of Pluto's surface was created from images taken by the New Horizons probe just 23 minutes before its closest approach. Credit: NASA/JHUAPL/SwRI

The New Horizons mission, which its conducted its historic flyby on July 14th, 2015, has yielded a wealth of scientific data about Pluto. This has included discoveries about Pluto’s size, its mountainous regions, its floating ice hills, and (more recently) how the dwarf planet interacts with solar wind – a discovery which showed that Pluto is actually more planet-like than previously thought.

But beyond revelations about the planet’s size, geography and surface features, it has also provided the most breathtaking, clear, and inspiring images of Pluto and its moons to date. And with this latest release of images taken by the New Horizon‘s Long Range Reconnaissance Imager (LORRI), people here on Earth are being treated to be the best close-up of Pluto yet.

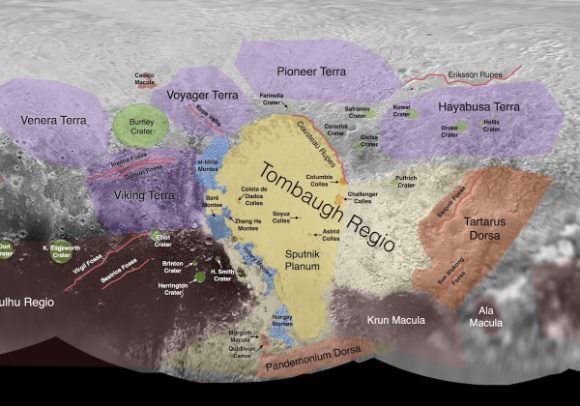
These images, which were taken while the New Horizon’s probe was still 15,850 km (9,850 mi) away from Pluto (just 23 minutes before it made its closest approach), extend across the hemisphere that the probe was facing as it flew past. It shows features ranging from the cratered northern uplands and the mountainous regions in Voyager Terra before slicing through the flatlands of “Pluto’s Heart” – aka. Tombaugh Regio – and ending up in another stretch of rugged highlands.

. Credit: earthsky.org
Informal names given to Pluto’s surface features. Credit: earthsky.org
The width of the strip varies as the images pass from north to south, from more than 90 km (55 mi) across at the northern end to about 75 km (45 mi) at its southern point. The perspective also changes, with the view appearing virtually horizontal at the northern end and then shifting to an almost top-down view onto the surface by the end.
The crystal clear photographs that make up the mosaic – which have a resolution of about 80 meters (260 feet) per pixel – offer the most detailed view of Pluto’s surface ever. With this kind of clarity, NASA scientists are able to discern features that were never before visible, and learn things about the kinds of geological processes which formed them.

This includes the chaotic nature of the mountains in the northern hemisphere, and the varied nature of the icy nitrogen plains across Tombaugh Regio – which go from being cellular, to non-cellular, to a cross-bedding pattern. These features are a further indication that Pluto’s surface is the product of a combination of geological forces, such as cryovolcanism, sublimation, geological activity, convection between water and nitrogen ice, and interaction between the surface and atmosphere.

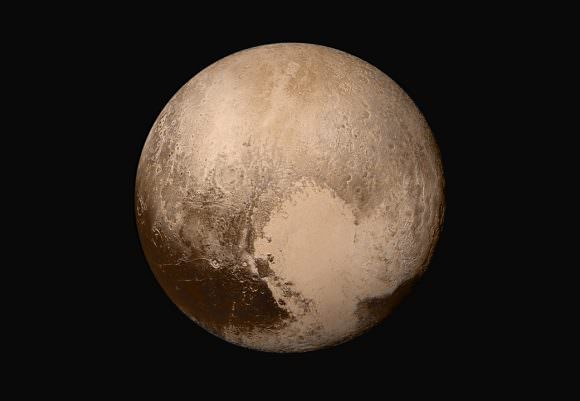
Four images from New Horizons’ Long Range Reconnaissance Imager (LORRI) were combined with color data from the Ralph instrument to create this global view of Pluto. Credits: NASA/JHUAPL/SwRI
Images snapped by New Horizons’ Long Range Reconnaissance Imager (LORRI) while the probe was still on approach to Pluto were combined with color data from the Ralph instrument to create this global view of Pluto. Credits: NASA/JHUAPL/SwRI

Alan Stern, the principal investigator of the New Horizons mission and the Associate Vice President of Research and Development at the Southwest Research Institute, was especially impressed with this latest find. As he told Universe Today via email:

“This new high resolution image mosaic is the complete highest resolution strip of images New Horizons obtained, and its both eye candy gorgeous and scientifically rich. Think about it— one flyby and we have this mosaic, plus so much more; no dataset like this existed on Mars until we’d flown half a dozen missions there!”

The most distant flyby in the history of space exploration, and yet we’ve obtained more from this one mission than multiple flybys were able to provide from one of Earth’s closest neighbors. Fascinating! And what’s more, new information is expected to be coming from the New Horizons probe until this coming October. To top it off, our scientists are still not finished analyzing all the information the mission collected during its flyby.

The full-resolution image can be viewed here, and be sure to enjoy this NASA video of the mosaic:

Further Reading: NASA

The Orbit of Mars. How Long is a Year on Mars?

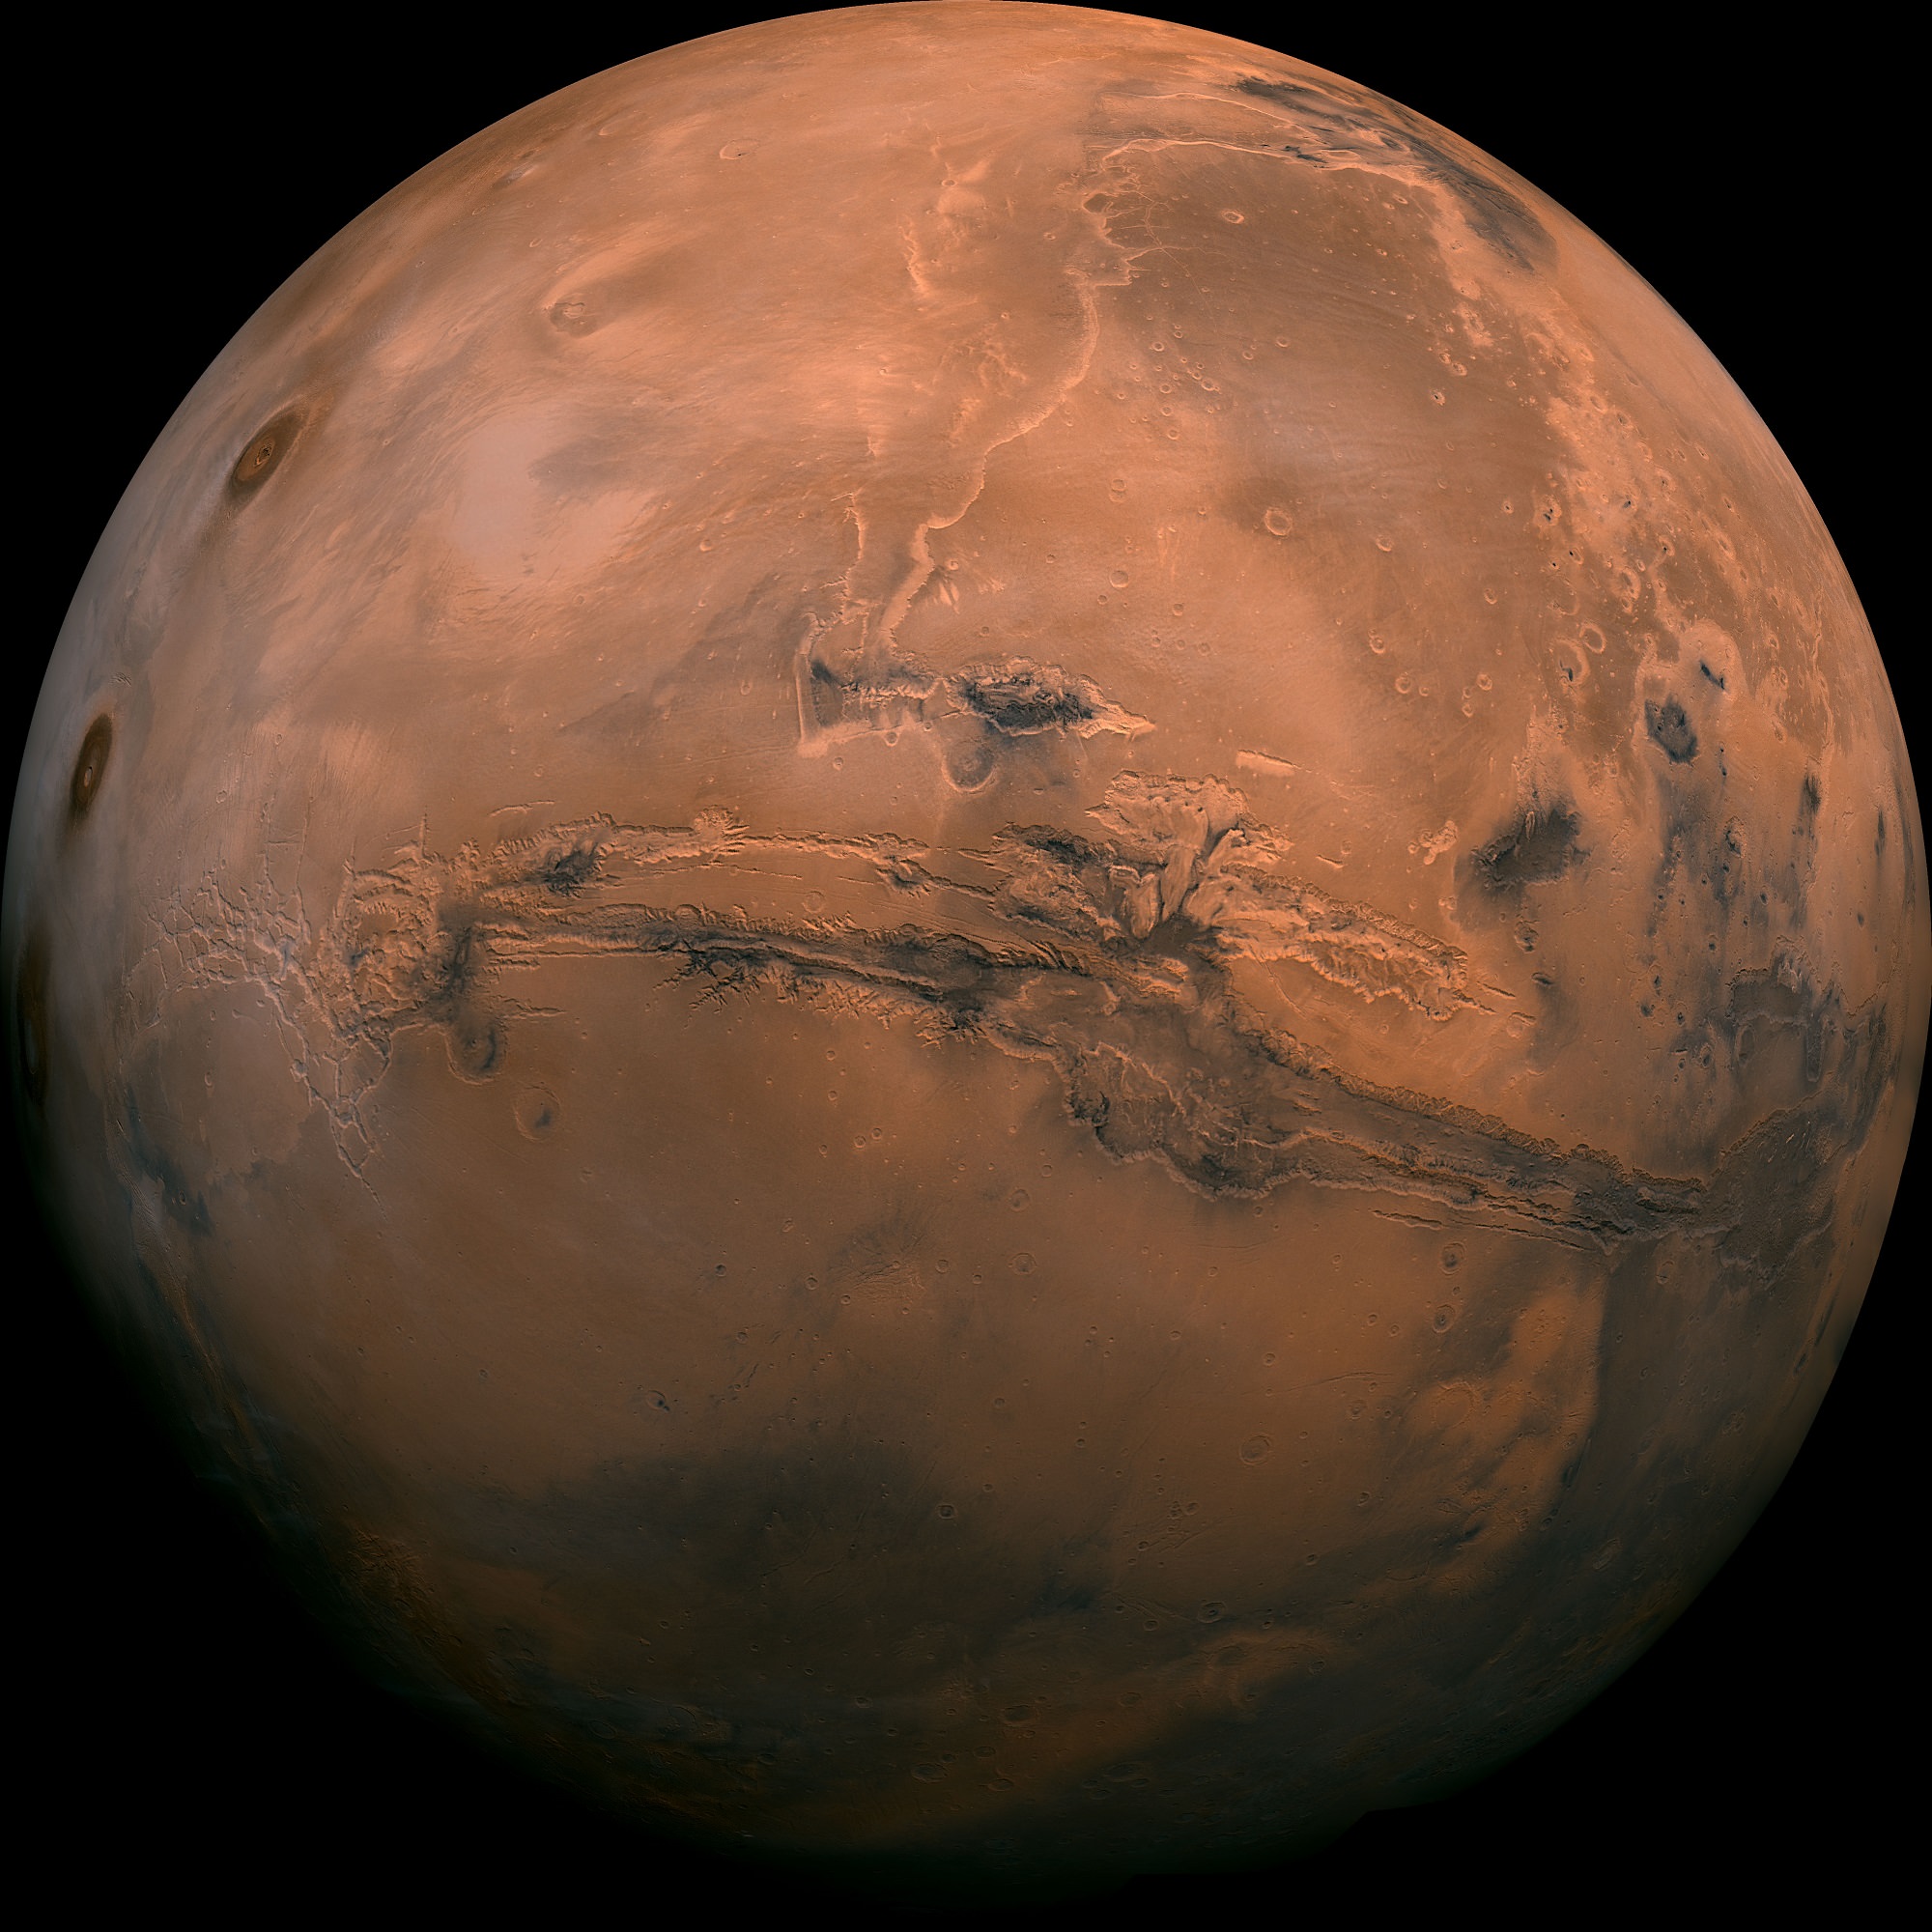
Mosaic of the Valles Marineris hemisphere of Mars, similar to what one would see from orbital distance of 2500 km. Credit: NASA/JPL-Caltech

Mars and Earth have quite a few things in common. Both are terrestrial planets, both are located within the Sun’s habitable zone, both have polar ice caps, similarly tilted axes, and similar variations in temperature. And according to some of the latest scientific data obtained by rovers and atmospheric probes, it is now known that Mars once had a dense atmosphere and was covered with warm, flowing water.

But when it comes to things like the length of a year, and the length of seasons, Mars and Earth are quite different. Compared to Earth, a year on Mars lasts almost twice as long – 686.98 Earth days. This is due to the fact that Mars is significantly farther from the Sun and its orbital period (the time it takes to orbit the Sun) is significantly greater than that of Earth’s.

Orbital Period:

Mars average distance (semi-major axis) from the Sun is 227,939,200 km (141,634,852.46 mi) which is roughly one and half times the distance between the Earth and the Sun (1.52 AU). Compared to Earth, its orbit is also rather eccentric (0.0934 vs. 0.0167), ranging from 206.7 million km (128,437,425.435 mi; 1.3814 AU) at perihelion to 249.2 million km (154,845,701 mi; 1.666 AU) at aphelion. At this distance, and with an orbital speed of 24.077 km/s, Mars takes 686.971 Earth days, the equivalent of 1.88 Earth years, to complete a orbit around the Sun.

The eccentricity in Mars' orbit means that it is . Credit: NASA
The eccentricity in Mars’ orbit means that it is . Credit: NASA

This eccentricity is one of the most pronounced in the Solar System, with only Mercury having a greater one (0.205). However, this wasn’t always the case. Roughly 1.35 million years ago, Mars had an eccentricity of just 0.002, making its orbit nearly circular. It reached a minimum eccentricity of 0.079 some 19,000 years ago, and will peak at about 0.105 in about 24,000 years from now.

But for the last 35,000 years, the orbit of Mars has been getting slightly more eccentric because of the gravitational effects of the other planets. The closest distance between Earth and Mars will continue to mildly decrease for the next 25,000 years. And in about 1,000,000 years from now, its eccentricity will once again be close to what it is now – with an estimated eccentricity of 0.01.

Earth Days vs. Martian “Sols”:

Whereas a year on Mars is significantly longer than a year on Earth, the difference between an day on Earth and a Martian day (aka. “Sol”) is not significant. For starters, Mars takes 24 hours 37 minutes and 22 seconds to complete a single rotation on its axis (aka. a sidereal day), where Earth takes just slightly less (23 hours, 56 minutes and 4.1 seconds).

On the other hand, it takes 24 hours, 39 minutes, and 35 seconds for the Sun to appear in the same spot in the sky above Mars (aka. a solar day), compared to the 24 hour solar day we experience here on Earth. This means that, based on the length of a Martian day, a Martian year works out to 668.5991 Sols.

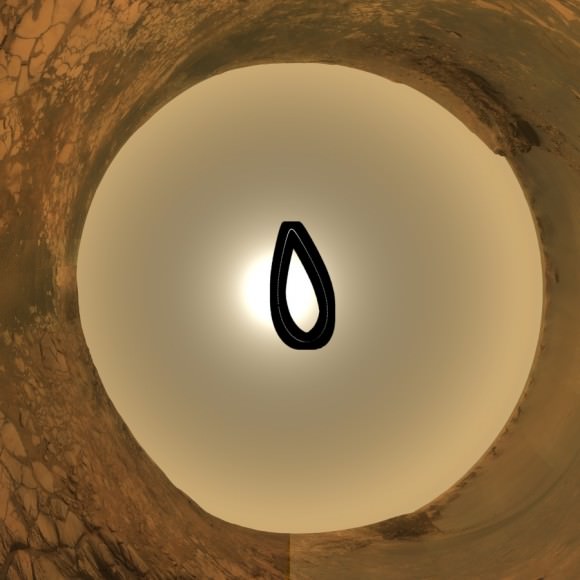
The Opportunity rover captured this analemma showing the Sun's movements over one Martian year. Images taken every third sol (Martian day) between July, 16, 2006 and June 2, 2008. Credit: NASA/JPL/Cornell/ASU/TAMU
The Opportunity rover captured this analemma showing the Sun’s movements over one Martian year. Images taken every third sol (Martian day) between July, 16, 2006 and June 2, 2008. Credit: NASA/JPL/Cornell/ASU/TAMU

Seasonal Variations:

Mars also has a seasonal cycle that is similar to that of Earth’s. This is due in part to the fact that Mars also has a tilted axis, which is inclined 25.19° to its orbital plane (compared to Earth’s axial tilt of approx. 23.44°). It’s also due to Mars orbital eccentricity, which means it will periodically receive less in the way of the Sun’s radiance during at one time of the year than another. This change in distance causes significant variations in temperature.

While the planet’s average temperature is -46 °C (51 °F), this ranges from a low of -143 °C (-225.4 °F) during the winter at the poles to a high of 35 °C (95 °F) during summer and midday at the equator. This works out to a variation in average surface temperature that is quite similar to Earth’s – a difference of 178 °C (320.4 °F) versus 145.9 °C (262.5 °F). This high in temperatures is also what allows for liquid water to still flow (albeit intermittently) on the surface of Mars.

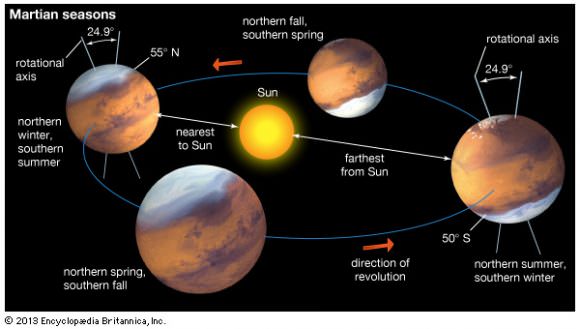
In addition, Mars’ eccentricity means that it travels more slowly in its orbit when it is further from the Sun, and more quickly when it is closer (as stated in Kepler’s Three Laws of Planetary Motion). Mars’ aphelion coincides with Spring in its northern hemisphere, which makes it the longest season on the planet – lasting roughly 7 Earth months. Summer is second longest, lasting six months, while Fall and Winter last 5.3 and just over 4 months, respectively.

Artist's impression of the seasons on Mars. Credit: britannica.com
Artist’s impression of the seasons on Mars. Credit: britannica.com

In the south, the length of the seasons is only slightly different. Mars is near perihelion when it is summer in the southern hemisphere and winter in the north, and near aphelion when it is winter in the southern hemisphere and summer in the north. As a result, the seasons in the southern hemisphere are more extreme and the seasons in the northern are milder. The summer temperatures in the south can be up to 30 K (30 °C; 54 °F) warmer than the equivalent summer temperatures in the north.

Weather Patterns:

These seasonal variations allow Mars to experience some extremes in weather. Most notably, Mars has the largest dust storms in the Solar System. These can vary from a storm over a small area to gigantic storms (thousands of km in diameter) that cover the entire planet and obscure the surface from view. They tend to occur when Mars is closest to the Sun, and have been shown to increase the global temperature.

The first mission to notice this was the Mariner 9 orbiter, which was the first spacecraft to orbit Mars in 1971, it sent pictures back to Earth of a world consumed in haze. The entire planet was covered by a dust storm so massive that only Olympus Mons, the giant Martian volcano that measures 24 km high, could be seen above the clouds. This storm lasted for a full month, and delayed Mariner 9‘s attempts to photograph the planet in detail.

And then on June 9th, 2001, the Hubble Space Telescope spotted a dust storm in the Hellas Basin on Mars. By July, the storm had died down, but then grew again to become the largest storm in 25 years. So big was the storm that amateur astronomers using small telescopes were able to see it from Earth. And the cloud raised the temperature of the frigid Martian atmosphere by a stunning 30° Celsius.

These storms tend to occur when Mars is closest to the Sun, and are the result of temperatures rising and triggering changes in the air and soil. As the soil dries, it becomes more easily picked up by air currents, which are caused by pressure changes due to increased heat. The dust storms cause temperatures to rise even further, leading to Mars’ experiencing its own greenhouse effect.

Given the differences in seasons and day length, one is left to wonder if a standard Martian calendar could ever be developed. In truth, it could, but it would be a bit of a challenge. For one, a Martian calendar would have to account for Mars’ peculiar astronomical cycles, and our own non-astronomical cycles like the 7-day week work with them.

Another consideration in designing a calendar is accounting for the fractional number of days in a year. Earth’s year is 365.24219 days long, and so calendar years contain either 365 or 366 days accordingly. Such a formula would need to be developed to account for the 668.5921-sol Martian year. All of this will certainly become an issue as human beings become more and more committed to exploring (and perhaps colonizing) the Red Planet.

We have written many interesting articles about Mars here at Universe Today. Here’s How Long is a Year on the Other Planets?, Which Planet has the Longest Day?, How Long is a Year on Mercury, How Long is a Year on Earth?, How Long is a Year on Venus?, How Long is a Year on Jupiter?, How Long is a Year on Saturn?, How Long is a Year on Uranus?, How Long is a Year on Neptune?, How Long is a Year on Pluto?

For more information, check out NASA’s Solar System Exploration page on Mars.

Astronomy Cast also has several interesting episodes on the subject. Like Episode 52: Mars, and Episode 91: The Search for Water on Mars.

What is the Coldest Planet of Our Solar System?

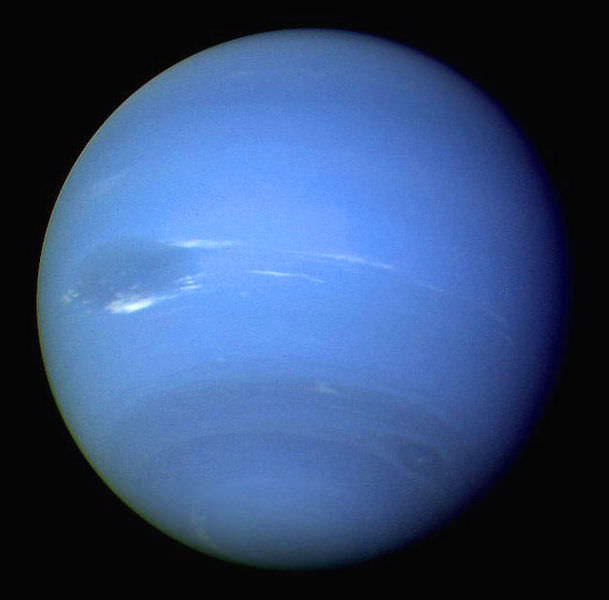
Neptune photographed by Voyage. Image credit: NASA/JPL
Neptune photographed by Voyager 2. Image credit: NASA/JPL

The Solar System is pretty huge place, extending from our Sun at the center all the way out to the Kuiper Cliff – a boundary within the Kuiper Belt that is located 50 AU from the Sun. As a rule, the farther one ventures from the Sun, the colder and more mysterious things get. Whereas temperatures in the inner Solar System are enough to burn you alive or melt lead, beyond the “Frost Line“, they get cold enough to freeze volatiles like ammonia and methane.

So what is the coldest planet of our Solar System? In the past, the title for “most frigid body” went to Pluto, as it was the farthest then-designated planet from the Sun. However, due to the IAU’s decision in 2006 to reclassify Pluto as a “dwarf planet”, the title has since passed to Neptune. As the eight planet from our Sun, it is now the outermost planet in the Solar System, and hence the coldest.

Orbit and Distance:

With an average distance (semi-major axis) of 4,504,450,000 km (2,798,935,466.87 mi or 30.11 AU), Neptune is the farthest planet from the Sun. The planet has a very minor eccentricity of 0.0086, which means that its orbit around the Sun varies from a distance of 29.81 AU (4.459 x 10⁹ km) at perihelion to 30.33 AU (4.537 x 10⁹ km) at aphelion.

The Solar System. Credit: NASA

Because Neptune’s axial tilt (28.32°) is similar to that of Earth (~23°) and Mars (~25°), the planet experiences similar seasonal changes. Combined with its long orbital period, this means that the seasons last for forty Earth years. Also owing to its axial tilt being comparable to Earth’s is the fact that the variation in the length of its day over the course of the year is not any more extreme than it is on Earth.

Average Temperature:

When it comes to ascertaining the average temperature of a planet, scientists rely on temperature variations measured from the surface. As a gas/ice giant, Neptune has no surface, per se. As a result, scientists rely on temperature readings from where the atmospheric pressure is equal to 1 bar (100 kPa), the equivalent to atmospheric pressure at sea level here on Earth.

On Neptune, this area of the atmosphere is just below the upper level clouds. Pressures in this region range between 1 and 5 bars (100 – 500 kPa), and temperature reach a high of 72 K (-201.15 °C; -330 °F). At this temperature, conditions are suitable for methane to condense, and clouds of ammonia and hydrogen sulfide are thought to form (which is what gives Neptune its characteristically dark cyan coloring).

Farther into space, where pressures drop to about 0.1 bars (10 kPa), temperatures decrease to their low of around 55 K (-218 °C; -360 °F). Further into the planet, pressures increase dramatically, which also leads to a dramatic increase in temperature. At its core, Neptune reaches temperatures of up to 7273 K (7000 °C; 12632 °F), which is comparable to the surface of the Sun.

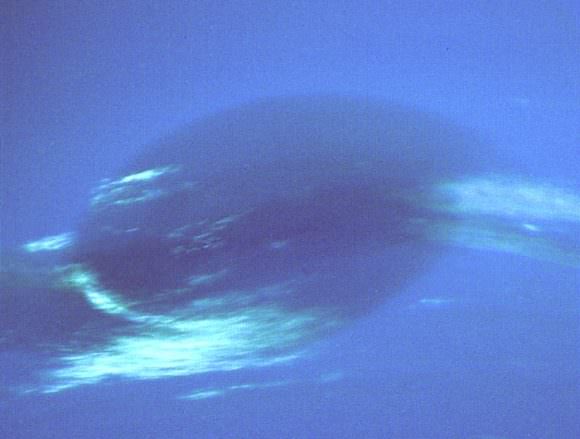
Neptune Great Dark Spot in High Resolution
Neptune Great Dark Spot in High Resolution. Credit: NASA/JPL

The huge temperature differences between Neptune’s center and its surface (along with its differential rotation) create huge wind storms, which can reach as high as 2,100 km/hour, making them the fastest in the Solar System. The first to be spotted was a massive anticyclonic storm measuring 13,000 x 6,600 km and resembling the Great Red Spot of Jupiter.

Known as the Great Dark Spot, this storm was not spotted five later (Nov. 2nd, 1994) when the Hubble Space Telescope looked for it. Instead, a new storm that was very similar in appearance was found in the planet’s northern hemisphere, suggesting that these storms have a shorter lifespan than Jupiter’s. The Scooter is another storm, a white cloud group located farther south than the Great Dark Spot.

This nickname first arose during the months leading up to the Voyager 2 encounter in 1989, when the cloud group was observed moving at speeds faster than the Great Dark Spot. The Small Dark Spot, a southern cyclonic storm, was the second-most-intense storm observed during the 1989 encounter. It was initially completely dark; but as Voyager 2 approached the planet, a bright core developed and could be seen in most of the highest-resolution images.

Temperature Anomalies:

Despite being 50% further from the Sun than Uranus – which orbits the Sun at an average distance of 2,875,040,000 km (1,786,467,032.5 mi or 19.2184 AU) – Neptune receives only 40% of the solar radiation that Uranus does. In spite of that, the two planets’ surface temperatures are surprisingly close, with Uranus experiencing an average “surface” temperature of 76 K (-197.2 °C)

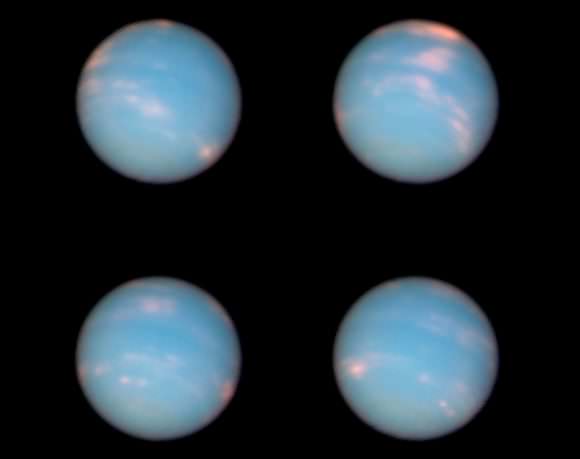
Four images of Neptune taken a few hours apart by the Hubble Space Telescope on June 25-26, 2011. Credit: NASA, ESA and the Hubble Heritage Team (STScI/AURA)

And while temperatures similarly increase the further one ventures into the core, the discrepancy is larger. Uranus only radiates 1.1 times as much energy as it receives from the Sun, whereas Neptune radiates about 2.61 times as much. Neptune is the farthest planet from the Sun, yet its internal energy is sufficient to drive the fastest planetary winds seen in the Solar System.

One would expect Neptune to be much colder than Uranus, and the mechanism for this remains unknown. However, astronomers have theorized that  Neptune’s higher internal temperature (and the exchange of heat between the core and outer layers) might be the reason for why Neptune isn’t significantly colder than Uranus.

As already noted, Pluto’s surface temperatures do get to being lower than Neptune’s. Between its greater distance from the Sun, and the fact that it is not a gas/ice giant (so therefore doesn’t have extreme temperatures at its core) means that it experiences temperatures between a high of 55 K (-218 °C; -360 °F)and a low of 33 K (-240 °C; -400 °F). However, since it is no longer classified as a planet (but a dwarf planet, TNO, KBO, plutoid, etc.) it is no longer in the running. Sorry, Pluto!

We’ve written many articles about Neptune here at Universe Today. Here’s Who Discovered Neptune?, What is the Surface Temperature of Neptune?, What is the Surface of Neptune Like?, 10 Interesting Facts about Neptune, The Rings of Neptune, How Many Moons Does Neptune Have?

If you’d like more information on Neptune, take a look at Hubblesite’s News Releases about Neptune, and here’s a link to NASA’s Solar System Exploration Guide to Neptune.

We’ve also recorded an entire episode of Astronomy Cast all about Neptune. Listen here, Episode 63: Neptune.