Meteorite May Contain Proof of Life on Mars, Researchers Say

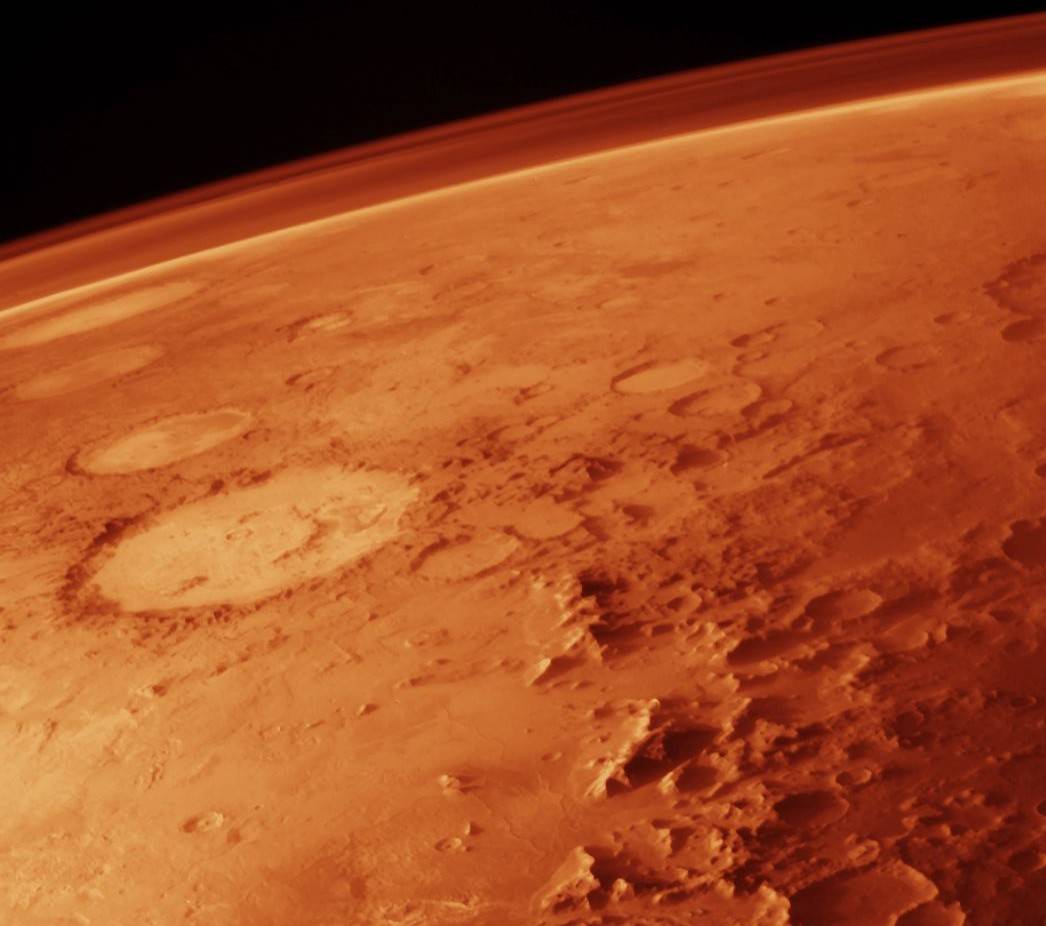
The idea that Mars could have supported life at one time is the subject of ongoing debate. Image credit: NASA

Mars is currently home to a small army robotic rovers, satellites and orbiters, all of which are busy at work trying to unravel the deeper mysteries of Earth’s neighbor. These include whether or not the planet ever had liquid water on its surface, what the atmosphere once looked like, and – most importantly of all – if it ever supported life.

And while much has been learned about Martian water and its atmosphere, the all-important question of life remains unanswered. Until such time as organic molecules – considered to be the holy grail for missions like Curiosity – are found, scientists must look elsewhere to find evidence of Martian life.

According to a recent paper submitted by an international team of scientists, that evidence may have arrived on Earth three and a half years ago aboard a meteorite that fell in the Moroccan desert. Believed to have broken away from Mars 700,000 years ago, so-called Tissint meteorite has internal features that researchers say appear to be organic materials.

The paper appeared in the scientific journal Meteoritics and Planetary Sciences. In it, the research team – which includes scientists from the Swiss Federal Institute of Technology in Lausanne (EPFL) – indicate organic carbon is located inside fissures in the rock. All indications are the meteorite is Martian in origin.

“So far, there is no other theory that we find more compelling,” says Philippe Gillet, director of EPFL’s Earth and Planetary Sciences Laboratory. He and his colleagues from China, Japan and Germany performed a detailed analysis of organic carbon traces from a Martian meteorite, and have concluded that they have a very probable biological origin.
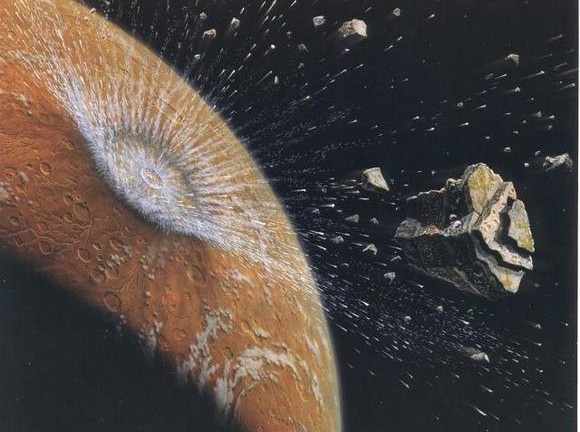
Artist's conception of an fragment as it blasts off from Mars. Boulder-sized planetary fragments could be a mechanism that carried life between Mars and Earth, UA planetary scientist Jay Melosh says. (Credit: The Planetary Society)
Artist’s conception of an fragment as it blasts off from Mars as a result of a meteor impact. Credit: The Planetary Society

The scientists argue that carbon could have been deposited into the fissures of the rock when it was still on Mars by the infiltration of fluid that was rich in organic matter.

If this sounds familiar, you may recall a previous Martian meteorite named ALH84001, found in the Allen Hills region in Antarctica. In 1996 NASA researchers announced they had found evidence within ALH84001 that strongly suggested primitive life may have existed on Mars more than 3.6 billion years ago. While subsequent studies of the now famous Allen Hills Meteorite shot down theories that the Mars rock held fossilized alien life, both sides continue to debate the issue.

This new research on the Tissint meteorite will likely be reviewed and rebutted, as well.

The researchers say the meteorite was likely ejected from Mars after an asteroid crashed on its surface, and fell to Earth on July 18, 2011, and fell in Morocco in view of several eyewitnesses.

Upon examination, the alien rock was found to have small fissures that were filled with carbon-containing matter. Several research teams have already shown that this component is organic in nature, but they are still debating where the carbon came from.

Chemical, microscopic and isotope analysis of the carbon material led the researchers to several possible explanations of its origin. They established characteristics that unequivocally excluded a terrestrial origin, and showed that the carbon content were deposited in the Tissint’s fissures before it left Mars.

This research challenges research proposed in 2012 that asserted that the carbon traces originated through the high-temperature crystallization of magma. According to the new study, a more likely explanation is that liquids containing organic compounds of biological origin infiltrated Tissint’s “mother” rock at low temperatures, near the Martian surface.
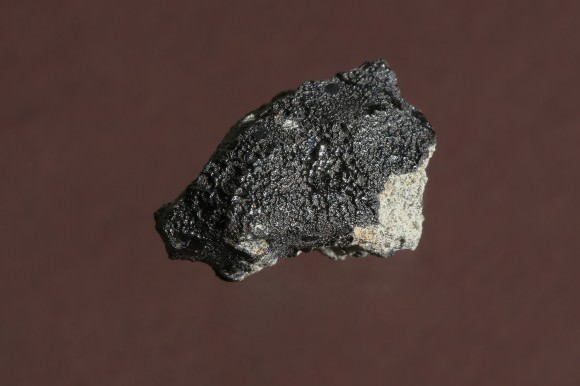
A piece of the Tissint meteorite that came to Earth via Mars. Credit: EPFL/Alain Herzog
A piece of the Tissint meteorite that landed on Earth on July 18th, 2011. Credit: EPFL/Alain Herzog

These conclusions are supported by several intrinsic properties of the meteorite’s carbon, e.g. its ratio of carbon-13 to carbon-12. This was found to be significantly lower than the ratio of carbon-13 in the CO2 of Mars’s atmosphere, previously measured by the Phoenix and Curiosity rovers.

Moreover, the difference between these ratios corresponds perfectly with what is observed on Earth between a piece of coal – which is biological in origin – and the carbon in the atmosphere.

The researchers note that this organic matter could also have been brought to Mars when very primitive meteorites – carbonated chondrites – fell on it. However, they consider this scenario unlikely because such meteorites contain very low concentrations of organic matter.

“Insisting on certainty is unwise, particularly on such a sensitive topic,” warns Gillet. “I’m completely open to the possibility that other studies might contradict our findings. However, our conclusions are such that they will rekindle the debate as to the possible existence of biological activity on Mars – at least in the past.”

Be sure to check out these videos from EPFL News, which include an interview with Philippe Gillet, EPFL and co-author of the study:

And this video explaining the history of the Tissint meteor:

Further Reading: EPFL

The Inner Planets of Our Solar System

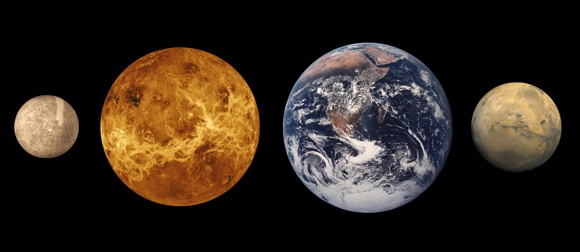
The terrestrial planets of our Solar System at approximately relative sizes. From left, Mercury, Venus, Earth and Mars. Credit: Lunar and Planetary Institute

Our Solar System is an immense and amazing place. Between its eight planets, 176 moons, 5 dwarf planets (possibly hundreds more), 659,212 known asteroids, and 3,296 known comets, it has wonders to sate the most demanding of curiosities. Our Solar System is made up of different regions, which are delineated based on their distance from the Sun, but also the types of planets and bodies that can be found within them.

In the inner Solar System, we find the “Inner Planets” – Mercury, Venus, Earth, and Mars – which are so named because they orbit closest to the Sun. In addition to their proximity, these planets have a number of key differences that set them apart from planets elsewhere in the Solar System.

For starters, the inner planets are rocky and terrestrial, composed mostly of silicates and metals, whereas the outer planets are gas giants. The inner planets are also much more closely spaced than their outer Solar System counterparts. In fact, the radius of the entire region is less than the distance between the orbits of Jupiter and Saturn.

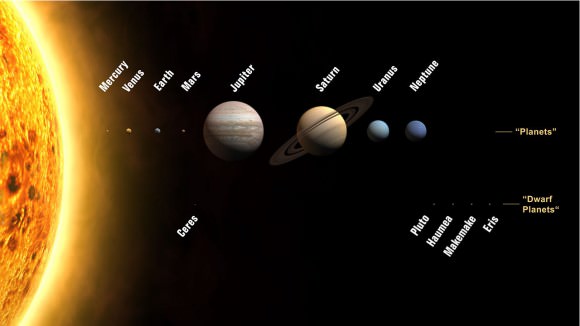
The positions and names of planets and dwarf planets in the solar system. Credit: Planets2008/Wikimedia Commons
The positions and names of planets and dwarf planets in the solar system.
Credit: Planets2008/Wikimedia Commons

This region is also within the “frost line,” which is a little less than 5 AU (about 700 million km) from the Sun. This line represents the boundary in a system where conditions are warm enough that hydrogen compounds such as water, ammonia, and methane are able to take liquid form. Beyond the frost line, these compounds condense into ice grains.Some scientists refer to the frost line as the “Goldilocks Zone” — where conditions for life may be “just right.”

Generally, inner planets are smaller and denser than their counterparts, and have few to no moons or rings circling them. The outer planets, meanwhile, often have dozens of satellites and rings composed of particles of ice and rock.

The terrestrial inner planets are composed largely of refractory minerals, such as the silicates, which form their crusts and mantles, and metals such as iron and nickel which form their cores. Three of the four inner planets (Venus, Earth and Mars) have atmospheres substantial enough to generate weather. All of them have impact craters and tectonic surface features as well, such as rift valleys and volcanoes.

Mercury:

Of the inner planets, Mercury is the closest to our Sun and the smallest of the terrestrial planets. This small planet looks very much like the Earth’s Moon and is even a similar grayish color, and it even has many deep craters and is covered by a thin layer of tiny particle silicates.

Its magnetic field is only about 1 percent that of Earth’s, and it’s very thin atmosphere means that it is hot during the day (up to 430°C) and freezing at night (as low as -187 °C) because the atmosphere can neither keep heat in or out. It has no moons of its own and is comprised mostly of iron and nickel. Mercury is one of the densest planets in the Solar System.

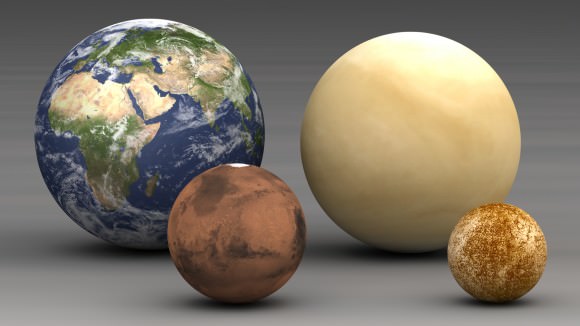
The inner planets to scale. From left to right: Earth, Mars, Venus, and Mercury. Credit: Wikimedia Commons/Lsmpascal

Venus:

Venus, which is about the same size as Earth, has a thick toxic atmosphere that traps heat, making it the hottest planet in the Solar System. This atmosphere is composed of 96% carbon dioxide, along with nitrogen and a few other gases. Dense clouds within Venus’ atmosphere are composed of sulphuric acid and other corrosive compounds, with very litter water.

Only two spacecraft have ever penetrated Venus’s thick atmosphere, but it’s not just man-made objects that have trouble getting through. There are fewer crater impacts on Venus than other planets because all but the largest meteors don’t make it through the thick air without disintegrating. Much of Venus’ surface is marked with volcanoes and deep canyons — the biggest of which is over 6400 km (4,000 mi) long.

Venus is often called the “morning star” because, with the exception of Earth’s moon, it’s the brightest object we see in the sky. Like Mercury, Venus has no moon of its own.

Earth:

Earth is the third inner planet and the one we know best. Of the four terrestrial planets, Earth is the largest, and the only one that currently has liquid water, which is necessary for life as we know it. Earth’s atmosphere protects the planet from dangerous radiation and helps keep valuable sunlight and warmth in, which is also essential for life to survive.

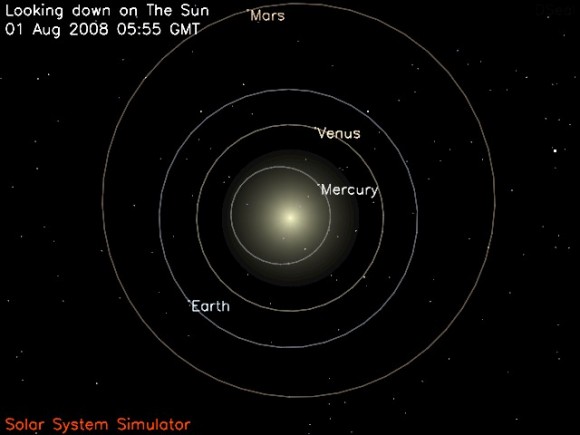
Inner Solar System. Image credit: NASA
Illustration of the Inner Planets and their orbits around the Sun Image credit: NASA

Like the other terrestrial planets, Earth has a rocky surface with mountains and canyons, and a heavy metal core. Earth’s atmosphere contains water vapor, which helps to moderate daily temperatures. Like Mercury, the Earth has an internal magnetic field. And our Moon, the only one we have, is comprised of a mixture of various rocks and minerals.

Mars:

Mars is the fourth and final inner planet, and also known as the “Red Planet” due to the rust of iron-rich materials that form the planet’s surface. Mars also has some of the most interesting terrain features of any of the terrestrial planets. These include the largest mountain in the Solar System – Olympus Mons – which rises some 21,229 m (69,649 ft) above the surface, and a giant canyon called Valles Marineris. Valles Marineris is 4000 km (2500 mi) long and reaches depths of up to 7 km (4 mi)!

For comparison, the Grand Canyon in Arizona is about 800 km (500 mi) long and 1.6 km (1 mi) deep. In fact, the extent of Valles Marineris is as long as the United States and it spans about 20 percent (1/5) of the entire distance around Mars. Much of the surface is very old and filled with craters, but there are geologically newer areas of the planet as well.

A top-down image of the orbits of Earth and Mars. Image: NASA
A top-down image of the orbits of Earth and Mars. Credit: NASA

At the Martian poles are polar ice caps that shrink in size during the Martian spring and summer. Mars is less dense than Earth and has a smaller magnetic field, which is indicative of a solid core, rather than a liquid one.

Mars’ thin atmosphere has led some astronomers to believe that the surface water that once existed there might have actually taken liquid form, but has since evaporated into space. The planet has two small moons called Phobos and Deimos.

Beyond Mars are the four outer planets: Jupiter, Saturn, Uranus, and Neptune.

We have written many interesting articles about the inner planets here at Universe Today. Here’s The Solar System Guide as well as The Inner and Outer Planets in Our Solar System.

For more information, check out this article from NASA on the planets of the Solar System and this article from Solstation about the inner planets.

Astronomy Cast also has episodes on all of the inner planets including this one about Mercury.

Planets Could Travel Along with Rogue ‘Hypervelocity’ Stars, Spreading Life Throughout the Universe

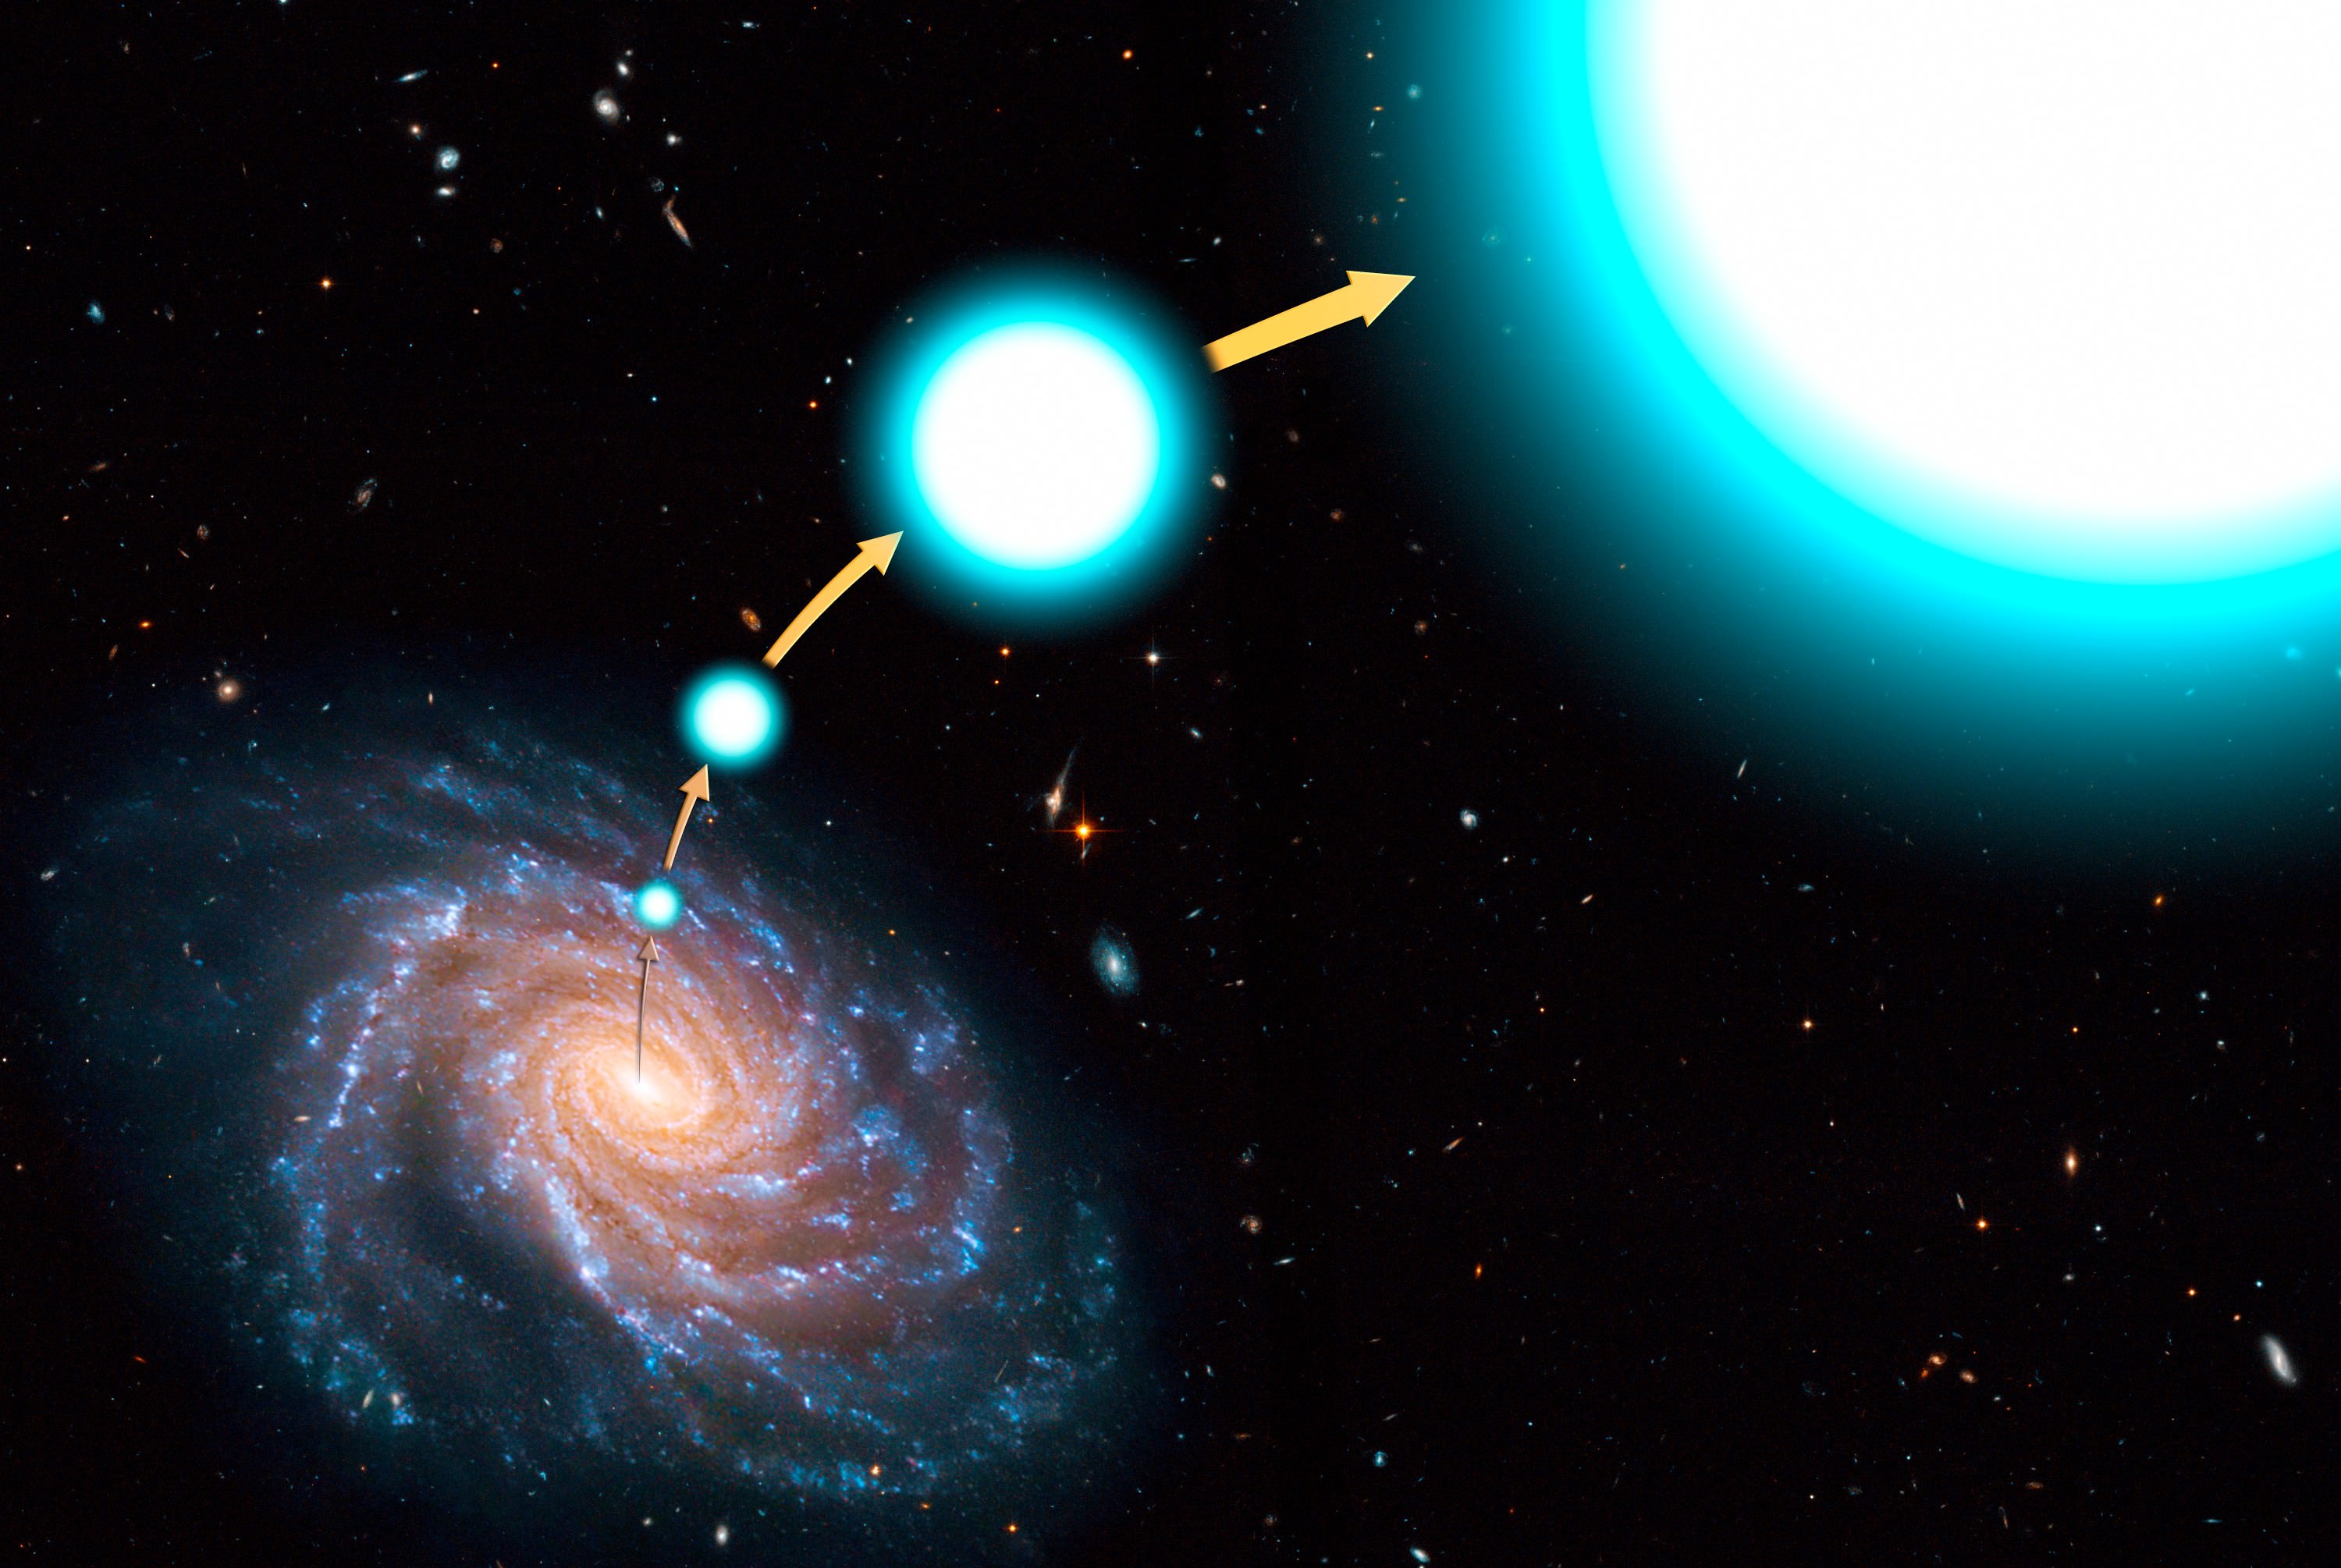
An artist's conception of a hypervelocity star that has escaped the Milky Way. Credit: NASA

Back in 1988, astronomer Jack Hills predicted a type of “rogue”star might exist that is not bound to any particular galaxy. These stars, he reasoned, were periodically ejected from their host galaxy by some sort of mechanism to begin traveling through interstellar space.

Since that time, astronomers have made numerous discoveries that indicate these rogue, traveling stars indeed do exist, and far from being an occasional phenomenon, they are actually quite common. What’s more, some of these stars were found to be traveling at extremely high speeds, leading to the designation of hypervelocity stars (HVS).

And now, in a series of papers that published in arXiv Astrophysics, two Harvard researchers have argued that some of these stars may be traveling close to the speed of light. Known as semi-relativistic hypervelocity stars (SHS), these fast-movers are apparently caused by galactic mergers, where the gravitational effect is so strong that it fling stars out of a galaxy entirely. These stars, the researchers say, may have the potential to spread life throughout the Universe.

This finding comes on the heels of two other major announcements. The first occurred in early November when a paper published in the Astrophysical Journal reported that as many as 200 billion rogue stars have been detected in a cluster of galaxies some 4 billion light years away. These observations were made by the Hubble Space Telescope’s Frontier Fields program, which made ultra-deep multiwavelength observations of the Abell 2744 galaxy cluster.

This was followed by a study published in Science, where an international team of astronomers claimed that as many as half the stars in the entire universe live outside of galaxies.

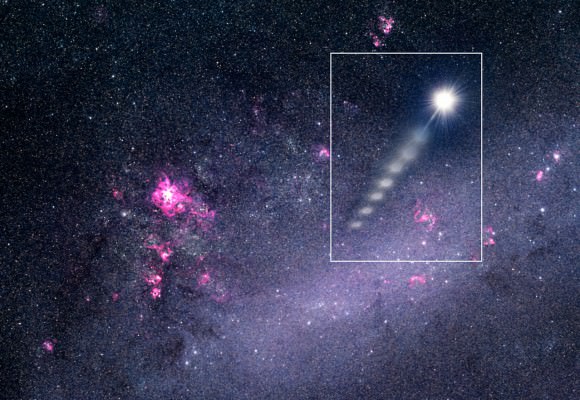
Using ESO's Very Large Telescope, astronomers have recorded a massive star moving at more than 2.6 million kilometres per hour. Stars are not born with such large velocities. Its position in the sky leads to the suggestion that the star was kicked out from the Large Magellanic Cloud, providing indirect evidence for a massive black hole in the Milky Way's closest neighbour. Credit: ESO
Image of a moving star captured by the ESO Very Large Telescope, believed to have been ejected from the Large Magellanic Cloud. Credit: ESO

However, the recent observations made by Abraham Loeb and James Guillochon of Harvard University are arguably the most significant yet concerning these rogue celestial bodies. According to their research papers, these stars may also play a role in spreading life beyond the boundaries of their host galaxies.

In their first paper, the researchers trace these stars to galaxy mergers, which presumably lead to the formation of massive black hole binaries in their centers. According to their calculations, these supermassive black holes (SMBH) will occasionally slingshot stars to semi-relativistic speeds.

“We predict the existence of a new population of stars coasting through the Universe at nearly the speed of light,” Loeb told Universe Today via email. “The stars are ejected by slingshots made of pairs of massive black holes which form during mergers of galaxies.”

These findings have further reinforced that massive compact bodies, widely known as a supermassive black holes (SMBH), exist at the center of galaxies. Here, the fastest known stars exist, orbiting the SMBH and accelerating up to speeds of 10,000 km per second (3 percent the speed of light).

According to Leob and Guillochon, however, those that are ejected as a result of galactic mergers are accelerated to anywhere from one-tenth to one-third the speed of light (roughly 30,000 – 100,000 km per second).

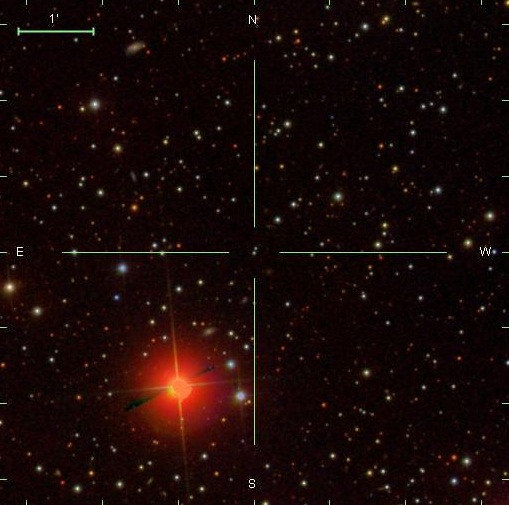
Image of a hypervelocity star found in data from the Sloan Digital Sky Survey. Credit: Vanderbilt University

Observing these semi-relativistic stars could tell us much about the distant cosmos, according to the Harvard researchers. Compared to conventional research, which relied on subatomic particles like photons, neutrinos, and cosmic rays from distant galaxies, studying ejected stars offers numerous advantages.

“Traditionally, cosmologists used light to study the Universe but objects moving less than the speed of light offer new possibilities,” said Loeb. “For example, stars moving at different speeds allow us to probe a distant source galaxy at different look-back times (since they must have been ejected at different times in order to reach us today), in difference from photons that give us just one snapshot of the galaxy.”

In their second paper, the researchers calculate that there are roughly a trillion of these stars out there to be studied. And given that these stars were detected thanks to the Spitzer Space Telescope, it is likely that future generations will be able to study them using more advanced equipment.

All-sky infrared surveys could locate thousands of these stars speeding through the cosmos. And spectrographic analysis could tell us much about the galaxies they came from.

But how could these fast moving stars be capable of spreading life throughout the cosmos?

Could an alien spore really travel light years between different star systems? Well, as long as your theory doesn't require it to still be alive when it arrives - sure it can.
The Theory of Panspermia argues that life is distributed throughout the universe by celestial objects. Credit: NASA/Jenny Mottar

“Tightly bound planets can join the stars for the ride,” said Loeb. “The fastest stars traverse billions of light years through the universe, offering a thrilling cosmic journey for extra-terrestrial civilizations. In the past, astronomers considered the possibility of transferring life between planets within the solar system and maybe through our Milky Way galaxy. But this newly predicted population of stars can transport life between galaxies across the entire universe.”

The possibility that traveling stars and planets could have been responsible for the spread of life throughout the universe is likely to have implications as a potential addition to the Theory of Panspermia, which states that life exists throughout the universe and is spread by meteorites, comets, asteroids.

But Loeb told Universe Today that a traveling planetary system could have potential uses for our species someday.

“Our descendants might contemplate boarding a related planetary system once the Milky Way will merge with its sister galaxy, Andromeda, in a few billion years,” he said.

Further Reading: arxiv.org/1411.5022, arxiv.org/1411.5030

What Is John Dalton’s Atomic Model?

John Dalton, the father of atomic theory, by Charles Turner. Credit: Wikipedia

Atomic theory – that is, the belief that all matter is composed of tiny, indivisible elements – has very deep roots. Initially, the theory appeared in thousands of years ago in Greek and Indian texts as a philosophical idea. However, it was not embraced scientifically until the 19th century, when an evidence-based approach began to reveal what the atomic model looked like.

It was at this time that John Dalton, an English chemist, meteorologist and physicist, began a series of experiments which would culminate in him proposing the theory of atomic compositions – which thereafter would be known as Dalton’s Atomic Theory – that would become one of the cornerstones of modern physics and chemistry.

Continue reading “What Is John Dalton’s Atomic Model?”

What Percent of Earth is Water?

Earth - Western Hemisphere

The Earth is often compared to a majestic blue marble, especially by those privileged few who have gazed upon it from orbit. This is due to the prevalence of water on the planet’s surface. While water itself is not blue, water gives off blue light upon reflection.

For those of us confined to living on the surface, the fact that our world is mostly covered in water is a well known fact. But how much of our planet is made up of water, exactly? Like most facts pertaining to our world, the answer is a little more complicated than you might think, and takes into account a number of different qualifications.

Sources of Water:

In simplest terms, water makes up about 71% of the Earth’s surface, while the other 29% consists of continents and islands. To break the numbers down, 96.5% of all the Earth’s water is contained within the oceans as salt water, while the remaining 3.5% is freshwater lakes and frozen water locked up in glaciers and the polar ice caps.

Of that fresh water, almost all of it takes the form of ice: 69% of it, to be exact. If you could melt all that ice, and the Earth’s surface was perfectly smooth, the sea levels would rise to an altitude of 2.7 km.

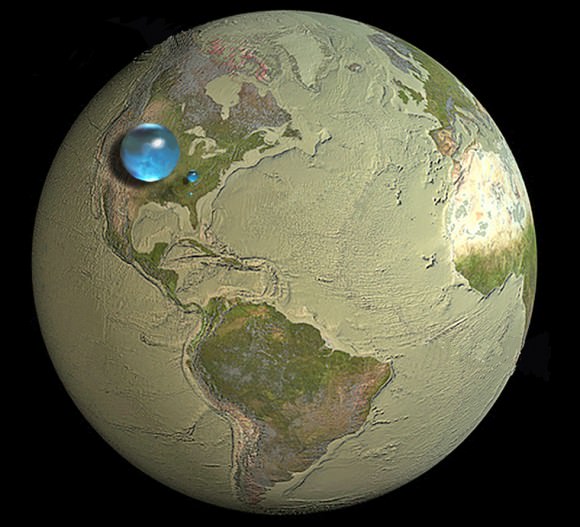
Illustration showing all of Earth's water, liquid fresh water, and water in lakes and rivers. Credit: Howard Perlman/USGS/Jack Cook/WHOI
Illustration showing all of Earth’s water, liquid fresh water, and water in lakes and rivers. Credit: Howard Perlman, USGS/illustraion by Jack Cook, WHOI

Aside from the water that exists in ice form, there is also the staggering amount of water that exists beneath the Earth’s surface. If you were to gather all the Earth’s fresh water together as a single mass (as shown in the image above) it is estimated that it would measure some 1,386 million cubic kilometers (km3) in volume.

Meanwhile, the amount of water that exists as groundwater, rivers, lakes, and streams would constitute just over 10.6 million km3, which works out to a little over 0.7%. Seen in this context, the limited and precious nature of freshwater becomes truly clear.

Volume vs. Mass:

But how much of Earth is water – i.e. how much water contributes to the actual mass of the planet? This includes not just the surface of the Earth, but inside as well. In terms of volume, all of the water on Earth works out to about 1.386 billion cubic kilometers (km³) or 332.5 million cubic miles (mi³) of space.

But in terms of mas, scientists calculate that the oceans on Earth weight about 1.35 x 10¹⁸ metric tonnes (1.488 x 1018 US tons), which is the equivalent of 1.35 billion trillion kg, or 2976 trillion trillion pounds. This is just 1/4400 the total mass of the Earth, which means that while the oceans cover 71% of the Earth’s surface, they only account for 0.02% of our planet’s total mass.

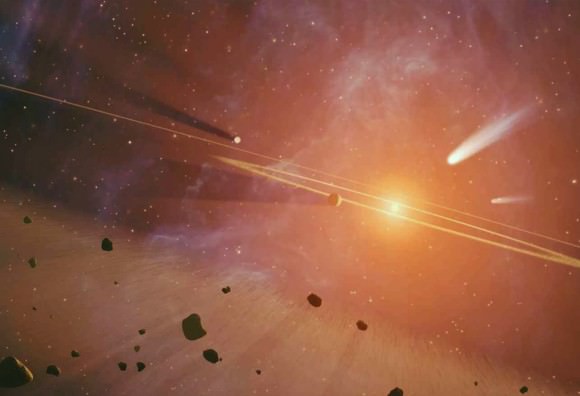
Many theories about the origins of water on Earth attribute it to collisions with comets and asteroids. Credit: NASA/JPL/Caltech

Source of Earth’s Water:

The origin of water on the Earth’s surface, as well as the fact that it has more water than any other rocky planet in the Solar System, are two of long-standing mysteries concerning our planet. Not that long ago, it was believed that our planet formed dry some 4.6 billion years ago, with high-energy impacts creating a molten surface on the infant Earth.

According to this theory, water was brought to the world’s oceans thanks to icy comets, trans-Neptunian objects or water-rich meteoroids (protoplanets) from the outer reaches of the main asteroid belt colliding with the Earth.

However, more recent research conducted by the Woods Hole Oceanographic Institution (WHOI) in Woods Hole, Massachusetts, has pushed the date of these origins back further. According to this new study, the world’s oceans also date back 4.6 billion years, when all the worlds of the inner Solar System were still forming.

This conclusion was reached by examining meteorites thought to have formed at different times in the history of the Solar System. Carbonaceous chondrite, the oldest meteorites that have been dated to the very earliest days of the Solar System, were found to have the same chemistry as those originating from protoplanets like Vesta. This includes a significance presence of water.

These meteorites are dated to the same epoch in which water was believed to have formed on Earth – some 11 million years after the formation of the Solar System. In short, it now appears that meteorites were depositing water on Earth in its earliest days.

While not ruling out the possibility that some of the water that covers 71 percent of Earth today may have arrived later, these findings suggest that there was enough already here for life to have begun earlier than thought.

We’ve written many articles about the oceans for Universe Today. Here’s How Many Oceans are there in the World?, Earth Has Less Water Than You Think, Where Did Earth’s Water Come From?, Why Doesn’t Earth Have More Water?, Rethinking the Source of Earth’s Water.

If you’d like more info on Earth, check out NASA’s Solar System Exploration Guide on Earth. And here’s a link to NASA’s Earth Observatory.

We’ve also recorded an episode of Astronomy Cast all about planet Earth. Listen here, Episode 51: Earth and Episode 363: Where Did Earth’s Water Come From?

Sources:

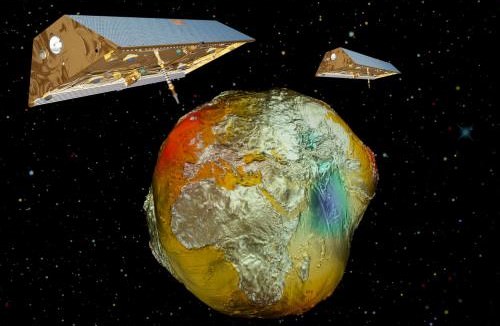
The “Potsdam Gravity Potato” Shows Variations in Earth’s Gravity

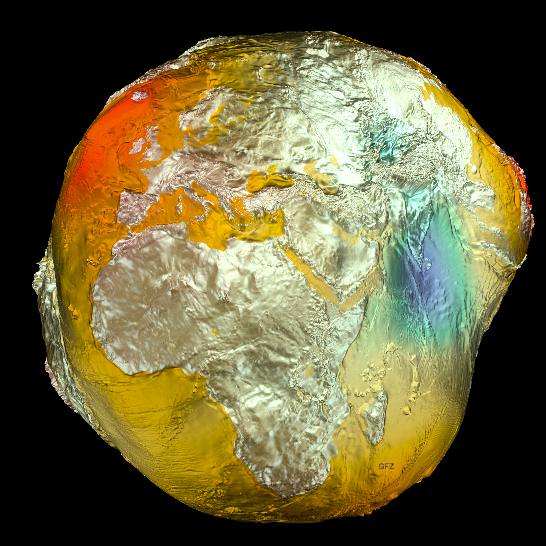
The Geoid 2011 model, based on data from LAGEOS, GRACE, GOCE and surface data. Credit: GFZ

People tend to think of gravity here on Earth as a uniform and consistent thing. Stand anywhere on the globe, at any time of year, and you’ll feel the same downward pull of a single G. But in fact, Earth’s gravitational field is subject to variations that occur over time. This is due to a combination of factors, such as the uneven distributions of mass in the oceans, continents, and deep interior, as well as climate-related variables like the water balance of continents, and the melting or growing of glaciers.

And now, for the first time ever, these variations have been captured in the image known as the “Potsdam Gravity Potato” –  a visualization of the Earth’s gravity field model produced by the German Research Center for Geophysics’ (GFZ) Helmholtz’s Center in Potsdam, Germany.

And as you can see from the image above, it bears a striking resemblance to a potato. But what is more striking is the fact that through these models, the Earth’s gravitational field is depicted not as a solid body, but as a dynamic surface that varies over time.This new gravity field model (which is designated EIGEN-6C) was made using measurements obtained from the LAGEOS, GRACE, and GOCE satellites, as well as ground-based gravity measurements and data from the satellite altimetry.

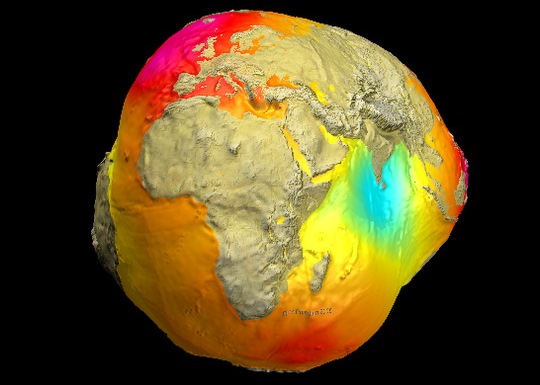
The Geoid 2005 model, which was based on data of two satellites (CHAMP and GRACE) plus surface data. Credit: GFZ
The 2005 model, which was based on data from the CHAMP and GRACE satellites and surface data, was less refined than the latest one. Credit: GFZ

Compared to the previous model obtained in 2005 (shown above), EIGEN-6C has a fourfold increase in spatial resolution.

“Of particular importance is the inclusion of measurements from the satellite GOCE, from which the GFZ did its own calculation of the gravitational field,” says Dr. Christoph Foerste who directs the gravity field work group at GFZ along with Dr. Frank Flechtner.

The ESA mission GOCE (Gravity Field and Steady-State Ocean Circulation Explorer) was launched in mid-March 2009 and has since been measuring the Earth’s gravitational field using satellite gradiometry – the study and measurement of variations in the acceleration due to gravity.

“This allows the measurement of gravity in inaccessible regions with unprecedented accuracy, for example in Central Africa and the Himalayas,” said Dr. Flechtner. In addition, the GOCE satellites offers advantages when it comes to measuring the oceans.

Within the many open spaces that lie under the sea, the Earth’s gravity field shows variations. GOCE is able to better map these, as well as deviations in the ocean’s surface – a factor known as “dynamic ocean topography” – which is a result of Earth’s gravity affecting the ocean’s surface equilibrium.

Twin-satellites GRACE with the earth's gravity field (vertically enhanceded) calculated from CHAMP data. Credit: GFZ
Twin-satellites GRACE with the earth’s gravity field (vertically enhanced) calculated from CHAMP data. Credit: GFZ

Long-term measurement data from the GFZ’s twin-satellite mission GRACE (Gravity Recovery And Climate Experiment) were also included in the model. By monitoring climate-based variables like the melting of large glaciers in the polar regions and the amount of seasonal water stored in large river systems, GRACE was able to determine the influence of large-scale temporal changes on the gravitational field.

Given the temporal nature of climate-related processes – not to mention the role played by Climate Change – ongoing missions are needed to see how they effect our planet long-term. Especially since the GRACE mission is scheduled to end in 2015.

In total, some 800 million observations went into the computation of the final model which is composed of more than 75,000 parameters representing the global gravitational field. The GOCE satellite alone made 27,000 orbits during its period of service (between March 2009 and November 2013) in order to collect data on the variations in the Earth’s gravitational field.

The final result achieved centimeter accuracy, and can serve as a global reference for sea levels and heights. Beyond the “gravity community,” the research has also piqued the interest of researchers in aerospace engineering, atmospheric sciences, and space debris.

But above all else, it offers scientists a way of imaging the world that is different from, but still complimentary to, approaches based on light, magnetism, and seismic waves. And it could be used for everything from determining the speed of ocean currents from space, monitoring rising sea levels and melting ice sheets, to uncovering hidden features of continental geology and even peeking at the convection force driving plate tectonics.

Further Reading: GFZ

Astronomers Poised to Capture Image of Supermassive Milky Way Black Hole

This artist's conception illustrates a supermassive black hole (central black dot) at the core of a young, star-rich galaxy. Now astronomers have found a rogue SMBH travelling through space. Image credit: NASA/JPL-Caltech

Scientists have long suspected that supermassive black holes (SMBH) reside at the center of every large galaxy in our universe. These can be billions of times more massive than our sun, and are so powerful that activity at their boundaries can ripple throughout their host galaxies.

In the case of the Milky Way galaxy, this SMBH is believed to correspond with the location of a complex radio source known as Sagittarius A*.  Like all black holes, no one has even been able to confirm that they exist, simply because no one has ever been able to observe one.

But thanks to researchers working out of MIT’s Haystack Observatory, that may be about to change. Using a new telescope array known as the “Event Horizon Telescope” (EHT), the MIT team hopes to produce this “image of the century” very soon.Initially predicted by Einstein, scientists have been forced to study black holes by observing their apparent effect on space and matter in their vicinity. These include stellar bodies that have periodically disappeared into dark regions, never to be heard from again.

As Sheperd Doeleman, assistant director of the Haystack Observatory at Massachusetts Institute of Technology (MIT), said of black holes: “It’s an exit door from our universe. You walk through that door, you’re not coming back.”

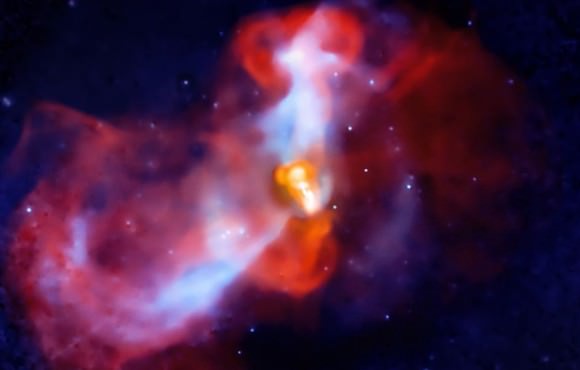
Image of the M87 Galaxy, 50 million ly from the Milky Way, which is believed to have a SMBH at its center. Credit: NASA/CXC/KIPAC/NSF/NRAO/AUI
Image of the M87, a giant elliptical galaxy that is believed to have a SMBH at its center. Credit: NASA/CXC/KIPAC/NSF/NRAO/AUI

As the most extreme object predict by Einstein’s theory of gravity, supermassive black holes are the places in space where, according to Doeleman, “gravity completely goes haywire and crushes an enormous mass into an incredibly close space.”

To create the EHT array, the scientists linked together radio dishes in Hawaii, Arizona, and California. The combined power of the EHT means that it can see details 2,000 times finer than what’s visible to the Hubble Space Telescope.

These radio dishes were then trained on M87, a galaxy some 50 million light years from the Milky Way in the Virgo Cluster, and Sagittarius A* to study the event horizons at their cores.

Other instruments have been able to observe and measure the effects of a black hole on stars, planets, and light. But so far, no one has ever actually seen the Milky Way’s Supermassive black hole.

According to David Rabanus, instruments manager for ALMA: “There is no telescope available which can resolve such a small radius,” he said. “It’s a very high-mass black hole, but that mass is concentrated in a very, very small region.”

Doeleman’s research focuses on studying super massive black holes with sufficient resolution to directly observe the event horizon. To do this his group assembles global networks of telescopes that observe at mm wavelengths to create an Earth-size virtual telescope using the technique of Very Long Baseline Interferometry (VLBI).

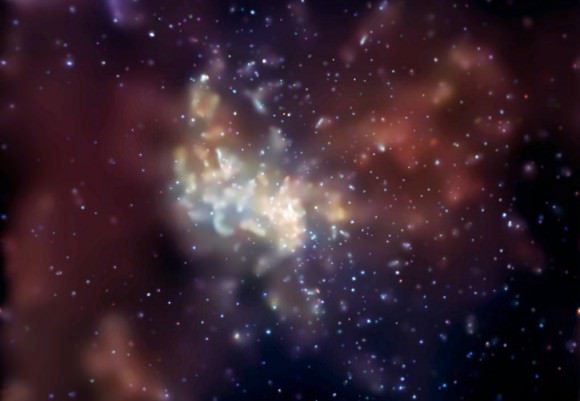
Sagittarius A
Image of Sagittarius A*, the complex radio source at the center of the Milky Way, and believed to be a SMBH. Credit: NASA/Chandra

“We target SgrA*, the 4 million solar mass black hole at the center of the Milky Way, and M87, a giant elliptical galaxy,” says Doeleman. “Both of these objects present to us the largest apparent event horizons in the Universe, and both can be resolved by (sub)mm VLBI arrays.” he added. “We call this project The Event Horizon Telescope (EHT).”

Ultimately, the EHT project is a world-wide collaboration that combines the resolving power of numerous antennas from a global network of radio telescopes to capture the first image ever of the most exotic object in our Universe – the event horizon of a black hole.

“In essence, we are making a virtual telescope with a mirror that is as big as the Earth,” said Doeleman who is the principal investigator of the Event Horizon Telescope. “Each radio telescope we use can be thought of as a small silvered portion of a large mirror. With enough such silvered spots, one can start to make an image.”

“The Event Horizon Telescope is the first to resolve spatial scales comparable to the size of the event horizon of a black hole,” said University of California, Berkeley astronomer Jason Dexter. “I don’t think it’s crazy to think we might get an image in the next five years.”

First postulated by Albert Einstein’s Theory of General Relativity, the existence of black holes has since been supported by decades’ worth of observations, measurements, and experiments. But never has it been possible to directly observe and image one of these maelstroms, whose sheer gravitational power twists and mangle the very fabric of space and time.

Finally being able to observe one will not only be a major scientific breakthrough, but could very well provide the most impressive imagery ever captured.

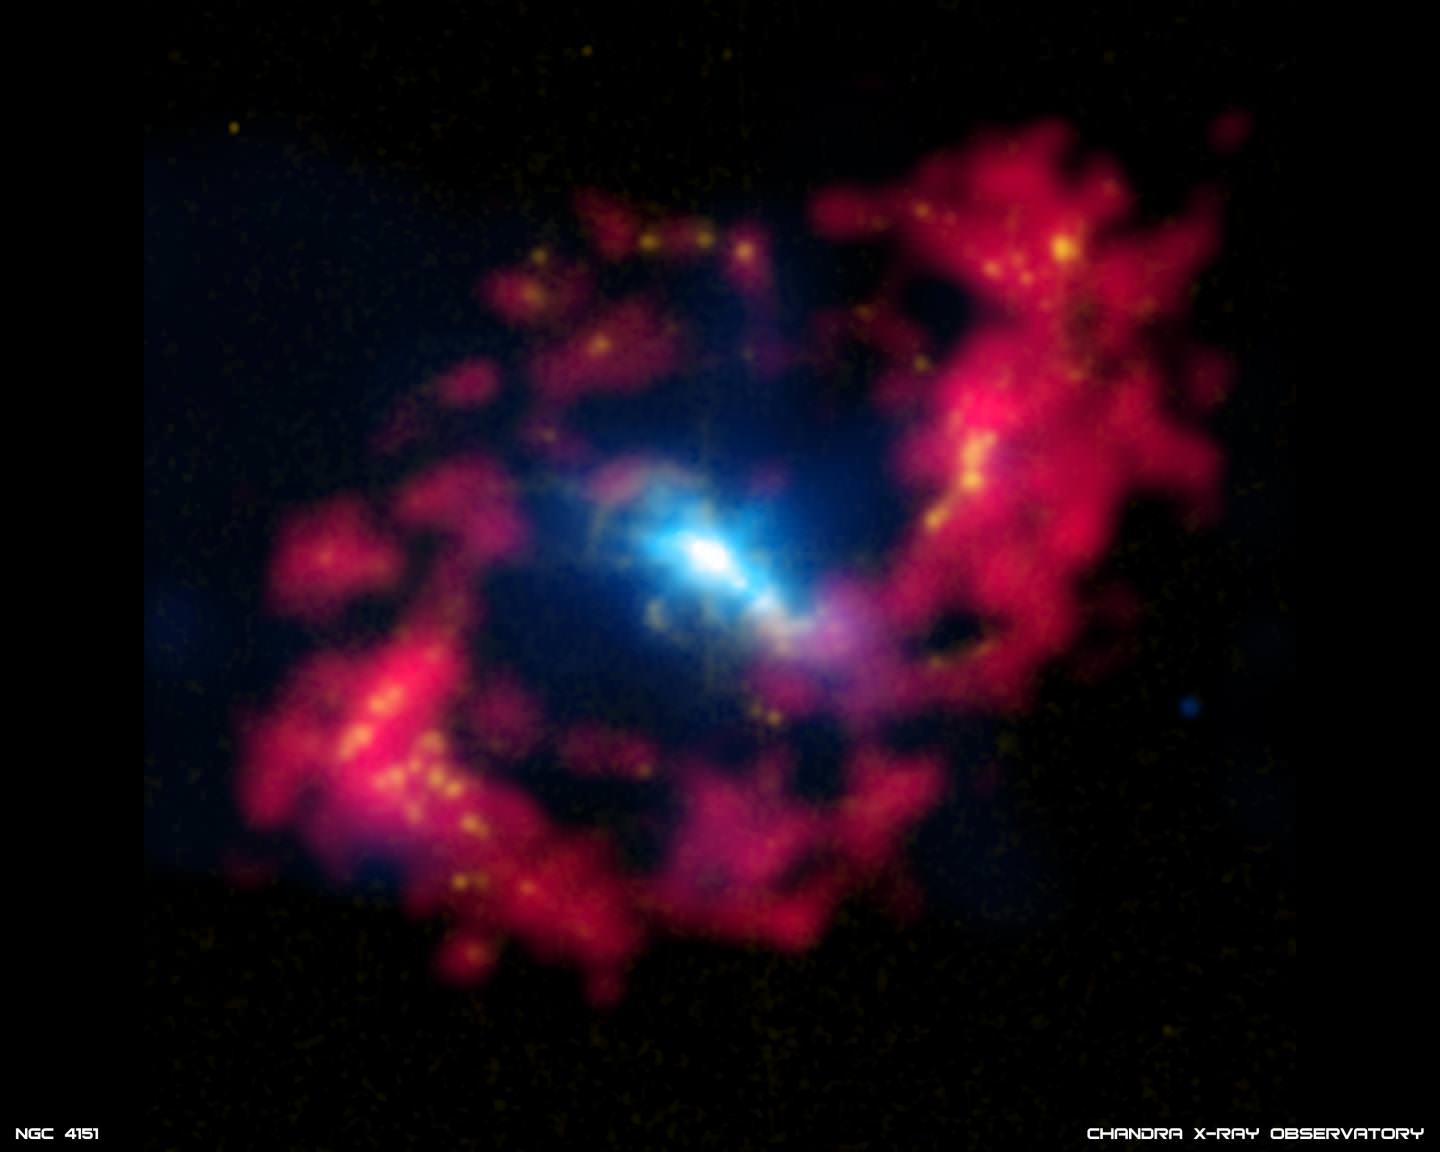
“Eye of Sauron” Galaxy Used For New Method of Galactic Surveying

Image of the spiral galaxy NGC 4151, aka. "Sauron's Eye". Credit: X-ray: NASA/CXC/CfA/J.Wang et al.; Optical: Isaac Newton Group of Telescopes, La Palma/Jacobus Kapteyn Telescope; Radio: NSF/NRAO/VLA.

Determining the distance of galaxies from our Solar System is a tricky business. Knowing just how far other galaxies are in relation to our own is not only key to understanding the size of the universe, but its age as well. In the past, this process relied on finding stars in other galaxies whose absolute light output was measurable. By gauging the brightness of these stars, scientists have been able to survey certain galaxies that lie 300 million light years from us.

However, a new and more accurate method has been developed, thanks to a team of scientists led by Dr. Sebastian Hoenig from the University of Southampton. Similar to what land surveyors use here on Earth, they measured the physical and angular (or apparent) size of a standard ruler in the galaxy to calibrate distance measurements.

Hoenig and his team used this method at the W. M. Keck Observatory, near the summit of Mauna Kea in Hawaii, to accurately determine for the first time the distance to the NGC 4151 galaxy – otherwise known to astronomers as the “Eye of Sauron”. Continue reading ““Eye of Sauron” Galaxy Used For New Method of Galactic Surveying”

NASA’s Van Allen Probes Spot Impenetrable Radiation Barrier in Space

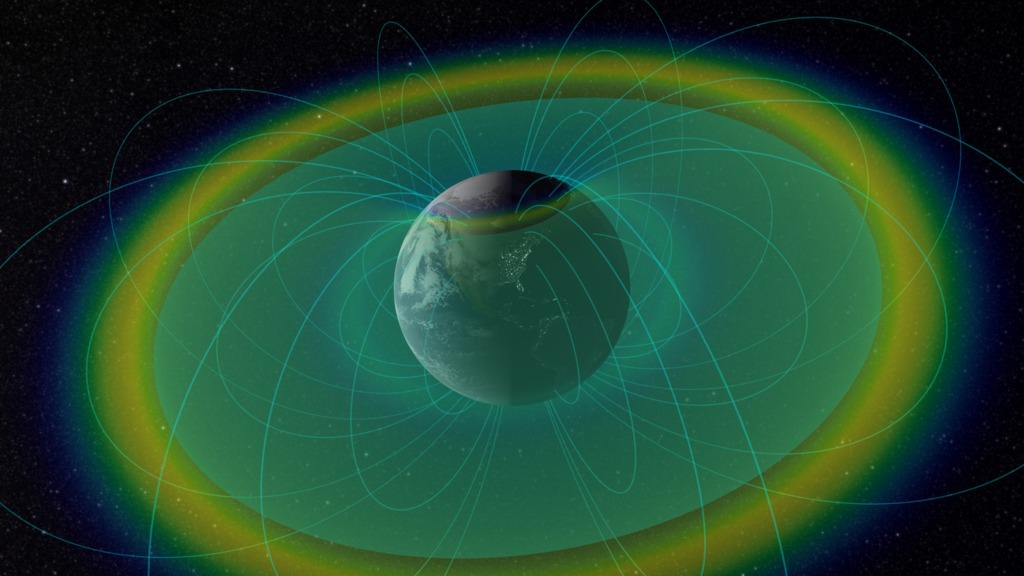
Visualization of the radiation belts with confined charged particles (blue & yellow) and plasmapause boundary (blue-green surface). Image Credit: NASA/Goddard

It’s a well-known fact that Earth’s ozone layer protects us from a great deal of the Sun’s ultra-violet radiation. Were it not for this protective barrier around our planet, chances are our surface would be similar to the rugged and lifeless landscape we observe on Mars.

Beyond this barrier lies another – a series of shields formed by a layer of energetic charged particles that are held in place by the Earth’s magnetic field. Known as the Van Allen radiation belts, this wall prevents the fastest, most energetic electrons from reaching Earth.

And according to new research from NASA’s Van Allen probes, it now appears that these belts may be nearly impenetrable, a finding which could have serious implications for future space exploration and research.

The existence of a belt of charged particles trapped by the Earth’s magnetosphere has been the subject of research since the early 20th century. However, it was not until 1958 that the Explorer 1 and Explorer 3 spacecrafts confirmed the existence of the belt, which would then be mapped out by the Explorer 4, Pioneer 3, and Luna 1 missions.

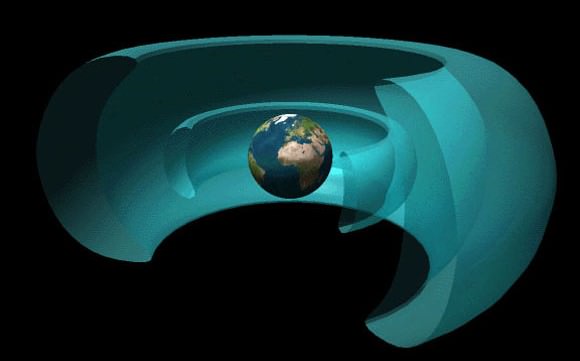
Two giant belts of radiation surround Earth. The inner belt is dominated by protons and the outer one by electrons. Credit: NASA

Since that time, scientists have discovered much about this belt, including how it interacts with other fields around our planet to form a nearly-impenetrable barrier to incoming electrons.

This discovery was made using NASA’s Van Allen Probes, launched in August 2012 to study the region. According to the observations made by the probes, this region can wax and wane in response to incoming energy from the sun, sometimes swelling up enough to expose satellites in low-Earth orbit to damaging radiation.

“This barrier for the ultra-fast electrons is a remarkable feature of the belts,” said Dan Baker, a space scientist at the University of Colorado in Boulder and first author of the paper. “We’re able to study it for the first time, because we never had such accurate measurements of these high-energy electrons before.”

Understanding what gives the radiation belts their shape and what can affect the way they swell or shrink helps scientists predict the onset of those changes. Such predictions can help scientists protect satellites in the area from the radiation.

In the decades since they were first discovered, scientists have learned that the size of the two belts can change – or merge, or even separate into three belts occasionally. But generally the inner belt stretches from 644 km to 10,000 km (400 – 6,000 mi) above the Earth’s surface while the outer belt stretches from 13,500 t0 58,000 km (8,400 – 36,000 mi).

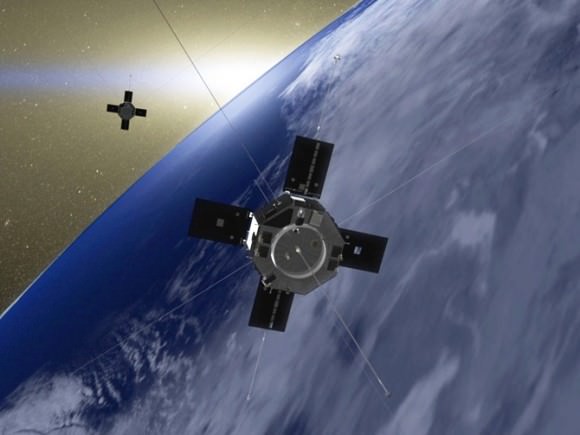
Artist's rendition of Van Allen Probes A and B in Earth orbit. Credit: NASA
Artist’s rendition of Van Allen Probes A and B in Earth orbit. Credit: NASA

Up until now, scientists have wondered why these two these belts have existed separately. Why, they have wondered, is there a fairly empty space between the two that appears to be free of electrons? That is where the newly discovered barrier comes in.

The Van Allen Probes data showed that the inner edge of the outer belt is, in fact, highly pronounced. For the fastest, highest-energy electrons, this edge is a sharp boundary that, under normal circumstances, cannot be penetrated.

“When you look at really energetic electrons, they can only come to within a certain distance from Earth,” said Shri Kanekal, the deputy mission scientist for the Van Allen Probes at NASA’s Goddard Space Flight Center in Greenbelt, Maryland, and a co-author on the Nature paper. “This is completely new. We certainly didn’t expect that.”

The team looked at possible causes. They determined that human-generated transmissions were not the cause of the barrier. They also looked at physical causes, asking if the shape of the Earth’s magnetic field could be the cause of the boundary. However, NASA scientists studied and eliminated that possibility and determined that the presence of other space particles appears to be the more likely cause.

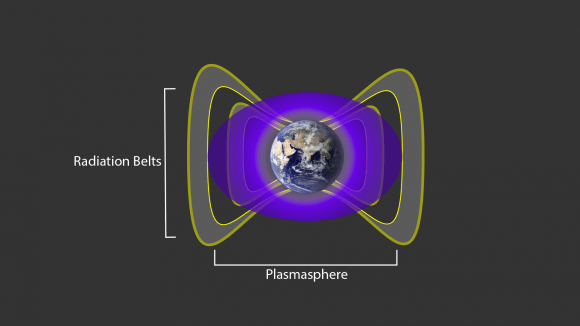
A cloud of cold, charged gas around Earth, called the plasmasphere and seen here in purple, interacts with the particles in Earth's radiation belts (shown in grey). Image Credit: NASA/Goddard
A cloud of cold, charged gas around Earth called the plasmasphere (seen here in purple), interacts with the particles in Earth’s radiation belts (shown in grey). Image Credit: NASA/Goddard

The radiation belts are not the only particle structures surrounding Earth. A giant cloud of relatively cool, charged particles called the plasmasphere fills the outermost region of Earth’s atmosphere, beginning at about 600 miles up and extending partially into the outer Van Allen belt. The particles at the outer boundary of the plasmasphere cause particles in the outer radiation belt to scatter, removing them from the belt.

This scattering effect is fairly weak and might not be enough to keep the electrons at the boundary in place, except for a quirk of geometry – the radiation belt electrons move incredibly quickly, but not toward Earth. Instead, they move in giant loops around Earth.

The Van Allen Probes’ data show that in the direction toward Earth, the most energetic electrons have very little motion at all – just a gentle, slow drift that occurs over the course of months. This movement is so slow and weak that it can be rebuffed by the scattering caused by the plasmasphere.

This also helps explain why – under extreme conditions, when an especially strong solar wind or a giant solar eruption such as a coronal mass ejection sends clouds of material into near-Earth space – the electrons from the outer belt can be pushed into the usually-empty slot region between the belts.

“The scattering due to the plasmapause is strong enough to create a wall at the inner edge of the outer Van Allen Belt,” said Baker. “But a strong solar wind event causes the plasmasphere boundary to move inward.”

A massive inflow of matter from the sun can erode the outer plasmasphere, moving its boundaries inward and allowing electrons from the radiation belts the room to move further inward too.

The Johns Hopkins Applied Physics Laboratory in Laurel, Maryland, built and operates the Van Allen Probes for NASA’s Science Mission Directorate. The mission is the second in NASA’s Living With a Star program, managed by Goddard.

A paper on these results appeared in the Nov. 26, 2014, issue of Nature magazine. And be sure to watch this animated video produced by the Goddard Space Center that explains the Van Allen belt in brief:

Further Reading: NASA

The Search for Dark Energy Just Got Easier

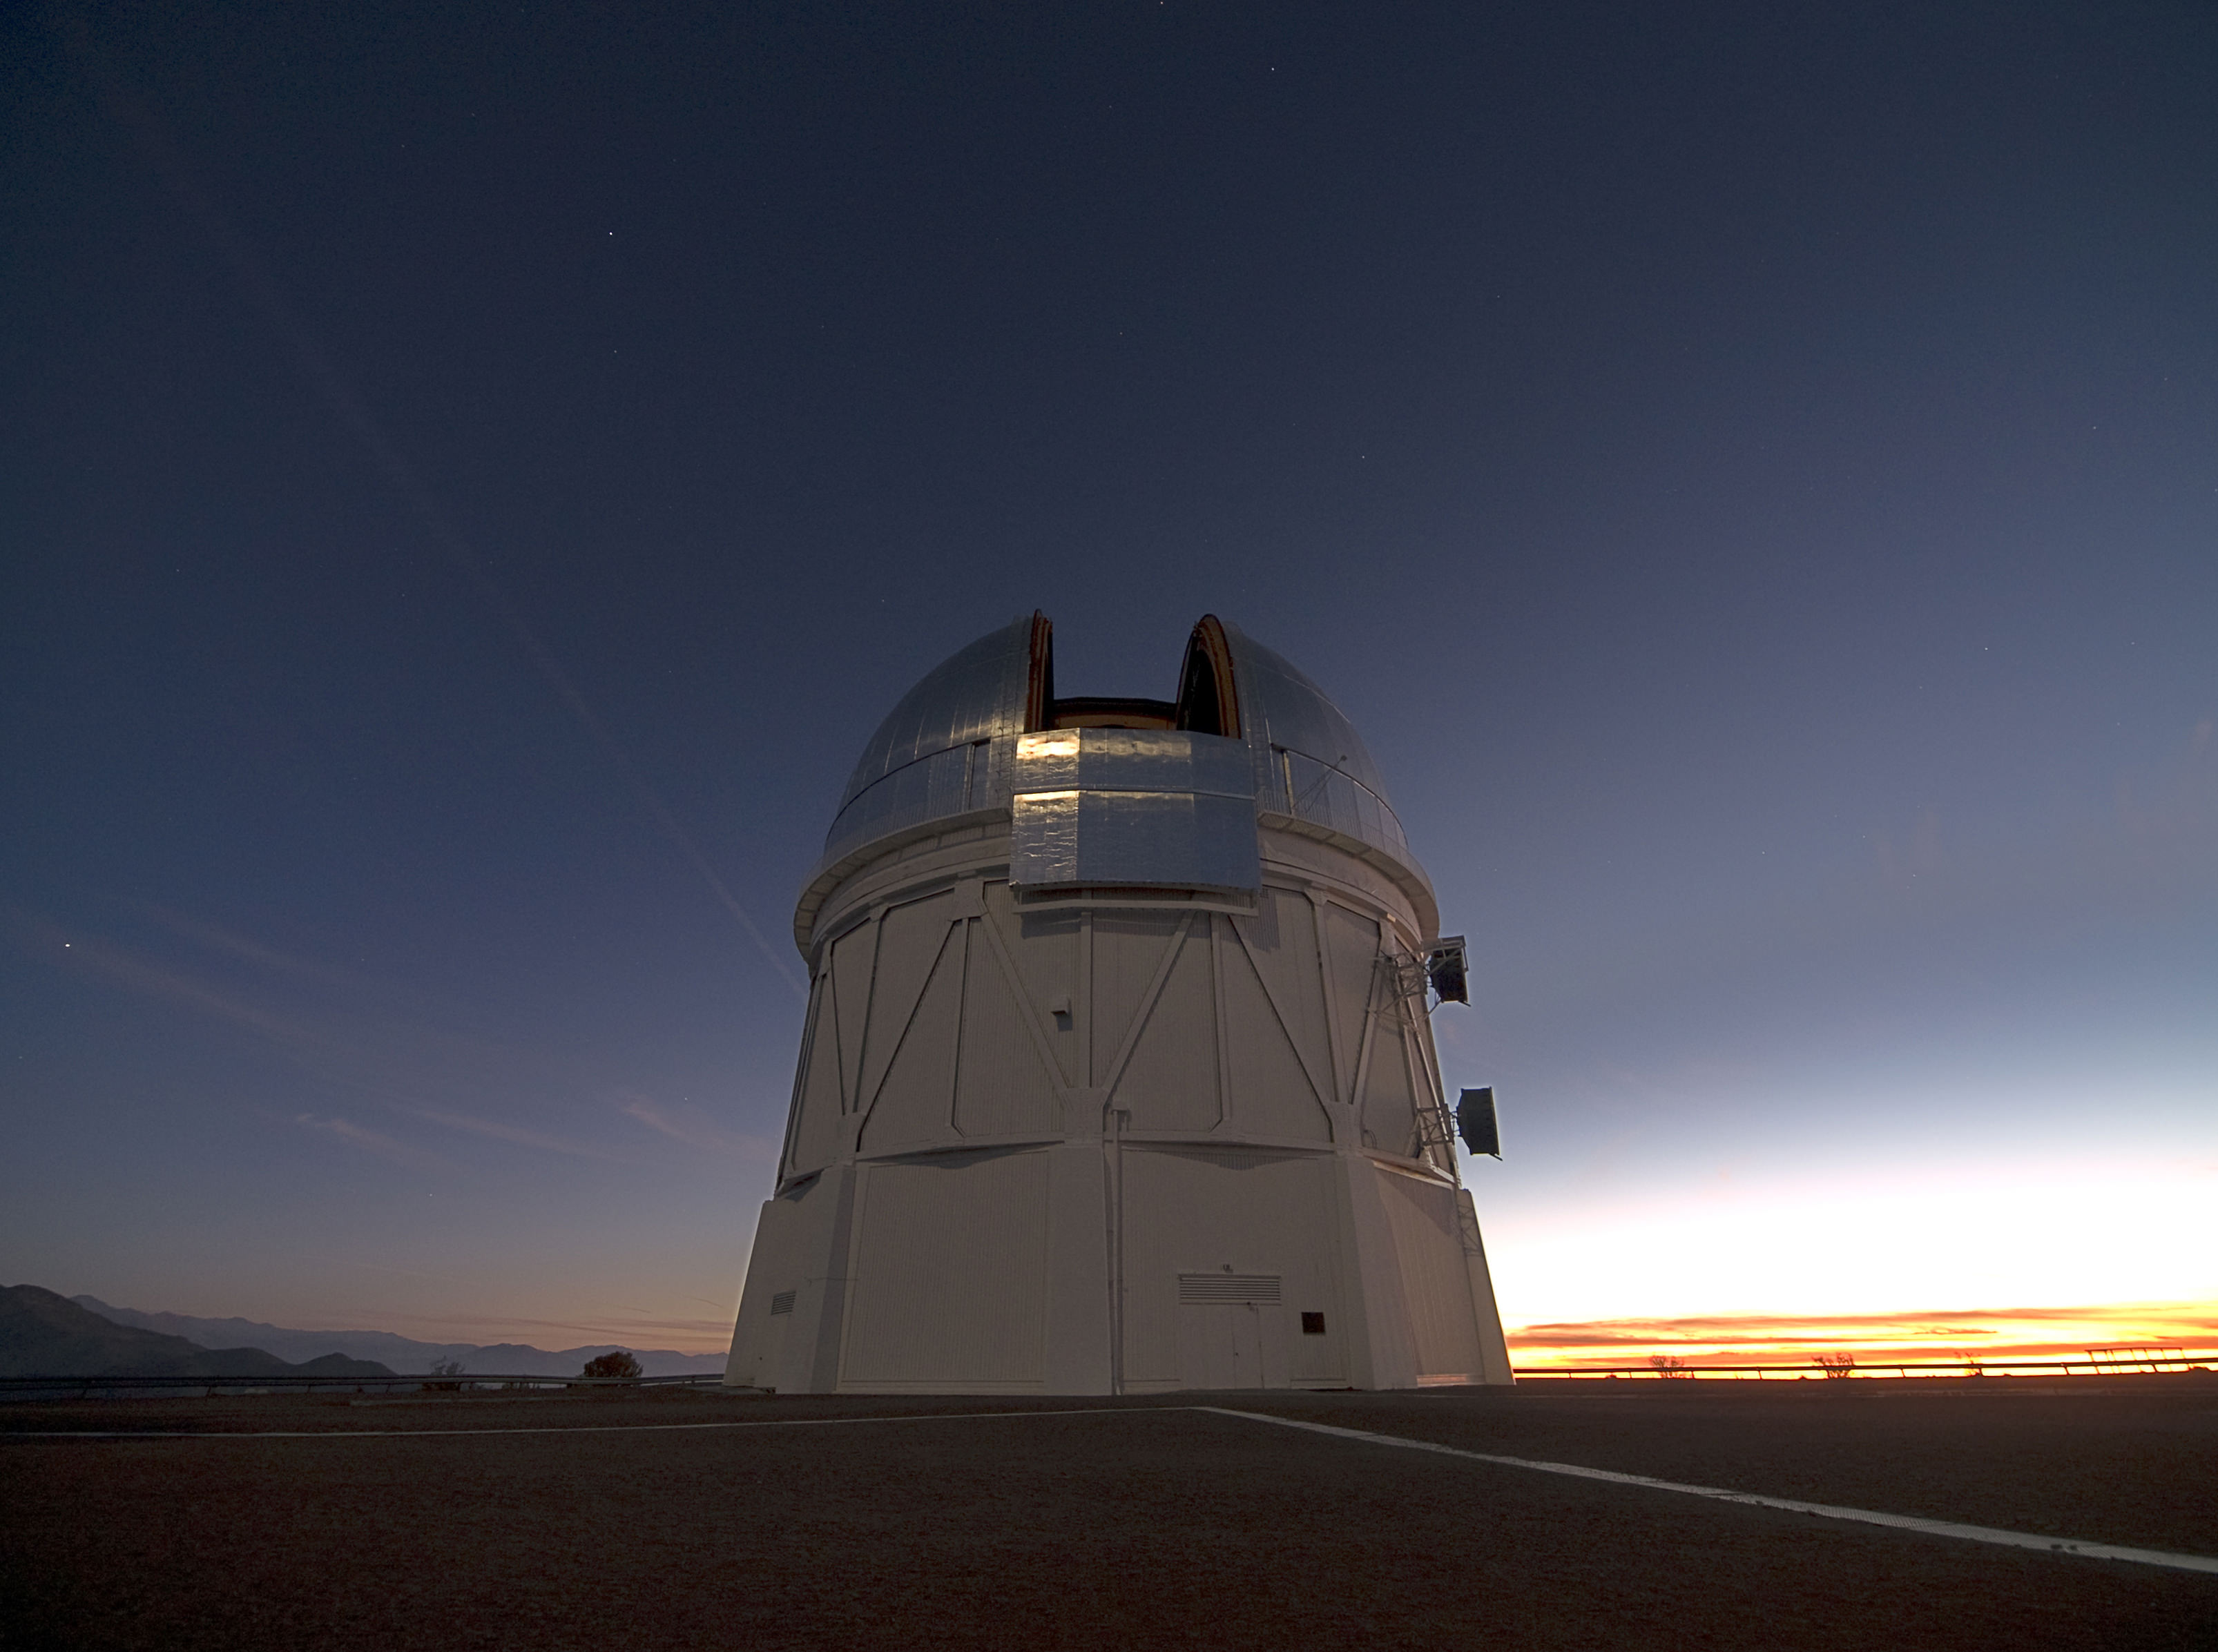
The Victor M. Blanco telescope at Cerro Tololo Interamerican Observatory (CTIO) in the Chilean Andes. Credit: Berkeley Lab

Since the early 20th century, scientists and physicists have been burdened with explaining how and why the Universe appears to be expanding at an accelerating rate. For decades, the most widely accepted explanation is that the cosmos is permeated by a mysterious force known as “dark energy”. In addition to being responsible for cosmic acceleration, this energy is also thought to comprise 68.3% of the universe’s non-visible mass.

Much like dark matter, the existence of this invisible force is based on observable phenomena and because it happens to fit with our current models of cosmology, and not direct evidence. Instead, scientists must rely on indirect observations, watching how fast cosmic objects (specifically Type Ia supernovae) recede from us as the universe expands.

This process would be extremely tedious for scientists – like those who work for the Dark Energy Survey (DES) – were it not for the new algorithms developed collaboratively by researchers at Lawrence Berkeley National Laboratory and UC Berkeley.

“Our algorithm can classify a detection of a supernova candidate in about 0.01 seconds, whereas an experienced human scanner can take several seconds,” said Danny Goldstein, a UC Berkeley graduate student who developed the code to automate the process of supernova discovery on DES images.

Currently in its second season, the DES takes nightly pictures of the Southern Sky with DECam – a 570-megapixel camera that is mounted on the Victor M. Blanco telescope at Cerro Tololo Interamerican Observatory (CTIO) in the Chilean Andes. Every night, the camera generates between 100 Gigabytes (GB) and 1 Terabyte (TB) of imaging data, which is sent to the National Center for Supercomputing Applications (NCSA) and DOE’s Fermilab in Illinois for initial processing and archiving.

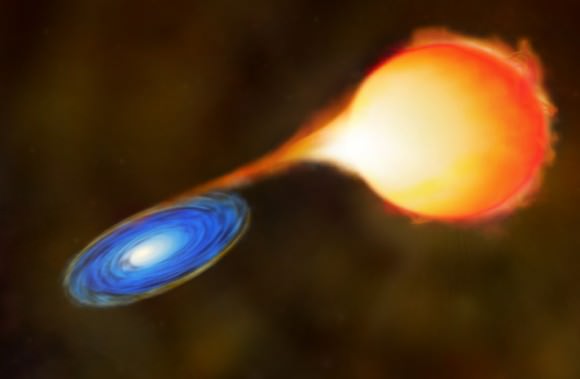
A Type Ia supernova occurs when a white dwarf accretes material from a companion star until it exceeds the Chandrasekhar limit and explodes. By studying these exploding stars, astronomers can measure dark energy and the expansion of the universe. CfA scientists have found a way to correct for small variations in the appearance of these supernovae, so that they become even better standard candles. The key is to sort the supernovae based on their color.  Credit: NASA/CXC/M. Weiss
By studying Type Ia supernova, astronomers can measure dark energy and the expansion of the universe. Credit: NASA/CXC/M. Weiss

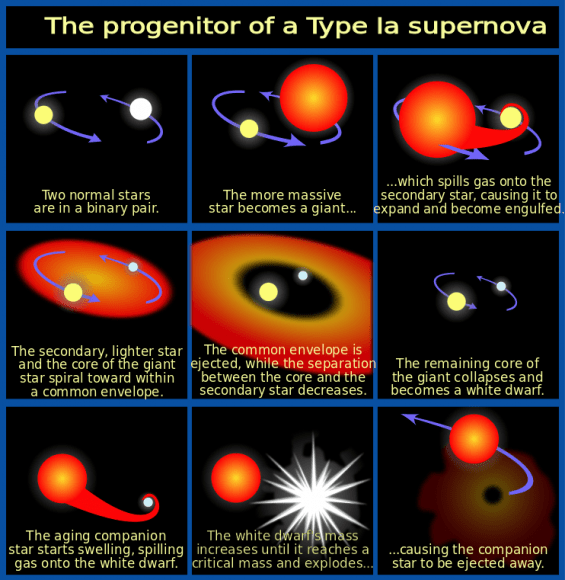
Object recognition programs developed at the National Energy Research Scientific Computing Center (NERSC) and implemented at NCSA then comb through the images in search of possible detections of Type Ia supernovae. These powerful explosions occur in binary star systems where one star is a white dwarf, which accretes material from a companion star until it reaches a critical mass and explodes in a Type Ia supernova.

“These explosions are remarkable because they can be used as cosmic distance indicators to within 3-10 percent accuracy,” says Goldstein.

Distance is important because the further away an object is located in space, the further back in time it is. By tracking Type Ia supernovae at different distances, researchers can measure cosmic expansion throughout the universe’s history. This allows them to put constraints on how fast the universe is expanding and maybe even provide other clues about the nature of dark energy.

“Scientifically, it’s a really exciting time because several groups around the world are trying to precisely measure Type Ia supernovae in order to constrain and understand the dark energy that is driving the accelerated expansion of the universe,” says Goldstein, who is also a student researcher in Berkeley Lab’s Computational Cosmology Center (C3).

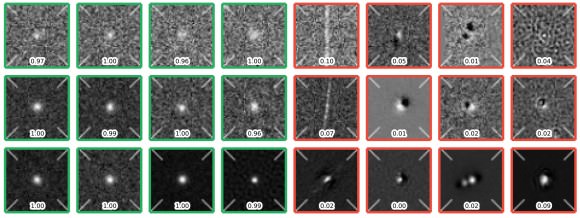
UC Berkeley / Berkeley Lab graduate student Danny Goldstein developed a new code using the machine learning technique Random Forest to vet detections of supernova candidates automatically, in real time, optimizing it for the Dark Energy Survey. Credit: Danny Goldstein, UC Berkeley / Berkeley Lab)
Goldstein’s new code uses machine learning techniques to vet detections of supernova candidates. Credit: Danny Goldstein, UC Berkeley/Berkeley Lab)

The DES begins its search for Type Ia explosions by uncovering changes in the night sky, which is where the image subtraction pipeline developed and implemented by researchers in the DES supernova working group comes in. The pipeline subtracts images that contain known cosmic objects from new images that are exposed nightly at CTIO.

Each night, the pipeline produces between 10,000 and a few hundred thousand detections of supernova candidates that need to be validated.

“Historically, trained astronomers would sit at the computer for hours, look at these dots, and offer opinions about whether they had the characteristics of a supernova, or whether they were caused by spurious effects that masquerade as supernovae in the data. This process seems straightforward until you realize that the number of candidates that need to be classified each night is prohibitively large and only one in a few hundred is a real supernova of any type,” says Goldstein. “This process is extremely tedious and time-intensive. It also puts a lot of pressure on the supernova working group to process and scan data fast, which is hard work.”

To simplify the task of vetting candidates, Goldstein developed a code that uses the machine learning technique “Random Forest” to vet detections of supernova candidates automatically and in real-time to optimize them for the DES. The technique employs an ensemble of decision trees to automatically ask the types of questions that astronomers would typically consider when classifying supernova candidates.

Evolution of a Type Ia supernova. Credit: NASA/ESA/A. Feild

At the end of the process, each detection of a candidate is given a score based on the fraction of decision trees that considered it to have the characteristics of a detection of a supernova. The closer the classification score is to one, the stronger the candidate. Goldstein notes that in preliminary tests, the classification pipeline achieved 96 percent overall accuracy.

“When you do subtraction alone you get far too many ‘false-positives’ — instrumental or software artifacts that show up as potential supernova candidates — for humans to sift through,” says Rollin Thomas, of Berkeley Lab’s C3, who was Goldstein’s collaborator.

He notes that with the classifier, researchers can quickly and accurately strain out the artifacts from supernova candidates. “This means that instead of having 20 scientists from the supernova working group continually sift through thousands of candidates every night, you can just appoint one person to look at maybe few hundred strong candidates,” says Thomas. “This significantly speeds up our workflow and allows us to identify supernovae in real-time, which is crucial for conducting follow up observations.”

“Using about 60 cores on a supercomputer we can classify 200,000 detections in about 20 minutes, including time for database interaction and feature extraction.” says Goldstein.

Goldstein and Thomas note that the next step in this work is to add a second-level of machine learning to the pipeline to improve the classification accuracy. This extra layer would take into account how the object was classified in previous observations as it determines the probability that the candidate is “real.” The researchers and their colleagues are currently working on different approaches to achieve this capability.

Further Reading: Berkley Lab