We know dark matter exists. We know this because without it and dark energy, our Universe would be missing 95.4% of its mass. What’s more, scientists would be hard pressed to explain what accounts for the gravitational effects they routinely see at work in the cosmos.
For decades, scientists have sought to prove its existence by smashing protons together in the Large Hadron Collider. Unfortunately, these efforts have not provided any concrete evidence.
Hence, it might be time to rethink dark matter. And physicists David M. Jacobs, Glenn D. Starkman, and Bryan Lynn of Case Western Reserve University have a theory that does just that, even if it does sound a bit strange.
In their new study, they argue that instead of dark matter consisting of elementary particles that are invisible and do not emit or absorb light and electromagnetic radiation, it takes the form of chunks of matter that vary widely in terms of mass and size.
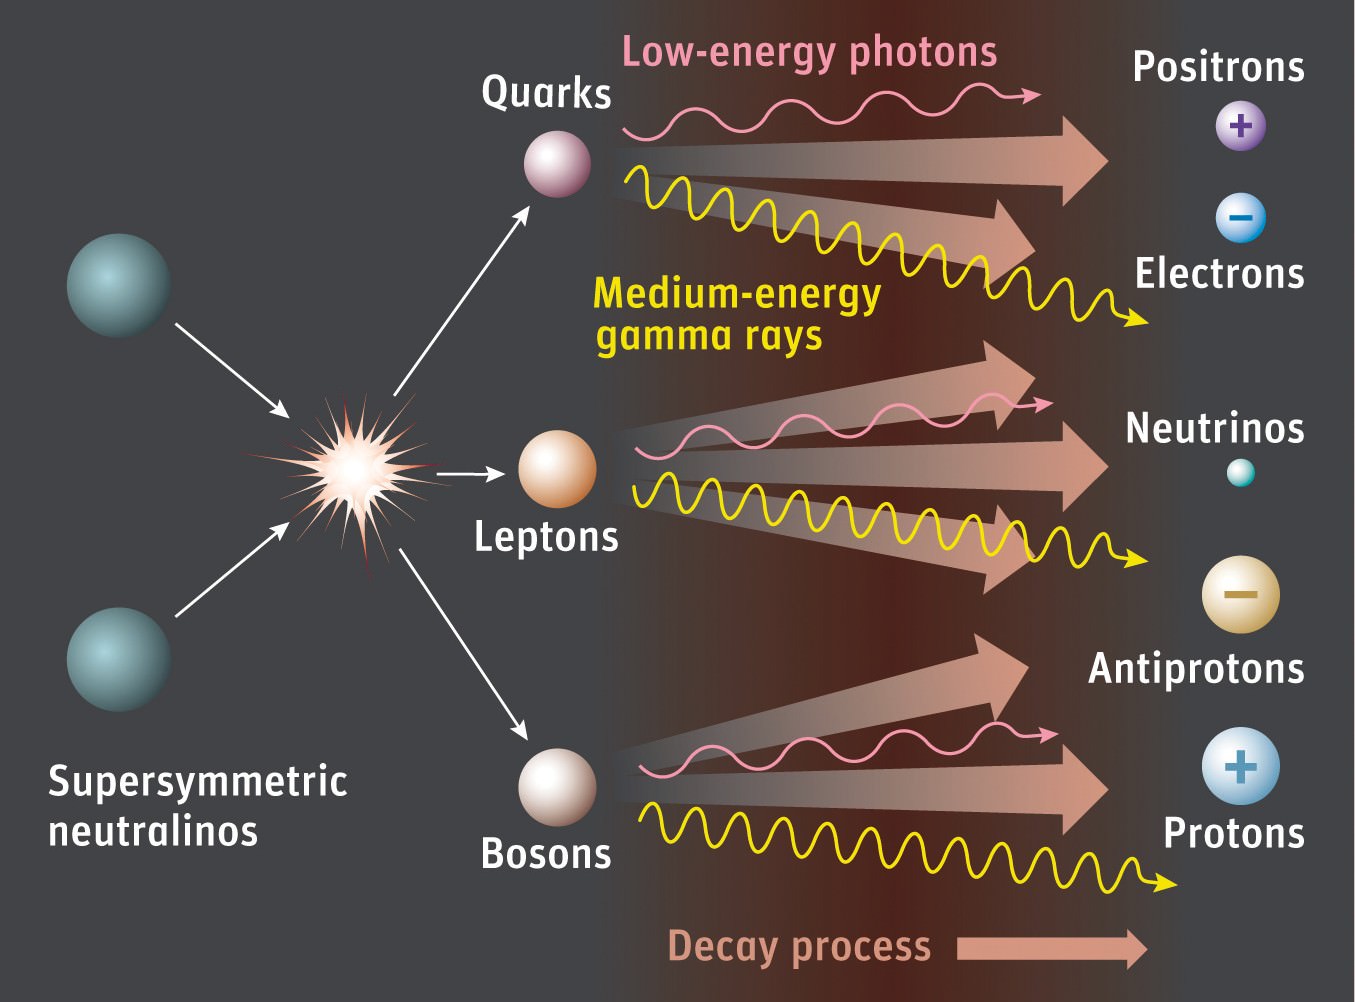
As it stands, there are many leading candidates for what dark matter could be, which range from Weakly-Interacting Massive Particles (aka WIMPs) to axions. These candidates are attractive, particularly WIMPs, because the existence of such particles might help confirm supersymmetry theory – which in turn could help lead to a working Theory of Everything (ToE).
But so far, no evidence has been obtained that definitively proves the existence of either. Beyond being necessary in order for General Relativity to work, this invisible mass seems content to remain invisible to detection.
According to Jacobs, Starkman, and Lynn, this could indicate that dark matter exists within the realm of normal matter. In particular, they consider the possibility that dark matter consists of macroscopic objects – which they dub “Macros” – that can be characterized in units of grams and square centimeters respectively.
Macros are not only significantly larger than WIMPS and axions, but could potentially be assembled out of particles in the Standard Model of particle physics – such as quarks and leptons from the early universe – instead of requiring new physics to explain their existence. WIMPS and axions remain possible candidates for dark matter, but Jacobs and Starkman argue that there’s a reason to search elsewhere.
“The possibility that dark matter could be macroscopic and even emerge from the Standard Model is an old but exciting one,” Starkman told Universe Today, via email. “It is the most economical possibility, and in the face of our failure so far to find dark matter candidates in our dark matter detectors, or to make them in our accelerators, it is one that deserves our renewed attention.”
After eliminating most ordinary matter – including failed Jupiters, white dwarfs, neutron stars, stellar black holes, the black holes in centers of galaxies, and neutrinos with a lot of mass – as possible candidates, physicists turned their focus on the exotics.

Nevertheless, matter that was somewhere in between ordinary and exotic – relatives of neutron stars or large nuclei – was left on the table, Starkman said. “We say relatives because they probably have a considerable admixture of strange quarks, which are made in accelerators and ordinarily have extremely short lives,” he said.
Although strange quarks are highly unstable, Starkman points out that neutrons are also highly unstable. But in helium, bound with stable protons, neutrons remain stable.
“That opens the possibility that stable strange nuclear matter was made in the early Universe and dark matter is nothing more than chunks of strange nuclear matter or other bound states of quarks, or of baryons, which are themselves made of quarks,” said Starkman.
Such dark matter would fit the Standard Model.
This is perhaps the most appealing aspect of the Macros theory: the notion that dark matter, which our cosmological model of the Universe depends upon, can be proven without the need for additional particles.
Still, the idea that the universe is filled with a chunky, invisible mass rather than countless invisible particles does make the universe seem a bit stranger, doesn’t it?
Further Reading: Case Western