Matt Williams is a space journalist and science communicator for Universe Today and Interesting Engineering. He's also a science fiction author, podcaster (Stories from Space), and Taekwon-Do instructor who lives on Vancouver Island with his wife and family.
Manned missions to deep space present numerous challenges. In addition to the sheer amount of food, water and air necessary to keep a crew alive for months (or years) at a time, there’s also the question of keeping them busy for the entirety of a long-duration flight. Exercise is certainly an option, but the necessary equipment will take up space and be a drain on power.
In addition, they’ll need room to move around, places to sleep, eat, work, and relax during their down time. Otherwise, they will be at risk of succumbing to feelings of claustrophobia, anxiety, insomnia, and depression – among other things.
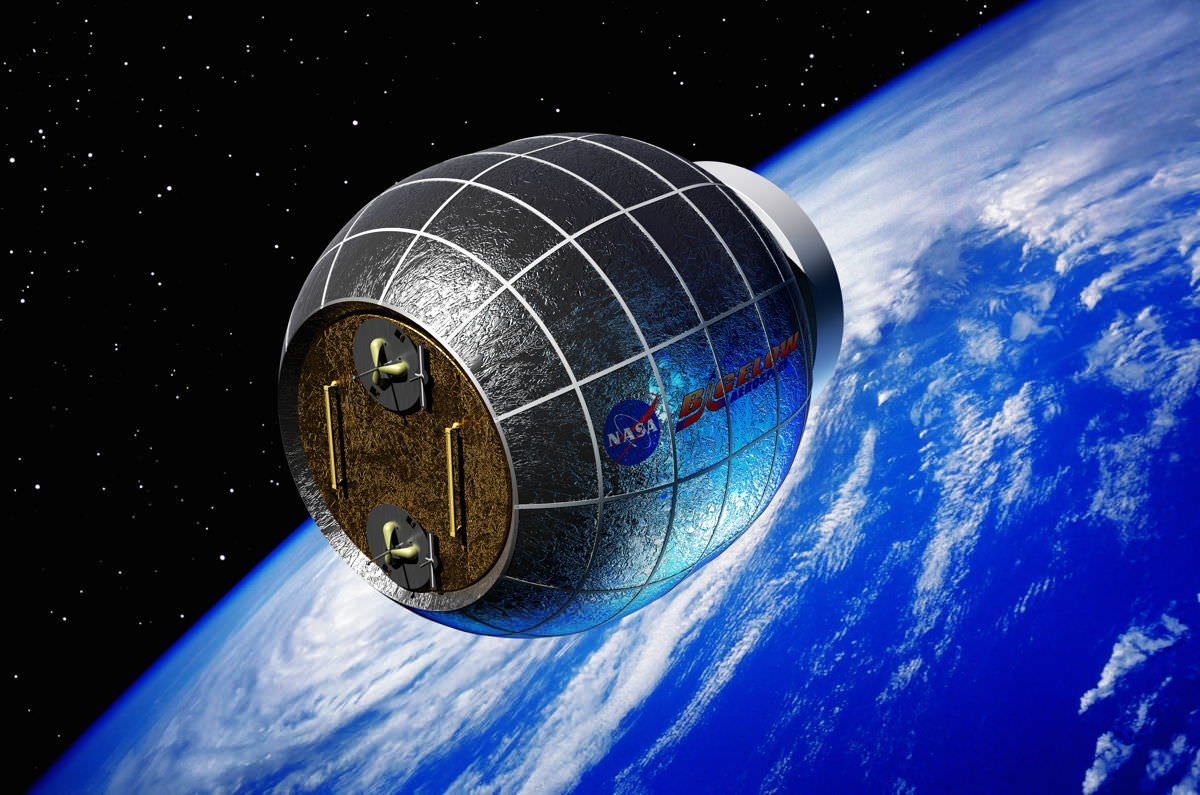
Artist's concept of the Bigelow Expandable Activity Module (BEAM), currently scheduled to be added to the International Space Station in 2015. Credit: Bigelow Aerospace.
Astronauts aboard the International Space Station are going to be getting an addition in the near future, and in the form of an inflatable room no less. The Bigelow Expandable Activity Module (BEAM) is the first privately-built space habitat that will added to the ISS, and it will be transported into orbit aboard a Space X Falcon 9 rocket sometime next year.
“The BEAM is one small step for Bigelow Aerospace,” Bigelow representative Michael Gold told Universe Today, “but is also one giant leap for private sector space activities since the BEAM will be the first privately owned and developed module ever to be part of a crewed system in space.”
Artist's conception of the Milky Way galaxy. Credit: Nick Risinger
When you look up at the night sky, assuming conditions are just right, you might just catch a glimpse of a faint, white band reaching across the heavens. This band, upon closer observation, looks speckled and dusty, filled with a million tiny points of light and halos of glowing matter. What you are seeing is the Milky Way, something that astronomers and stargazers alike have been staring up at since the beginning of time.
But just what is the Milky Way? Well, simply put, it is the name of the barred spiral galaxy in which our solar system is located. The Earth orbits the Sun in the Solar System, and the Solar System is embedded within this vast galaxy of stars. It is just one of hundreds of billions of galaxies in the Universe, and ours is called the Milky Way because the disk of the galaxy appears to be spanning the night sky like a hazy band of glowing white light. Continue reading “What is the Milky Way?”
Launch of Atlantis's final mission, STS-135. Credit: NASA. 3-D by Nathanial Burton-Bradford.
[/caption]
When it comes to measuring motion, that is the relative passage of an object through space at a certain rate of time, several different things need to be taken into account. For example, it is not enough to know the rate of change (i.e. the speed) of the object. Scientists must also be able to assign a vector quantity; or in other words, to know the direction as well as the rate of change of that object. In the end, this is major difference between Speed and Velocity. Though both are calculated using the same units (km/h, m/s, mph, etc.), the two are different in that one is described using numerical values alone (i.e. a scalar quantity) whereas the other describes both magnitude and direction (a vector quantity).
By definition, the speed of an object is the magnitude of its velocity, or the rate of change of its position. The average speed of an object in an interval of time is the distance traveled by the object divided by the duration of the interval. Represented mathematically, it looks like this: ν=[v]=[?] = [dr/dt]•, where speed ν is defined as the magnitude of the velocity v, that is the derivative of the position r with respect to time. The fastest possible speed at which energy or information can travel, according to special relativity, is the speed of light in vacuum (a.k.a. c = 299,792,458 meters per second, which is approximately 1079 million kilometers per hour or 671,000,000 mph).
Velocity, on the other hand, is the measurement of the rate and direction of change in the position of an object. Since it is a vector physical quantity, both magnitude and direction are required to define it. The scalar absolute value (magnitude) of velocity is speed, a quantity that is measured in metres per second (m/s) when using the SI (metric) system. Mathematically, this is represented as: v = Δx/Δt, where v is the average velocity of an object, (Δx) is the displacement and (Δt) is the time interval. Add to this a vector (i.e. Δx/Δt→, ←, or what have you), and you’ve got velocity!
As an example, consider the case of a bullet being fired from a gun. If we divide the overall distance it travels within a set period of time (say, one minute), than we have successfully calculated its speed. On the other hand, if we want to determine its velocity, we must consider the direction of the bullet after it’s been fired. Whereas the average speed of the object would be rendered as simple meters per second, the velocity would be meters per second east, north, or at a specific angle.
We have written many articles about speed and velocity for Universe Today. Here’s an article about formula for velocity, and here’s an article about escape velocity.
[/caption]
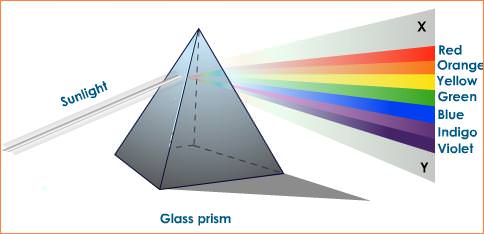
Look up into the rainy sky! What do you see? Well, if its just rained and the sun is once again shining, chances are you see a rainbow. Always a lovely sight isn’t it? But why is it that after a rainstorm, the air seems to catch the light in just the right way to produce this magnificent natural phenomenon? Much like stars, galaxies, and the flight of a bumblebee, some complicated physics underlie this beautiful act of nature. For starters, this effect, where light is broken into the visible spectrum of colors, is known as the Dispersion of Light. Another name for it is the prismatic effect, since the effect is the same as if one looked at light through a prism.
To put it simply, light is transmitted on several different frequencies or wavelengths. What we know as “color” is in reality the visible wavelengths of light, all of which travel at different speeds through different media. In other words, light moves at different speed through the vacuum of space than it does through air, water, glass or crystal. And when it comes into contact with a different medium, the different color wavelengths are refracted at different angles. Those frequencies which travel faster are refracted at a lower angle while those that travel slower are refracted at a sharper angle. In other words, they are dispersed based on their frequency and wavelength, as well as the materials Index of Refraction (i.e. how sharply it refracts light).
The overall effect of this – different frequencies of light being refracted at different angles as they pass through a medium – is that they appear as a spectrum of color to the naked eye. In the case of the rainbow, this occurs as a result of light passing through air that is saturated with water. Sunlight is often referred to as “white light” since it is a combination of all the visible colors. However, when the light strikes the water molecules, which have a stronger index of refraction than air, it disperses into the visible spectrum, thus creating the illusion of a colored arc in the sky.
Now consider a window pane and a prism. When light passes through glass that has parallel sides, the light will return in the same direction that it entered the material. But if the material is shaped like a prism, the angles for each color will be exaggerated, and the colors will be displayed as a spectrum of light. Red, since it has the longest wavelength (700 nanometers) appears at the top of the spectrum, being refracted the least. It is followed shortly thereafter by Orange, Yellow, Green, Blue, Indigo and Violet (or ROY G. GIV, as some like to say). These colors, it should be noted, do not appear as perfectly distinct, but blend at the edges. It is only through ongoing experimentation and measurement that scientists were able to determine the distinct colors and their particular frequencies/wavelengths.
We have written many articles about dispersion of light for Universe Today. Here’s an article about the refractor telescope, and here’s an article about visible light.
[/caption]
For some time, the behavior of light has baffled scientists. Initially, and in accordance with classic physics, light was thought to be a wave, an indefinable form of energy that simply flowed from a heated source. However, with the advent of quantum physics, scientists came to realize that photons, a tiny elementary particle responsible for all forms of electromagnetic radiation, was in fact the source. So you can imagine how confounded they were when, in the course of performing experiments, they discovered that it exhibited the behavior of both a particle and a wave! This rather unique behavior, the ability of light to behave as a wave, even though it is made up of tiny particles, is known as the Diffraction of Light.
By definition, diffraction refers to the apparent bending of waves around small obstacles and the spreading out of waves past small openings. It had long been understood that this is what happens when a wave encounters an obstacle, and by the 17th and 18th centuries, this behavior was observed through experiments involving light. One such physicist who observed this at work was Thomas Young (1773 – 1829), an English polymath who is credited devised the double-slit experiment. In this experiment, Young shone a monochromatic light source (i.e. light of a single color) through an aperture (in this case, a wall with a horizontal slits cut in it) and measured the results on a screen located on the other side. The results were interesting, to say the least. Instead of appearing in the same relative shape as the aperture, the light appeared to be diffracting, implying that it was made up of waves. The experiment was even more interesting when a second slit was cut into the screen (hence the name double-slit). Young, and those who repeated the experiment, found that interference waves resulted, meaning that two propagation waves occurred which then began to interfere with one another.
A more common example comes to us in the form of shadows. Ever notice how the outer edges do not appear solid, but slightly fuzzy instead? This occurs as a result of light bending slightly as it passes around the edge of an object, again, consistent with the behavior of a wave. Similar effects occur when light waves travel through a medium with a varying refractive index, resulting in a spectrum of color or a distorted image. Since all physical objects have wave-like properties at the atomic level, diffraction can be studied in accordance with the principles of quantum mechanics.
We have written many articles about diffraction of light for Universe Today. Here’s an article about visible light, and here’s an article about telescope resolution.
If you’d like more info on diffraction of light, check out these articles:
The Physics of Light: Diffraction Experiments on Diffraction of Light
This view of Earth comes from NASA's Moderate Resolution Imaging Spectroradiometer aboard the Terra satellite
[/caption]
The planet Earth has three motions: it rotates about its axis, which gives us day and night; it revolves around the sun, giving us the seasons of the year, and through the Milky Way along with the rest of the Solar System. In each case, scientists have striven to calculate not only the time it takes, but the relative velocities involved. When it comes to the Earth rotating on its axis, a process which takes 23 hours, 56 minutes and 4.09 seconds, the process is known as a sidereal day, and the speed at which it moves is known as the Earth’s Angular Velocity. This applies equally to the Earth rotating around the axis of the Sun and the center of the Milky Way Galaxy.
In physics, the angular velocity is a vector quantity which specifies the angular speed of an object and the axis about which the object is rotating. The SI unit of angular velocity is radians per second, although it may be measured in other units such as degrees per second, revolutions per second, etc. and is usually represented by the symbol omega (ω, rarely Ω). A radian, by definition, is a unit which connects the radius of an arc, the length of the arc and the angle subtended by the arc. A full radian is 360 degrees, hence we know that the Earth performs two radians when performing a full rotation around an axis. However, it is sometimes also called the rotational velocity and its magnitude – the rotational speed – is typically measured in cycles or rotations per unit time (e.g. revolutions per minute). In addition, when an object rotating about an axis, every point on the object has the same angular velocity.
Mathematically, the average angular velocity of an object can be represented by the following equation: ωaverage= Δθ/Δt, where ω is the radians/revolutions per second (on average), Δ is the change in quantity, θ is the velocity, and t is time. When calculating the angular velocity of the Earth as it completes a full rotation on its own axis (a solar day), this equation is represented as: ωavg = 2πrad/1day (86400 seconds), which works out to a moderate angular velocity of 7.2921159 × 10⁻⁵ radians/second. In the case of a Solar Year, where ωavg = 2πrad/1year (3.2×10⁷ seconds), we see that the angular velocity works out to 2.0×10⁻⁷ rad/s.
We have written many articles about the angular velocity of Earth for Universe Today. Here’s an article about angular velocity, and here’s an article about why the Earth rotates.
[/caption]
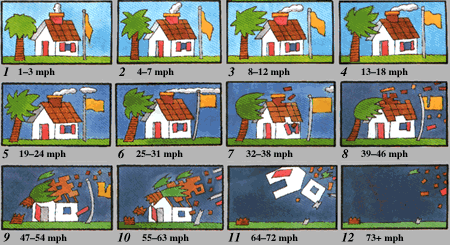
The high seas. Tankers, fishing trawlers and naval craft watch the horizon with eager anticipation. The wind is high and the waves are rising. The ship’s anemometer (wind speed detector) reads sixty-five kilometers per hour. The perfect storm is coming! Back on land, people are observing much of the same. The high winds are picking up debris, throwing it around and causing much damage. The waves are high and crashing all along the coast and even further inland. Power lines are destroyed, trees uprooted, and houses looking out to sea pelted by seawater and hard rain. In the aftermath of all this, this storm would been classified as 12 on the Beaufort Scale. Alternately known as the Beaufort Wind Force Scale, this is an empirical measure that relates wind speed to observed conditions at sea or on land.
Officially devised in 1805 by an Irish-born Royal Navy Officer named Sir Francis Beaufort (apparently while serving on the HMS Woolwich), this scale has a long and complicated history. It began with Daniel Defoe, the English novelist who, after witnessing of the Great Storm of 1703, suggested that a scale of winds be developed based on 11 points and used words common to the English language. By the early 19th century, there was renewed demand for such a scale, as naval officers were hard pressed to make accurate weather observations that weren’t tainted by partiality. Beaufort’s scale was therefore the first standardized scale to be introduced, and has gone through a number of variations since.
The initial scale of thirteen classes (zero to twelve) did not reference wind speed but related to qualitative wind conditions based on the effects it had on the sails of a British man-of-war. At zero, all the sails would be up; at six, half of the sails would have been taken down; and at twelve, all sails would have to be stowed away. In the late 1830’s, the scale was made standard for all Royal Navy vessels and used for all ship’s logs. In the 1850’s it was adapted to non-naval use, with scale numbers corresponding to cup anemometer rotations. By 1916, to accommodate the growth of steam power, the descriptions were changed to how the sea, not the sails, behaved and extended to land observations. It was extended once again in 1946 when Forces 13 to 17 were added, but only for special cases such as tropical cyclones.
Today, many countries have abandoned the scale and use the metric-based units m/s or km/h instead, but the severe weather warnings given to public are still approximately the same as when using the Beaufort scale. For example, wind speeds on the 1946 Beaufort scale are based on the empirical formula: v = 0.836 B3/2 m/s, where v is the equivalent wind speed at 10 meters above the sea surface and B is the Beaufort scale number. Oftentimes, hurricane force winds are described using the Beaufort scales 12 through 16 in conjunction with the Saffir-Simpson Hurricane Scale, by which actual hurricanes are measured.
We have written a few related articles for Universe Today. Here’s an article about, and here’s an article about the F5 tornado. Also, here are some extreme weather pictures.
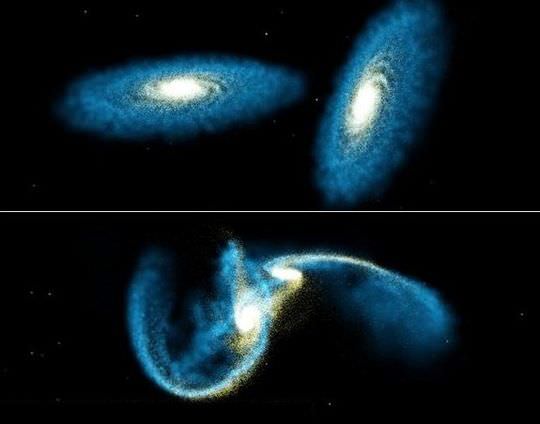
Seattle, January, 2003. Two prestigious astronomers: Puragra GuhaThakurta of UCSC and David Reitzel of UCLA present some new findings to the American Astronomical Society that would seem to indicate that large spiral galaxies grow by gobbling up smaller satellite galaxies. Their evidence, a faint trail of stars in the nearby Andromeda galaxy that are thought to be a vast trail of debris left over from an ancient merger of Andromeda with another, smaller galaxy. This process, known as Galactic Cannibalism is a process whereby a large galaxy, through tidal gravitational interactions with a companion galaxy, merges with that companion, resulting in a larger galaxy.
The most common result of this process is an irregular galaxy of one form or another, although elliptical galaxies may also result. Several examples of this have been observed with the help of the Hubble telescope, which include the Whirlpool Galaxy, the Mice Galaxies, and the Antennae Galaxies, all of which appear to be in one phase or another of merging and cannibalising. However, this process is not to be confused with Galactic Collision which is a similar process where galaxies collide, but retain much of their original shape. In these cases, a smaller degree of momentum or a considerable discrepancy in the size of the two galaxies is responsible. In the former case, the galaxies cease moving after merging because they have no more momentum to spare; in the latter, the larger galaxies shape overtakes the smaller one and their appears to be little in the way of change.
All of this is consistent with the most current, hierarchical models of galaxy formation used by NASA, other space agencies and astronomers. In this model, galaxies are believed to grow by ingesting smaller, dwarf galaxies and the minihalos of dark matter that envelop them. In the process, some of these dwarf galaxies are shredded by the gravitational tidal forces when they travel too close to the center of the “host” galaxy’s enormous halo. This, in turn, leaves streams of stars behind, relics of the original event and one of the main pieces of evidence for this theory. It has also been suggested that galactic cannibalism is currently occurring between the Milky Way and the Large and Small Magellanic Clouds that exist beyond its borders. Streams of gravitationally-attracted hydrogen arcing from these dwarf galaxies to the Milky Way is taken as evidence for this theory.
As interesting as all of these finds are, they don’t exactly bode well for those of us who call the Milky Way galaxy, or any other galaxy for that matter, home! Given our proximity to the Andromeda Galaxy and its size – the largest galaxy of the Local Group, boasting over a trillion stars to our measly half a trillion – it is likely that our galaxy will someday collide with it. Given the sheer scale of the tidal gravitational forces involved, this process could prove disastrous for any and all life forms and planets that are currently occupy it!
For astronomers and physicists alike, the depths of space are a treasure trove that may provide us with the answers to some of the most profound questions of existence. Where we come from, how we came to be, how it all began, etc. However, observing deep space presents its share of challenges, not the least of which is visual accuracy.
In this case, scientists use what is known as Active Optics in order to compensate for external influences. The technique was first developed during the 1980s and relied on actively shaping a telescope’s mirrors to prevent deformation. This is necessary with telescopes that are in excess of 8 meters in diameter and have segmented mirrors.
Definition:
The name Active Optics refers to a system that keeps a mirror (usually the primary) in its optimal shape against all environmental factors. The technique corrects for distortion factors, such as gravity (at different telescope inclinations), wind, temperature changes, telescope axis deformation, and others.
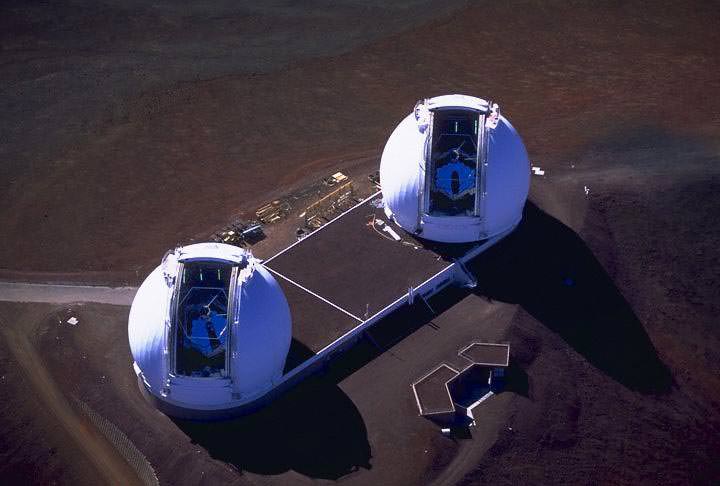
The twin Keck telescopes shooting their laser guide stars into the heart of the Milky Way on a beautifully clear night on the summit on Mauna Kea. Credit: keckobservatory.org/Ethan
Adaptive Optics actively shapes a telescope’s mirrors to prevent deformation due to external influences (like wind, temperature, and mechanical stress) while keeping the telescope actively still and in its optimal shape. The technique has allowed for the construction of 8-meter telescopes and those with segmented mirrors.
Use in Astronomy:
Historically, a telescope’s mirrors have had to be very thick to hold their shape and to ensure accurate observations as they searched across the sky. However, this soon became unfeasible as the size and weight requirements became impractical. New generations of telescopes built since the 1980s have relied on very thin mirrors instead.
But since these were too thin to keep themselves in the correct shape, two methods were introduced to compensate. One was the use of actuators which would hold the mirrors rigid and in an optimal shape, the other was the use of small, segmented mirrors which would prevent most of the gravitational distortion that occur in large, thick mirrors.
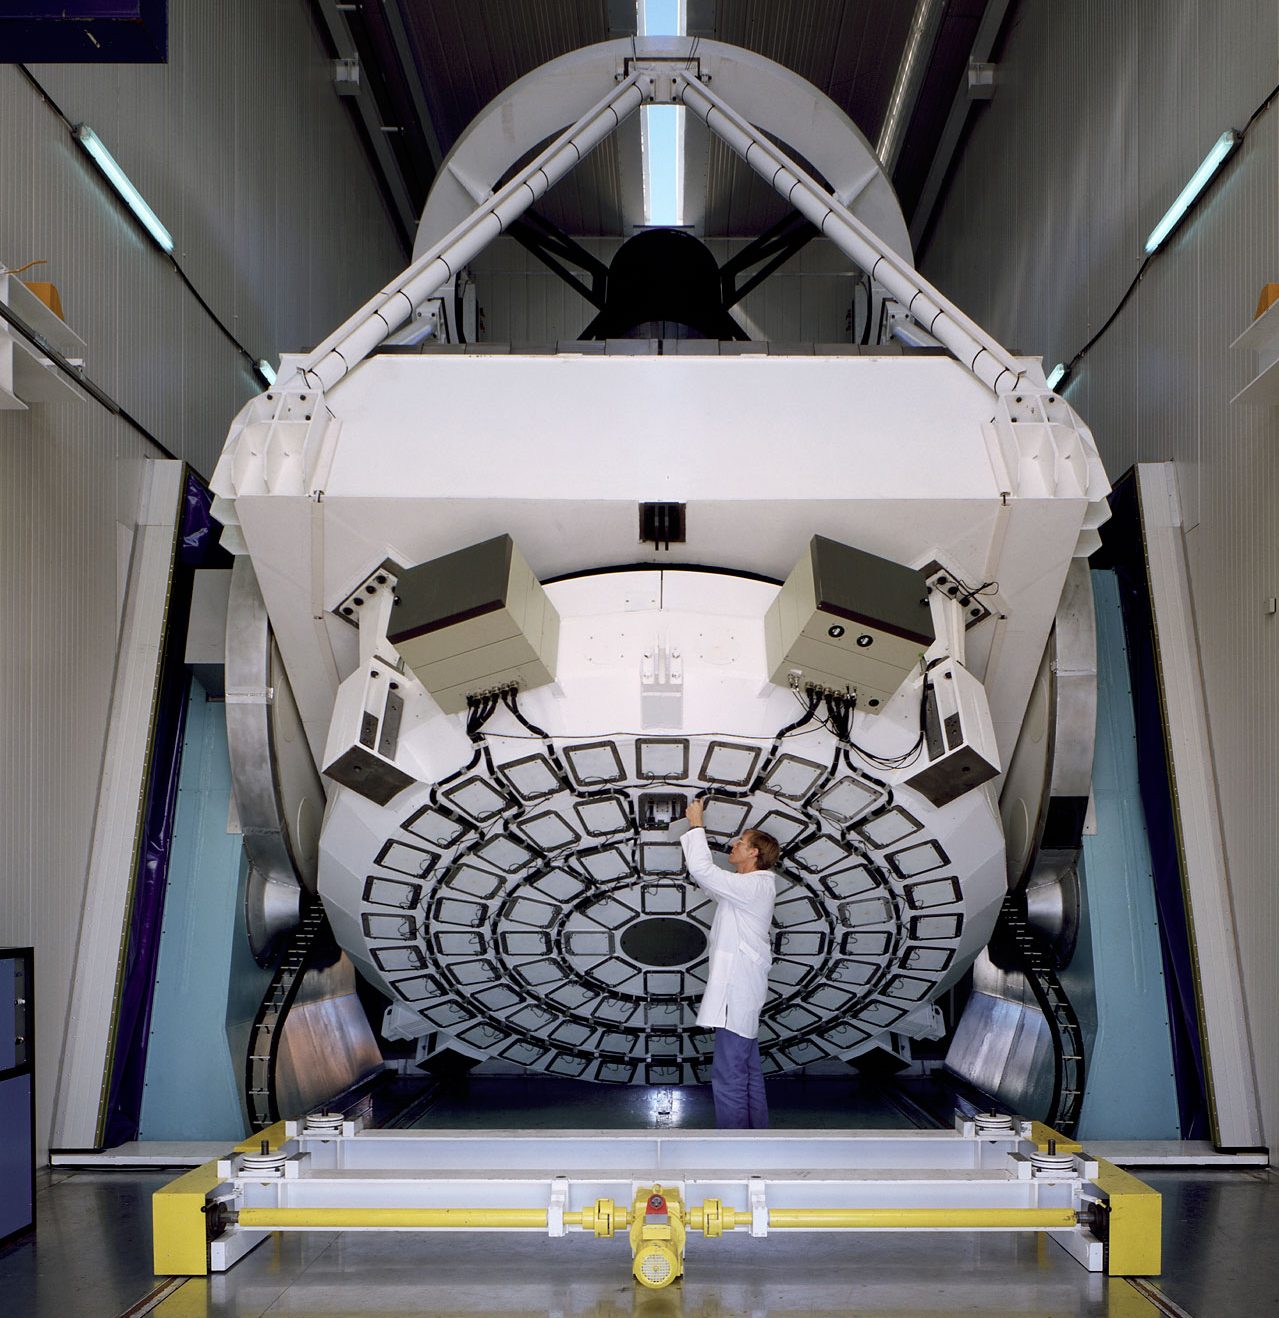
The New Technology Telescope (NTT) pioneered the Active Optics. Credit: ESO/C.Madsen. Bacon
Other Applications:
In addition to astronomy, Active Optics is used for a number of other purposes as well. These include laser set-ups, where lenses and mirrors are used to steer the course of a focused beam. Interferometers, devices which are used to emit interfering electromagnetic waves, also relies on Active Optics.
These interferometers are used for the purposes of astronomy, quantum mechanics, nuclear physics, fiber optics, and other fields of scientific research. Active optics are also being investigated for use in X-ray imaging, where actively deformable grazing incidence mirrors would be employed.
Adaptive Optics:
Active Optics are not to be confused with Adaptive Optics, a technique that operates on a much shorter timescale to compensate for atmospheric effects. The influences that active optics compensate for (temperature, gravity) are intrinsically slower and have a larger amplitude in aberration.
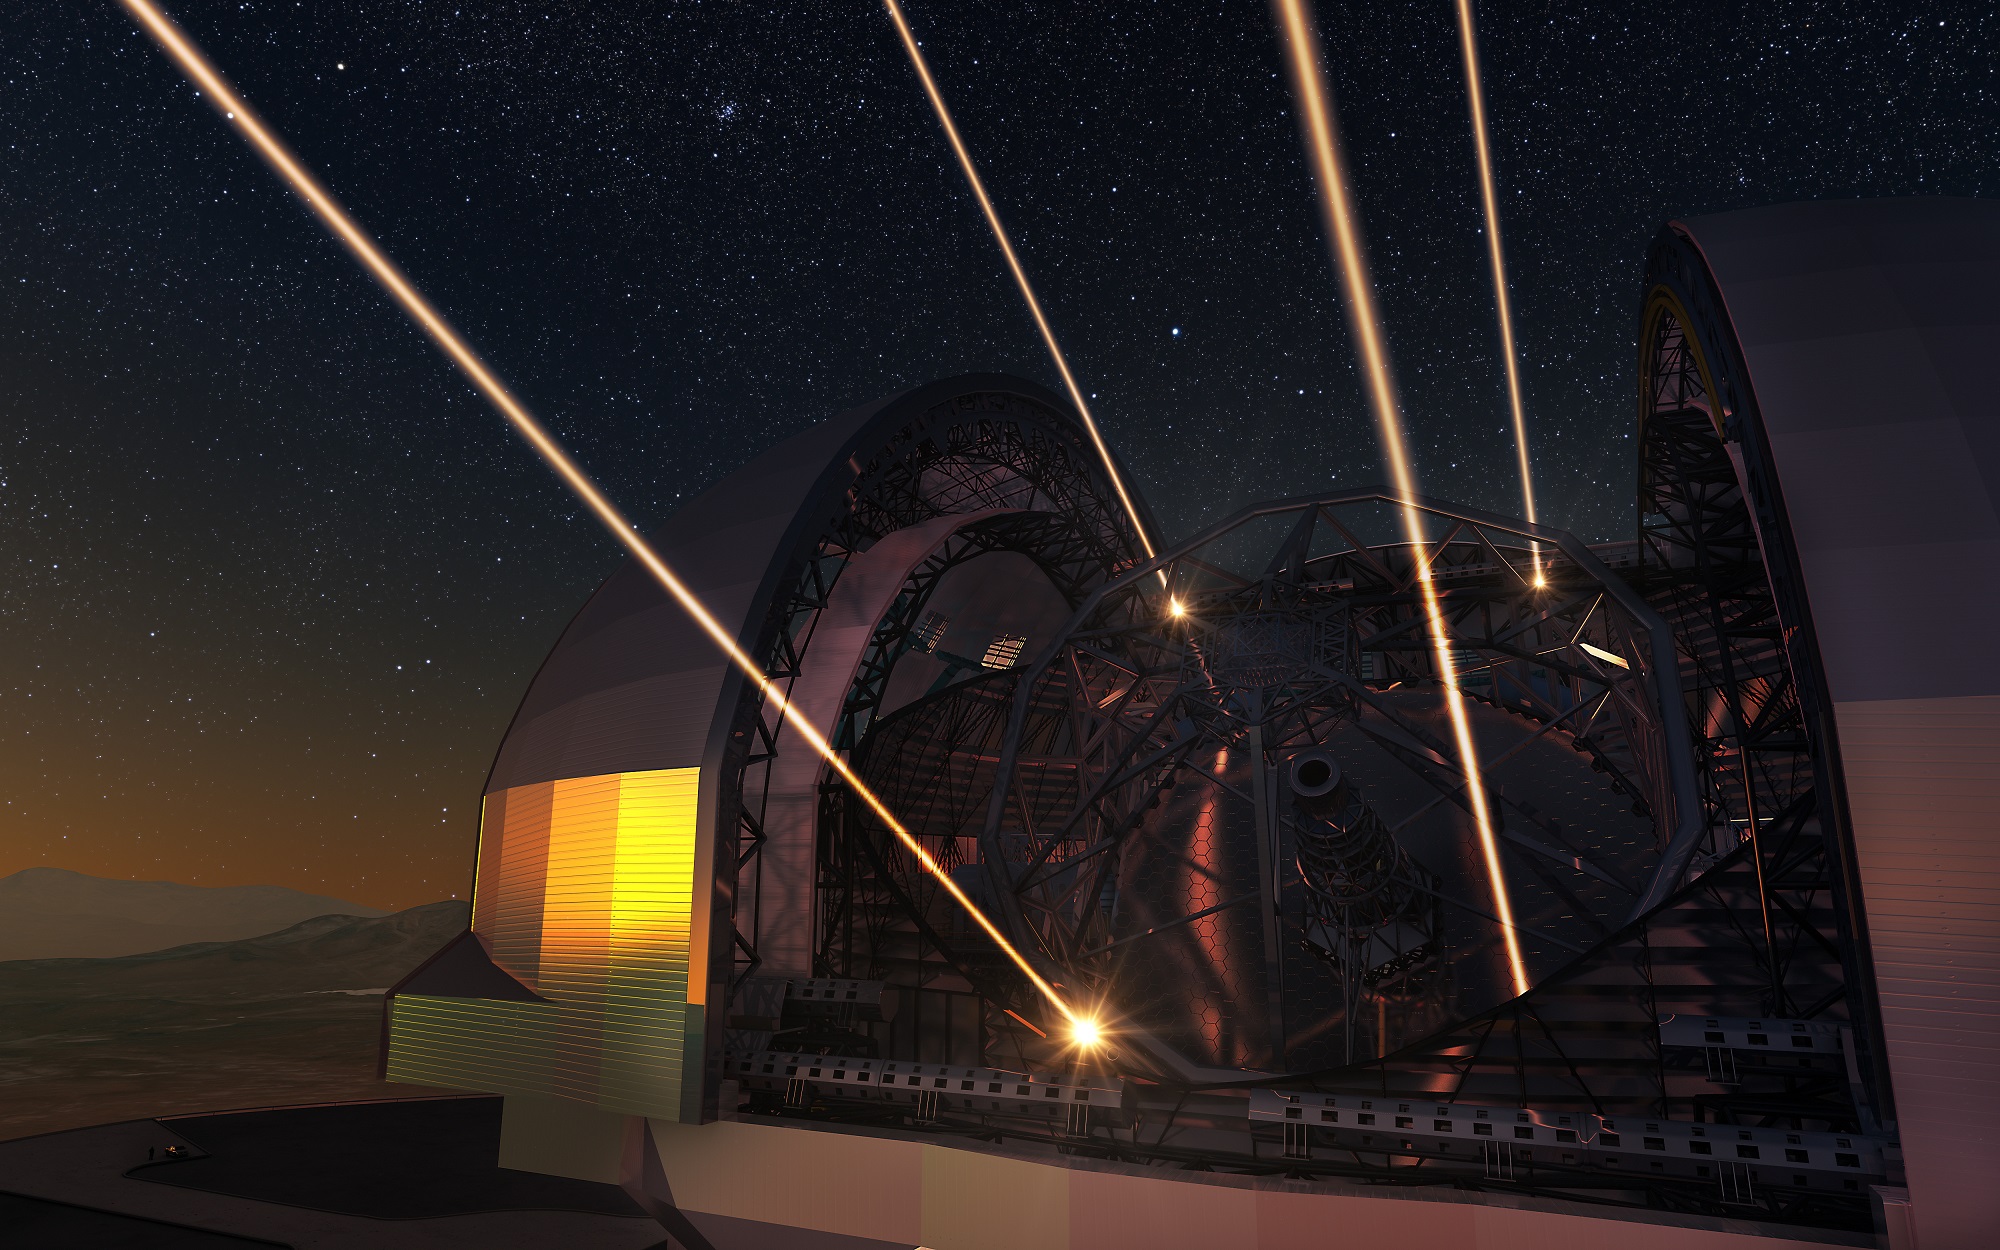
Artist’s impression of the European Extremly Large Telescope deploying lasers for adaptive optics. Credit: ESO/L. Calçada/N. Risinger
On the other hand, Adaptive Optics corrects for atmospheric distortions that affect the image. These corrections need to be much faster, but also have smaller amplitude. Because of this, adaptive optics uses smaller corrective mirrors (often the second, third or fourth mirror in a telescope).