First Law of Thermodynamics

First Law of Thermodynamics

[/caption]

Ever wonder how heat really works? Well, not too long ago, scientists, looking to make their steam engines more efficient, sought to do just that. Their efforts to understand the interrelationship between energy conversion, heat and mechanical work (and subsequently the larger variables of temperature, volume and pressure) came to be known as thermodynamics, taken from the Greek word “thermo” (meaning “heat”) and “dynamis” (meaning force). Like most fields of scientific study, thermodynamics is governed by a series of laws that were realized thanks to ongoing observations and experiments. The first law of thermodynamics, arguably the most important, is an expression of the principle of conservation of energy.

Consistent with this principle, the first law expresses that energy can be transformed (i.e. changed from one form to another), but cannot be created or destroyed. It is usually formulated by stating that the change in the internal energy (ie. the total energy) contained within a system is equal to the amount of heat supplied to that system, minus the amount of work performed by the system on its surroundings. Work and heat are due to processes which add or subtract energy, while internal energy is a particular form of energy associated with the system – a property of the system, whereas work done and heat supplied are not. A significant result of this distinction is that a given internal energy change can be achieved by many combinations of heat and work.

This law was first expressed by Rudolf Clausius in 1850 when he said: “There is a state function E, called ‘energy’, whose differential equals the work exchanged with the surroundings during an adiabatic process.” However, it was Germain Hess (via Hess’s Law), and later by Julius Robert von Mayer who first formulated the law, however informally. It can be expressed through the simple equation E2 – E1 = Q – W, whereas E represents the change in internal energy, Q represents the heat transfer, and W, the work done. Another common expression of this law, found in science textbooks, is ?U=Q+W, where ? represents change and U, heat.

An important concept in thermodynamics is the “thermodynamic system”, a precisely defined region of the universe under study. Everything in the universe except the system is known as the surroundings, and is separated from the system by a boundary which may be notional or real, but which by convention delimits a finite volume. Exchanges of work, heat, or matter between the system and the surroundings take place across this boundary. Thermodynamics deals only with the large scale response of a system which we can observe and measure in experiments (such as steam engines, for which the study was first developed).

We have written many articles about the First Law of Thermodynamics for Universe Today. Here’s an article about entropy, and here’s an article about Hooke’s Law.

If you’d like more info on the First Law of Thermodynamics, check out NASA’s Glenn Research Center, and here’s a link to Hyperphysics.

We’ve also recorded an episode of Astronomy Cast all about planet Earth. Listen here, Episode 51: Earth.

Sources:
http://en.wikipedia.org/wiki/First_law_of_thermodynamics
http://hyperphysics.phy-astr.gsu.edu/hbase/thermo/firlaw.html
http://en.wikipedia.org/wiki/Internal_energy
http://www.grc.nasa.gov/WWW/K-12/airplane/thermo1.html
http://en.wikipedia.org/wiki/Thermodynamics
http://en.wikipedia.org/wiki/Laws_of_thermodynamics

What are Earthquake Fault Lines?

False-color composite image of the Port-au-Prince, Haiti region, taken Jan. 27, 2010 by NASA’s UAVSAR airborne radar. The city is denoted by the yellow arrow; the black arrow points to the fault responsible for the Jan. 12 earthquake. Image credit: NASA

Every so often, in different regions of the world, the Earth feels the need to release energy in the form of seismic waves. These waves cause a great deal of hazards as the energy is transferred through the tectonic plates and into the Earth’s crust. For those living in an area directly above where two tectonic plates meet, the experience can be quite harrowing!

This area is known as a fault, or a fracture or discontinuity in a volume of rock, across which there is significant displacement. Along the line where the Earth and the fault plane meet, is what is known as a fault line. Understanding where they lie is crucial to our understanding of Earth’s geology, not to mention earthquake preparedness programs.

Definition:

In geology, a fault is a fracture or discontinuity in the planet’s surface, along which movement and displacement takes place. On Earth, they are the result of activity with plate tectonics, the largest of which takes place at the plate boundaries. Energy released by the rapid movement on active faults is what causes most earthquakes in the world today.

The Earth's Tectonic Plates. Credit: msnucleus.org
The Earth’s Tectonic Plates. Credit: msnucleus.org

Since faults do not usually consist of a single, clean fracture, geologists use the term “fault zone” when referring to the area where complex deformation is associated with the fault plane. The two sides of a non-vertical fault are known as the “hanging wall” and “footwall”.

By definition, the hanging wall occurs above the fault and the footwall occurs below the fault. This terminology comes from mining. Basically, when working a tabular ore body, the miner stood with the footwall under his feet and with the hanging wall hanging above him. This terminology has endured for geological engineers and surveyors.

Mechanisms:

The composition of Earth’s tectonic plates means that they cannot glide past each other easily along fault lines, and instead produce incredible amounts of friction. On occasion, the movement stops, causing stress to build up in rocks until it reaches a threshold. At this point, the accumulated stress is released along the fault line in the form of an earthquake.

When it comes to fault lines and the role they have in earthquakes, three important factors come into play. These are known as the “slip”, “heave” and “throw”. Slip refers to the relative movement of geological features present on either side of the fault plane; in other words, the relative motion of the rock on each side of the fault with respect to the other side.

Transform Plate Boundary
Tectonic Plate Boundaries. Credit:

Heave refers to the measurement of the horizontal/vertical separation, while throw is used to measure the horizontal separation. Slip is the most important characteristic, in that it helps geologists to classify faults.

Types of Faults:

There are three categories or fault types. The first is what is known as a “dip-slip fault”, where the relative movement (or slip) is almost vertical. A perfect example of this is the San Andreas fault, which was responsible for the massive 1906 San Francisco Earthquake.

Second, there are “strike-slip faults”, in which case the slip is approximately horizontal. These are generally found in mid-ocean ridges, such as the Mid-Atlantic Ridge – a 16,000 km long submerged mountain chain occupying the center of the Atlantic Ocean.

Lastly, there are oblique-slip faults which are a combination of the previous two, where both vertical and horizontal slips occur. Nearly all faults will have some component of both dip-slip and strike-slip, so defining a fault as oblique requires both dip and strike components to be measurable and significant.

Map of the Earth showing fault lines (blue) and zones of volcanic activity (red). Credit: zmescience.com

Impacts of Fault Lines:

For people living in active fault zones, earthquakes are a regular hazard and can play havoc with infrastructure, and can lead to injuries and death. As such, structural engineers must ensure that safeguards are taken when building along fault zones, and factor in the level of fault activity in the region.

This is especially true when building crucial infrastructure, such as pipelines, power plants, damns, hospitals and schools. In coastal regions, engineers must also address whether tectonic activity can lead to tsunami hazards.

For example, in California, new construction is prohibited on or near faults that have been active since the Holocene epoch (the last 11,700 years) or even the Pleistocene epoch (in the past 2.6 million years). Similar safeguards play a role in new construction projects in locations along the Pacific Rim of fire, where many urban centers exist (particularly in Japan).

Various techniques are used to gauge when the last time fault activity took place, such as studying soil and mineral samples, organic and radiocarbon dating.

We have written many articles about the earthquake for Universe Today. Here’s What Causes Earthquakes?, What is an Earthquake?, Plate Boundaries, Famous Earthquakes, and What is the Pacific Ring of Fire?

If you’d like more info on earthquakes, check out the U.S. Geological Survey Website. And here’s a link to NASA’s Earth Observatory.

We’ve also recorded related episodes of Astronomy Cast about Plate Tectonics. Listen here, Episode 142: Plate Tectonics.

Sources:

Destructive Interference

Destructive Interference Image Credit: Science World

[/caption]

Sound travels in waves, which function much the same as ocean waves do. One wave cycle is a complete wave, consisting of both the up half (crest) and down half (trough). Waves also have a certain amplitude which is the measure of how strong the wave is; the higher the amplitude, the higher the crests and deeper the troughs. Waves don’t usually reflect when they strike other waves. Instead, they combine. If the amplitudes of two waves have the same sign (either both positive or both negative), they will add together to form a wave with a larger amplitude. This is called constructive interference. If the two amplitudes have opposite signs, they will subtract to form a combined wave with lower amplitude. This is what is called Destructive Interference, which is a subfield of the larger study in physics known as wave propagation.

An interesting example of this is the loudspeaker. When music is played on the loudspeaker, sound waves emanate from the front and back of the speaker. Since they are out of phase, they diffract into the entire region around the speaker. The two waves interfere destructively and cancel each other, particularly at very low frequencies. But when the speaker is held up behind baffle, which in this case consists of a wooden sheet with a circular hole cut in it, the sounds can no longer diffract and mix while they are out of phase, and as a consequence the intensity increases enormously. This is why loudspeakers are often mounted in boxes, so that the sound from the back cannot interfere with the sound from the front.

Scientists and engineers use destructive interference for a number of applications to levels reduce of ambient sound and noise. One example of this is the modern electronic automobile muffler. This device senses the sound propagating down the exhaust pipe and creates a matching sound with opposite phase. These two sounds interfere destructively, muffling the noise of the engine. Another example is in industrial noise control. This involves sensing the ambient sound in a workplace, electronically reproducing a sound with the opposite phase, and then introducing that sound into the environment so that it interferes destructively with the ambient sound to reduce the overall sound level.

For a hands-on demonstration of how destructive interference works, click on this link.

We have written many articles about destructive interference for Universe Today. Here’s an article about constructive waves, and here’s an article about the Casimir Effect.

If you’d like more info on destructive interference, check out Running Interference, and here’s a link to NASA Science page about Interference.

We’ve also recorded an entire episode of Astronomy Cast all about the Wave Particle Duality. Listen here, Episode 83: Wave Particle Duality.

Sources:
http://en.wikipedia.org/wiki/Interference_%28wave_propagation%29
http://en.wikipedia.org/wiki/Loudspeaker_enclosure
http://en.wikipedia.org/wiki/Sound_baffle
http://www.windows2universe.org/earth/Atmosphere/tornado/beat.html
http://library.thinkquest.org/19537/Physics5.html
http://zonalandeducation.com/mstm/physics/waves/interference/destructiveInterference/InterferenceExplanation3.html

Desertification

Desertification Image Credit: Ewan Robinson

[/caption]

The Sahelian-drought, that began in 1968 and took place in sub-Saharan Africa, was responsible for the deaths of between 100,000 to 250,000 people, the displacement of millions more and the collapse of the agricultural base for several African nations. In North America during the 1930’s, parts of the Canadian Prairies and the “Great Planes” in the US turned to dust as a result of drought and poor farming practices. This “Dust Bowl” forced countless farmers to abandon their farms and way of life and made a fragile economic situation even worse. In both cases, a combination of factors led to the process known as Desertification. This is defined as the persistent degradation of dryland ecosystems due to natural and man-made factors, and it is a complex process.

Desertification can be caused by climactic variances, but the chief cause is human activity. It is principally caused by overgrazing, overdrafting of groundwater and diversion of water from rivers for human consumption and industrial use. Add to that overcultivation of land which exhausts the soil and deforestation which removes trees that anchor the soil to the land, and you have a very serious problem! Today, desertification is devouring more than 20,000 square miles of land worldwide every year. In North America, 74% of the land in North America is affected by desertification while in the Mediterranean, water shortages and poor harvests during the droughts of the early 1990s exposed the acute vulnerability of the Mediterranean region to climatic extremes.

In Africa, this presents a serious problem where more than 2.4 million acres of land, which constitutes 73% of its drylands, are affected by desertification. Increased population and livestock pressure on marginal lands have accelerated this problem. In some areas, where nomads still roam, forced migration causes these people to move to new areas and place stress on new lands which are less arid and hence more vulnerable to overgrazing and drought. Given the existing problems of overpopulation, starvation, and the fact that imports are not a readily available option, this phenomenon is likely to lead to greater waves of starvation and displacement in the near future.

Against this backdrop, the prospect of a major climate change brought about by human activities is a source of growing concern. Increased global mean temperatures will mean more droughts, higher rates of erosion, and a diminished supply land water; which will seriously undermine efforts to combat drought and keep the world’s deserts from spreading further. The effects will be felt all over the world but will hit the equatorial regions of the world especially hard, regions like Sub-Saharan Africa, the Mediterranean, Central and South America, where food shortages are already a problem and are having serious social, economic and political consequences.

We have written many articles about desertification for Universe Today. Here’s an article about the largest desert on Earth, and here’s an article about the Atacama Desert.

If you’d like more info on desertification, check out Visible Earth Homepage. And here’s a link to NASA’s Earth Observatory.

We’ve also recorded an episode of Astronomy Cast all about planet Earth. Listen here, Episode 51: Earth.

Sources:
http://en.wikipedia.org/wiki/Desertification
http://www.greenfacts.org/en/desertification/index.htm
http://archive.greenpeace.org/climate/science/reports/desertification.html
http://pubs.usgs.gov/gip/deserts/desertification/
http://didyouknow.org/deserts/
http://en.wikipedia.org/wiki/Overdrafting

How Does Carbon Capture Work?

High concentrations of carbon dioxide (in red) tend to congregate in the northern hemisphere during colder months, when plants can't absorb as much from the atmosphere. This picture is based on a NASA Goddard computer model from ground-based observations and depicts concentrations on March 30, 2006. Credit: NASA's Goddard Space Flight Center/B. Putman/YouTube (screenshot)

What if it were possible to just suck all the harmful pollutants out of the air so that they wouldn’t be such a nuisance? What if it were also possible to convert these atmospheric pollutants back into fossil fuels, or possibly ecologically-friendly bio fuels? Why, then we would be able to worry far less about smog, respiratory illnesses, and the effects that high concentrations of these gases have on the planet.

This is the basis of Carbon Capture, a relatively new concept where carbon dioxide is captured at point sources – such as factories, natural-gas plants, fuel plants, major cities, or any other place where large concentrations of CO² are known to be found. This CO² can then be stored for future use, converted into biofuels, or simply put back into the Earth so that it doesn’t enter the atmosphere.

Description:

Like many other recent developments, carbon capture is part of a new set of procedures that are collectively known as geoengineering. The purpose of these procedures are to alter the climate to counteract the effects of global warming, generally by targeting one of the chief greenhouse gases. The technology has existed for some time, but it has only been in recent years that it has been proposed as a means of combating climate change as well.

Schematic showing both terrestrial and geological sequestration of carbon dioxide emissions from a coal-fired plant. Credit: web.ornl.gov

Currently, carbon capture is most often employed in plants that rely on fossil fuel burning to generate electricity. This process is performed in one of three basic ways – post-combustion, pre-combustion and oxy-fuel combustion. Post-combustion involves removing CO2 after the fossil fuel is burned and is converted into a flue gas, which consists of CO2, water vapor, sulfur dioxides and nitrogen oxide.

When the gases travel through a smokestack or chimney, CO² is captured by a “filter” which actually consists of solvents that are used to absorb CO2 and water vapor. This technique is effective in that such filters can be retrofitted to older plants, avoiding the need for a costly power plant overhaul.

Benefits and Challenges:

The results of these processes have so far been encouraging – which boast the possibility of up to 90 % of CO² being removed from emissions (depending on the type of plant and the method used). However, there are concerns that some of these processes add to the overall cost and energy consumption of power plants.

According to 2005 report by the Intergovernmental Panel on Climate Change (IPCC), the additional costs range from 24 to 40% for coal power plants, 11 to 22% for natural gas plants, and 14 to 25% for coal-based gasification combined cycle systems. The additional power consumption also creates more in the way of emissions.

Vehicle emissions are one of the main sources of carbon dioxide today. Credit: ucsusa.org

In addition, while CC operations are capable of drastically reducing CO², they can add other pollutants to the air. The amounts of kind of pollutants depend on the technology, and range from ammonia and nitrogen oxides (NO and NO²) to sulfur oxides and disulfur oxides (SO, SO², SO³, S²O, S²O³. etc.). However, researchers are developing new techniques which they hope will reduce both costs and consumption and not generate additional pollutants.

Examples:

A good example of the Carbon Capture process is the Petro Nova project, a coal-fired power plant in Texas. This plant began being upgraded by the US Dept. of Energy (DOE) in 2014 to accommodate the largest post-combustion carbon-capture operation in the world.

Consisting of filters that would capture the emissions, and infrastructure that would place it back in the Earth, the DOE estimates that this operation will be capable of capturing 1.4 million tons of CO2 that previously would have been released into the air.

In the case of pre-combustion, CO² is trapped before the fossil fuel is even burned. Here, coal, oil or natural gas is heated in pure oxygen, resulting in a mix of carbon monoxide and hydrogen. This mix is then treated in a catalytic converter with steam, which then produces more hydrogen and carbon dioxide.

The US Department of Energy's (DoE) Petro Nova project, which will be the argest post-combustion carbon capture operation in the world. Credit: DOE
When complete, the US Department of Energy’s (DoE) Petro Nova will be the largest post-combustion carbon capture operation in the world. Credit: DOE

These gases are then fed into flasks where they are treated with amine (which binds with the CO² but not hydrogen); the mixture is then heated, causing the CO² to rise where it can be collected. In the final process (oxy-fuel combustion), fossil fuel is burned in oxygen, resulting in a gas mixture of steam and CO². The steam and carbon dioxide are separated by cooling and compressing the gas stream, and once separated, the CO² is removed.

Other efforts at carbon capture include building urban structures with special facilities to extract CO² from the air. Examples of this include the Torre de Especialidades in Mexico City – a hospital that is surrounded by a 2500 m² facade composed of Prosolve370e. Designed by Berlin-based firm Elegant Embellishments, this specially-shaped facade is able to channel air through its lattices and relies on chemical processes to filter out smog.

China’s Phoenix Towers – a planned-project for a series of towers in Wuhan, China (which will also be the world’s tallest) – is also expected to be equipped with a carbon capture operation. As part of the designers vision of creating a building that is both impressively tall and sustainable, these include special coatings on the outside of the structures that will draw CO² out of the local city air.

Then there’s the idea for “artificial trees“, which was put forward by Professor Klaus Lackner of the Department of Earth and Environmental Engineering at Columbia University. Consisting of plastic fronds that are coated with a resin that contains sodium carbonation – which when combined with carbon dioxide creates sodium bicarbonate (aka. baking soda) – these “trees” consume CO² in much the same way real trees do.

A cost-effective version of the same technology used to scrub CO² from air in submarines and space shuttles, the fronds are then cleaned using water which, when combined with the sodium bicarbonate, yields a solution that can easily be converted into biofuel.

In all cases, the process of Carbon Capture comes down to finding ways to remove harmful pollutants from the air to reduce humanity’s footprint. Storage and reuse also enter into the equation in the hopes of giving researchers more time to develop alternative energy sources.

We have written many interesting articles about carbon capture here at Universe Today. Here’s What is Carbon Dioxide?, What Causes Air Pollution?, What if we Burn Everything?, Global Warming Watch: How Carbon Dioxide Bleeds Across The Earth, and World Needs to Aim for Near-Zero Carbon Emissions.

For more information on how Carbon Capture works, be sure to check out this video from the Carbon Capture and Storage Organization:

If you’d like more info on Earth, check out NASA’s Solar System Exploration Guide on Earth. And here’s a link to NASA’s Earth Observatory.

We’ve also have Astronomy Cast episodes all about planet Earth and Climate Change. Listen here, Episode 51: Earth, Episode 308: Climate Change.

Sources:

What is a Flying Wing?

X-47B conducting a midair refueling run in the Atlantic Test Ranges. Credit: US Navy

The field of aviation has produced some interesting designs over the course of its century-long history. In addition to monoplanes, jet-aircraft, rocket-propelled planes, and high-altitude interceptors and spy craft, there is also the variety of airplanes that do away with such things as tails, sections and fuselages. These are what is known as Flying Wings, a type of fixed-wing aircraft that consists of a single wing.

While this concept has been investigated for almost as long as flying machines have existed, it is only within the past few decades that its true potential has been realized. And when it comes to the future of aerospace, it is one concept that is expected to see a great deal more in the way of research and development.

Description:

By definition, a flying wing is an aircraft which has no definite fuselage, with most of the crew, payload and equipment being housed inside the main wing structure. From the top, a flying wing looks like a chevron, with the wings constituting its outer edges and the front middle serving as the cockpit or pilot’s seat. They come in many varieties, ranging from the jet fighter/bomber to hand gliders and sailplanes.

A clean flying wing is theoretically the most aerodynamically efficient (lowest drag) design configuration for a fixed wing aircraft. It also offers high structural efficiency for a given wing depth, leading to light weight and high fuel efficiency.

A Junkers G 38, in service with Lufthansa. Credit: SDASM Archives

History of Development:

Tailless craft have been around since the time of the Wright Brothers. But it was not until after World War I, thanks to extensive wartime developments with monoplanes, that a craft with no true fuselage became feasible. An early enthusiast was Hugo Junkers who patented the idea for a wing-only air transport in 1910.

Unfortunately, restrictions imposed by the Treaty of Versailles on German aviation meant that his vision wasn’t realized until 1931 with the Junker’s G38. This design, though revolutionary, still required a short fuselage and a tail section in order to be aerodynamically possible.

A restored Horten Ho 229 at Steven F. Udvar-Hazy Center. Credits: Cynrik de Decker

Flying wing designs were experimented with extensively in the 30’s and 40’s, especially in the US and Germany. In France, Britain and the US, many designs were produced, though most were gliders. However, there were exceptions, like the Northrop N1M, a prototype all-wing plane and the far more impressive Horten Ho 229, the first jet-powered flying wing that served as a fighter/bomber for the German air force in WWII.

This aircraft was part of a long series of experimental aircraft produced by Nazi Germany, and was also the first craft to incorporate technology that made it harder to detect on radar – aka. Stealth technology. However, whether this was intentional or an unintended consequence of its design remains the subject of speculation.

After WWII, this plane inspired several generations of experimental aircraft. The most notable of these are the YB-49 long-range bomber, the A-12 Avenger II, the B-2 Stealth Bomber (otherwise known as the Spirit), and a host of delta-winged aircraft, such as Canada’s own Avro-105, also known as the Avro Arrow.

Recent Developments:

More recent examples of aircraft that incorporate the flying wing design include the X-47B, a demonstration unmanned combat air vehicle (UCAV) currently in development by Northrop Grumman. Designed for carrier-based operations, the X-47B is a result of collaboration between the Defense Advanced Research Projects Agency (DARPA) and the US Navy’s Unmanned Combat Air System Demonstration (UCAS-D) program.

The X-47B first flew in 2011, and as of 2015, its two active demonstrators successfully performed a series of airstrip and carrier-based landings. Eventually, Northrop Grumman hopes to develop the prototype X-47B into a battlefield-ready aircraft known the Unmanned Carrier-Launched Airborne Surveillance and Strike (UCLASS) system, which is expected to enter service in the 2020s.

Another take on the concept comes in the form of the bidirectional flying wing. This type of design consists of a long-span, low speed wing and a short-span, high speed wing joined in a single airframe in the shape of an uneven cross. The proposed craft would take off and land with the low-speed wing across the airflow, then rotate a quarter-turn so that the high-speed wing faces the airflow for supersonic travel.

The design is claimed to feature low wave drag, high subsonic efficiency and little or no sonic boom. The low-speed wings have likely a thick, rounded airfoil able to contain the payload and a wide span for high efficiency, while the high-speed wing would have a thin, sharp-edged airfoil and a shorter span for low drag at supersonic speed.

In 2012, NASA announced that it was in the process of funding the development of such a concept, known as the Supersonic Bi-Directional Flying Wing (SBiDir-FW). This came in the form of the Office of the Chief Technologist awarding a grant of $100,000 to a research group at the University of Miami (led by Professor Gecheng Zha) who were already working on such a plane.

Since the Wright Brothers first took to the air in a plane made of canvas and wood over a century ago, aeronautical engineers have thought long and hard about how we can improve upon the science of flight. Every once in awhile, there are those who will attempt to “reinvent the wheel”, throwing out the old paradigm and producing something truly revolutionary.

We have written many articles about the Flying Wing for Universe Today. Here’s an article about the testing of the prototype blended wing aircraft, and here are some jet pictures.

If you’d like more information on NASA’s aircraft programs, check out NASA’s Dryden photo collection, and here’s a link to various NASA research aircraft.

We’ve also recorded many related episodes of Astronomy Cast. Listen here, Episode 100: Rockets.

Sources:

Who was the First Dog to go into Space?

Animals in Space
Laika before launch in 1957 (AP Photo/NASA)

Before man ever set foot on the moon or achieved the dream of breaking the Earth’s gravity and going into space, a dog did it first! Really, a dog? Well… yes, if the topic is the first animal to go into space, then it was a dog that beat man to the punch by about four years. The dog’s name was Laika, a member (after a fashion) of the Russian cosmonaut program. She was the first animal to go into space, to orbit the Earth, and, as an added – though dubious – honor, was also the first animal to die in space. Laika’s sacrifice paved the way for human spaceflight and also taught the Russians a few things about what would be needed in order for a human to survive a spaceflight.

Part of the Sputnik program, Laika’s was launched with the Sputnik 2 craft, the second spacecraft launched into Earth orbit. The satellite contained two cabins, one for its “crew”, the other for its various scientific instruments, which included radio transmitters, a telemetry system, temperature controls for the cabin, a programming unit, and two photometers for measuring solar radiation (ultraviolent and x-ray emissions) and cosmic rays. Like Sputnik 1, the satellite’s launch vehicle the R-7 Semyorka rocket, a ballistic missile that was responsible for placing the satellite into the upper atmosphere.

The mission began on November 3rd, 1957 and lasted 162 days before the orbit finally decayed and it fell back to Earth. No provisions were made for getting Laika safely back to Earth so it was expected ahead of time that she would die after ten days. However, it is now known that Laika died within a matter of hours after deployment from the R-7. At the time, the Soviet Union said she died painlessly while in orbit. More recent evidence however, suggests that she died as a result of overheating and panic. This was due to a series of technical problems which resulted from a botched deployment. The first was the damage that was done to the thermal system during separation, the second was some of the satellite’s thermal insulation being torn loose. As a result of these two mishaps, temperatures in the cabin reached over 40º C.

In spite of her untimely death, Laika’s flight astonished the world and outraged many animal rights activists. Her accomplishment was honored by many countries through a series of commemorative stamps. The mission itself also taught the Russians a great deal about the behavior of a living organism in space and brought back data about Earth’s outer radiation belt, which would be the subject of interests for future missions.

We have written many articles about Laika for Universe Today. Here’s an article about the first animal in space, and here’s an article about Russia sending monkeys to Mars.

If you’d like more info on Laika, check out NASA’s Imagine the Universe Article about Laika, and here’s a link to The First Dog in Space Article.

We’ve also recorded an entire episode of Astronomy Cast all about the Space Capsules. Listen here, Episode 124: Space Capsules, Part 1 – Vostok, Mercury and Gemini.

Sources:
http://en.wikipedia.org/wiki/Laika
http://en.wikipedia.org/wiki/Soviet_space_dogs
http://news.bbc.co.uk/2/hi/sci/tech/2367681.stm
http://starchild.gsfc.nasa.gov/docs/StarChild/space_level2/laika.html
http://en.wikipedia.org/wiki/Sputnik_program
http://en.wikipedia.org/wiki/R-7_rocket
http://en.wikipedia.org/wiki/Sputnik_2
http://en.wikipedia.org/wiki/Van_Allen_radiation_belt

What is Carbon Dioxide?

Carbon cycle diagram.

CO2 is more than just the stuff that comes out of smokestacks, tailpipes, cigarettes and campfires. It is also a crucial element here on planet Earth, essential to life and its processes. It is used by plants to make sugars during photosynthesis. It is emitted by all animals, as well as some plants, fungi and microorganisms, during respiration. It is used by any organism that relies either directly or indirectly on plants for food; hence, it is a major component of the Carbon Cycle. It is also a major greenhouse gas, hence why it is so closely associated with Climate Change.

Joseph Black, a Scottish chemist and physician, was the first to identify carbon dioxide in the 1750s. He did so by heating calcium carbonate (limestone) with heat and acids, the result of which was the release of a gas that was denser than normal air and did not support flame or animal life. He also observed that it could be injected into calcium hydroxide (a liquid solution of lime) to produce Calcium Carbonate. Then, in 1772, another chemist named Joseph Priestley came up with of combining CO2 and water, thus inventing soda water. He was also intrinsic in coming up with the concept of the Carbon Cycle.

Since that time, our understanding of CO2 and its importance as both a greenhouse gas and an integral part of the Carbon Cycle has grown exponentially. For example, we’ve come to understand that atmospheric concentrations of CO2 fluctuate slightly with the change of the seasons, driven primarily by seasonal plant growth in the Northern Hemisphere. Concentrations of carbon dioxide fall during the northern spring and summer as plants consume the gas, and rise during the northern autumn and winter as plants go dormant, die and decay.

Traditionally, atmospheric CO2 levels were dependent on the respirations of animals, plants and microorganisms (as well as natural phenomena like volcanoes, geothermal processes, and forest fires). However, human activity has since come to be the major mitigating factor. The use of fossil fuels has been the major producer of CO2 since the Industrial Revolution. By relying increasingly on fossil fuels for transportation, heating, and manufacturing, we are threatening to offset the natural balance of CO2 in the atmosphere, water and soil, which in turn is having observable and escalating consequences for our environment. As is the process of deforestation which deprives the Earth of one it’s most important CO2 consumers and another important link in the Carbon Cycle.

As of April 2010, CO2 in the Earth’s atmosphere is at a concentration of 391 parts per million (ppm) by volume. For an illustrated breakdown of CO2 emissions per capita per country, click here.

We have written many articles about Carbon Dioxide for Universe Today. Here’s an article about the Carbon Cycle Diagram, and here’s an article about Greenhouse Effect.

If you’d like more info on Carbon Dioxide, check out NASA’s The Global Climate Change. And here’s a link to The Carbon Cycle.

We’ve also recorded an episode of Astronomy Cast all about planet Earth. Listen here, Episode 51: Earth.

Sources:
http://en.wikipedia.org/wiki/Carbon_dioxide
http://en.wikipedia.org/wiki/Carbon_cycle
http://www.eoearth.org/article/carbon_dioxide
http://cdiac.ornl.gov/
http://www.epa.gov/climatechange/emission/co2.html
http://www.lenntech.com/carbon-dioxide.htm
http://www.davidsuzuki.org/issues/climate-change/science/climate-change-basics/climate-change-101-1/

What is Boyle’s Law

Boyle's Law
Boyle's Law Credit: NASA's Glenn Research Center

It is interesting to think that at this very moment all of us, every living terrestrial organism, are living in a state of pressure. We normally don’t feel it the human body is primarily made up of liquid, and liquids are basically non compressible. At times, however, we do notice changes of pressure, primarily in our ears. This is often described as a “pop” and it occurs when our elevation changes, like when we fly or driving in the mountains. This is because our ears have an air space in them, and air, like all other gases, is compressible.

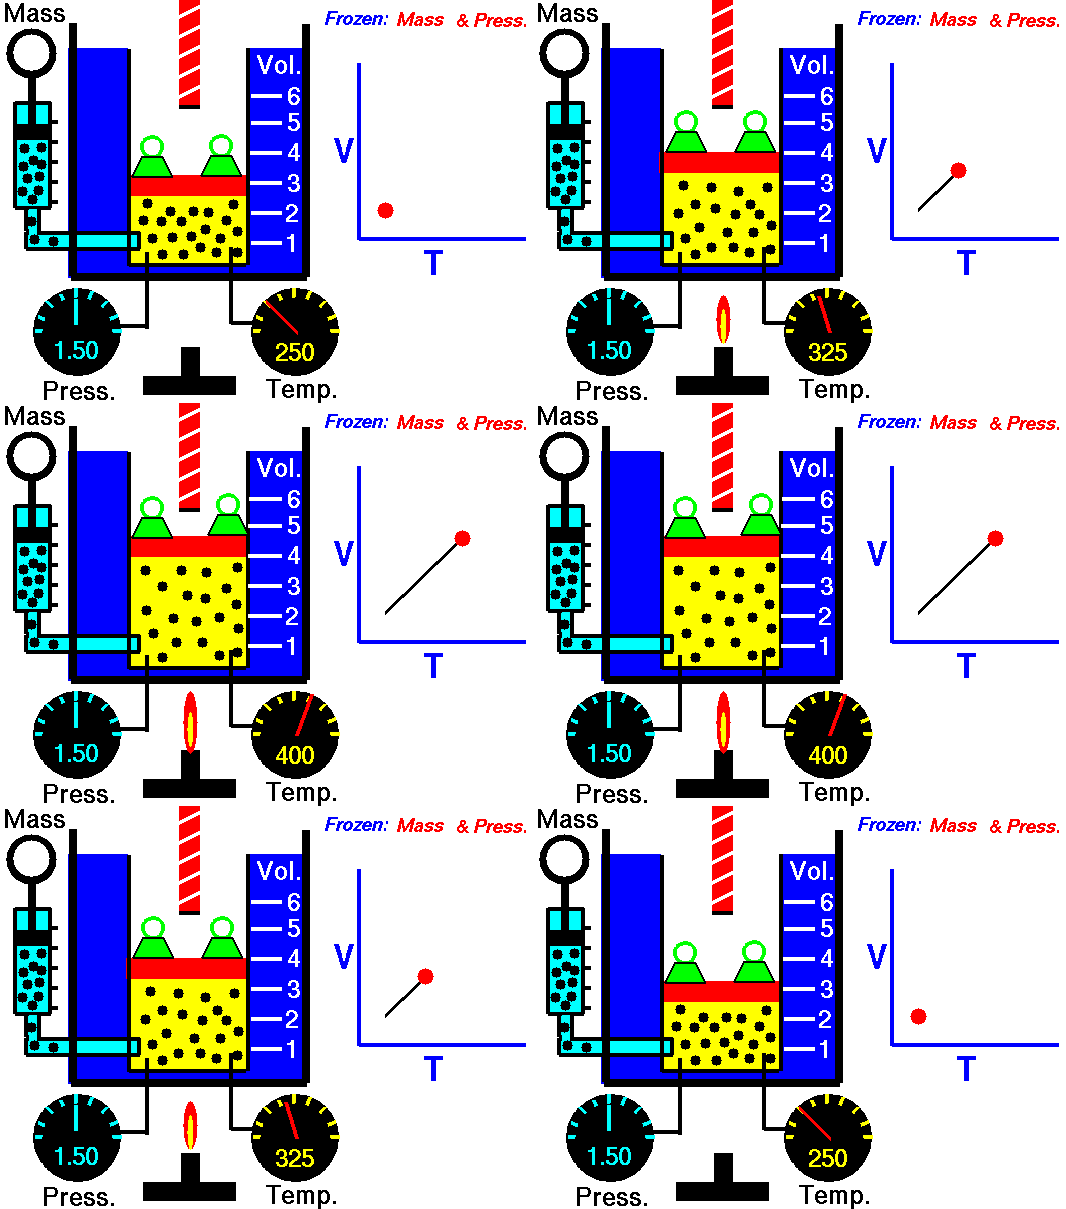
Robert Boyle was one of the first people to study this phenomena in 1662. He formalized his findings into what is now called Boyle’s law, which states that “If the temperature remains constant, the volume of a given mass of gas is inversely proportional to the absolute pressure” Essentially, what Boyle was saying is that an ideal gas will compress proportionately to the amount of pressure exerted on it. For example, if you have a 1 cubic meter balloon and double the pressure on it, it will be compressed to ½ a cubic meter. Increase the pressure by 4, and the volume will drop to 1/4 of its original size, and so on.

The law can also be stated in a slightly different manner, that the product of absolute pressure (p) and volume (V) is always constant (k); p x V = k, for short. While Boyle derived the law solely on experimental grounds, the law can also be derived theoretically based on the presumed existence of atoms and molecules and assumptions about motion and that all matter is made up of a large number of small particles (atoms or molecules) all of which are in constant, motion. These rapidly moving particles constantly collide with each other and with the walls of their container (also known as the kinetic theory).

Another example of Boyle’s law in action is in a syringe. In a syringe, the volume of a fixed amount of gas is increased by drawing the handle back, thereby lessening the pressure. The blood in a vein has higher pressure than the gas in the syringe, so it flows into the syringe, equalizing the pressure differential. Boyle’s law is one of three gas laws which describe the behavior of gases under varying temperatures, pressures and volumes. The other two laws are Gay-Lussac’s law and Graham’s law. Together, they form the ideal gas law.

For an animated demonstration of Boyle’s Law, click here.

We have written many articles about Boyle’s Law for Universe Today. Here’s an article about air density, and here’s an article about the Boltzmann Constant.

If you’d like more info on Boyle’s Law, check out NASA’s Boyle’s Law Page, and here’s a link to the Boyle’s Law Lesson.

We’ve also recorded an episode of Astronomy Cast. Listen here, Question Show: The Source of Atmospheres, The Vanishing Moon and A Glow After Sunset.

Sources:
http://en.wikipedia.org/wiki/Boyle%27s_law
http://en.wikipedia.org/wiki/Ideal_gas
http://www.chm.davidson.edu/vce/gaslaws/boyleslaw.html
http://home.flash.net/~table/gasses/boyle1.htm
http://www.wisegeek.com/what-is-boyles-law.htm
http://www.grc.nasa.gov/WWW/K-12/airplane/boyle.html

Atomic number

Fine Structure Constant

[/caption]

Ever wonder why the periodic table of elements is organized the way it is? Why, for example, does Hydrogen come first? And just what are these numbers that are used to sort them all? They are known as the element’s atomic number, and in the periodic table of elements, the atomic number of an element is the same as the number of protons contained within its nucleus. For example, Hydrogen atoms, which have one proton in their nucleuses, are given an atomic number of one. All carbon atoms contain six protons and therefore have an atomic number of 6. Oxygen atoms contain 8 protons and have an atomic number of 8, and so on. The atomic number of an element never changes, meaning that the number of protons in the nucleus of every atom in an element is always the same.

Arranging elements based on their atomic weight began with Ernest Rutherford in 1911. It was he who first suggested the model for an atom where the majority of its mass and positive charge was contained in a core. This central charge would be roughly equal to half of the atoms total atomic weight. Antonius van den Broek added to this by formerly suggesting that the central charge and number of electrons were equal. Two years later, Henry Moseley and Niels Bohr made further contributions that helped to confirm this. The Bohr model of the atom had the central charge contained in its core, with its electrons circulating it in orbit, much like how the planet in the solar system orbit the sun. Moseley was able to confirm these two hypotheses through experimentation, measuring the wavelengths of photon transitions of various elements while they were inside an x-ray tube. Working with elements from aluminum (which has an atomic number thirteen) to gold (seventy nine), he was able to show that the frequency of these transitions increased with each element studied.

In short, the higher the atomic number (aka. the higher the number of protons), the heavier the element is and the lower it appears on the periodic table. The atomic number of an element is conventionally represented by the symbol Z in physics and chemistry. This is presumably derived from the German word Atomzahl, which means atomic number in English. It is not to be confused with the mass number, which is represented by A. This corresponds to the combined mass of protons and neutrons in the element.

We have written many articles about the atomic number for Universe Today. Here’s an article about the atomic nucleus, and here’s an article about the Atom Models.

If you’d like more info on the Atomic Number, check out NASA’s Atoms and Light Energy Page, and here’s a link to NASA’s Atomic Numbers and Multiplying Factors Page.

We’ve also recorded an entire episode of Astronomy Cast all about the Atom. Listen here, Episode 164: Inside the Atom.

Sources:
NDT Resource Center
Jefferson Lab
Wise Geek
Wiki Answers