Dusty Disk Evidence of Planetary Collision

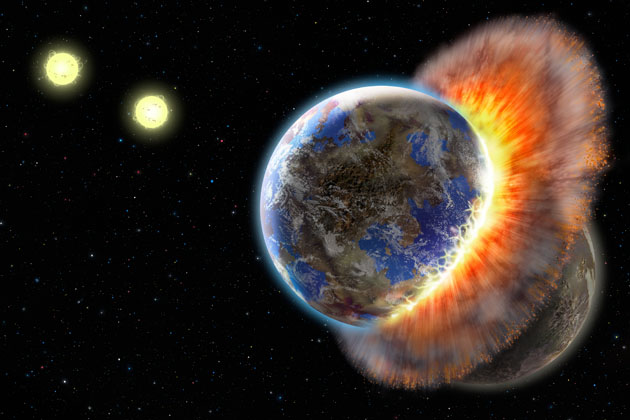
Exoplanet collision in BD+20 301. Possibly an Earth-like rocky exoplanet was involved? (Lynette Cook)

[/caption]

What astronomers had expected to be a run-of-the-mill protoplanetary disk turned out to be evidence of a much more intriguing story. While observing the sun-like star BD 20 307, a team of astronomers noticed a large disk of dust surrounding the star. Usually, this is evidence of planetary formation around younger stars. The 8 planets (and plutoids…) in our own solar system formed out of just such a disk. Disks like this aren’t generally found around older stars, though, and when the age of the star was calculated to be several billion years old, the source of the dust appears to come from a rare event: it is the resulting debris of two planets slamming into each other.

Using data from the Chandra X-ray Observatory, and taking the brightness using one of Tennessee State University’s automated telescopes in Arizona, the team first discovered BD 20 307 to in fact be part of a close binary pair. Not only that, but the system was much older than previously thought: several billions of years old, rather than a few hundred million. The system is 300 light-years away from Earth in the constellation Ares.

The curiously large amount of dust orbiting BD 20 307 is 1 million times the amount of dust than is found in our own solar system, and orbits at a distance from the star that is similar to the orbits of Earth and Venus around our own Sun. The abundance of dust particles in this orbit – and around such a mature star – led scientists to the conclusion that it was created by the violent collision of two exoplanets.

Benjamin Zuckerman, UCLA professor of physics and astronomy and co-author of a paper on the discovery said, “It’s as if Earth and Venus collided with each other. Astronomers have never seen anything like this before. Apparently, major catastrophic collisions can take place in a fully mature planetary system.” Zuckerman and his team will report their findings in the December issue of the Astrophysical Journal.

Normally, warm disks of dust surround younger star systems, out of which larger and larger structures can form, eventually yielding planets. To find a disk of dust in around a star that is several billions of years old is odd, because the pressure of stellar radiation pushes out the lighter dust over time, and the larger chunks either form planets and asteroids, or break down in collisions and get blown away.

The collision between the planets took place within the past few hundred thousand years, though it is possible that it happened even more recently. Such a colossal collision raises the question of how the orbits of the two planets became destabilized, and whether such a collision could happen in our own solar system.

“The stability of planetary orbits in our own solar system has been considered for nearly two decades by astronomer Jacques Laskar in France and, more recently, by Konstantin Batygin and Greg Laughlin in the U.S.A. Their computer models predict planetary motions into the distant future and they find a small probability for collisions of Mercury with Earth or Venus sometime in the next billion years or more. The small probability of this happening may be related to the rarity of very dusty planetary systems like BD+20 307,” said paper co-author Gregory Henry, astronomer at Tennessee State University (TSU).

Source: EurekAlert

Rosetta Begins Tracking Asteroid Steins for Flyby

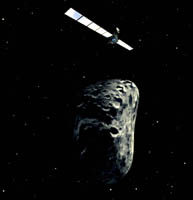
Artist's impression of Rosetta doing an asteroid flyby (ESA).

[/caption]

Since waking up in early July from a brief hibernation, the Rosetta space probe has passed yet another milestone on the long journey to its rendezvous with the comet 67/P Churyumov-Gerasimenko in 2014: it has begun tracking the asteroid (2867) Steins. The spacecraft will perform a close flyby of the asteroid on September 5th, 2008, and will spend the next month taking images and science data.

Steins will remain a dot in the sky to the probe for quite a while, but these preliminary images will allow the spacecraft to get a better handle on the orbit of the asteroid, as well as its rotational period. Using the Optical, Spectroscopic, and Infrared Remote Imaging System (OSIRIS) camera, it will image the asteroid twice a week until the 25th of August, and then will take daily images until the planned flyby on September 5th. Rosetta will pass within 800 km (500 miles) of the asteroid, imaging and taking data at the relatively slow speed of 8.6 km/second (5.3 miles/second).

The trajectory of Steins has already been established from ground-based observations, but the imaging leading up to the flyby will help to optimize the trajectory of the spacecraft. The location of the asteroid is known to within 100 km presently, but the work Rosetta will be doing will narrow that down to 2 km.

“As Rosetta’s distance from Steins decreases, the precision of the measurements for Steins’ orbit will increase even further, allowing us the best possible trajectory corrections later on before closest approach, especially in early September,” said Sylvain Lodiot, from the Rosetta Flight Control Team at the European Space Operations Centre.

During the flyby of Steins, Rosetta will study the physical and chemical properties of the asteroid. It will also provide scientists with a detailed look into the kinematic properties (how fast it is spinning), and how the asteroid interacts with the solar wind. Being so close to Stein will give Rosetta a chance to analyze any satellites of the asteroid, as well as the gas and dust in the near vicinity.

Rosetta launched in March 2004, and is taking a roundabout way to get to the final destination of comet 67/P Churyumov-Gerasimenko. It has passed by the Earth twice – once in March 2005, and once again in February 2007 – with another flyby scheduled for November 2009. While doing the most recent flyby it took this spectacular image of the Earth at night with the OSIRIS camera. The lighted regions are populated areas on continents in the Northern Hemisphere.The Earth at night as seen by Rosetta (ESA).

Earth isn’t the only celestial body that the spacecraft has visited, though. It passed within 1,000 km (620 miles) of Mars in Februrary 2007, and will perform a flyby of the asteroid 21 Lutetia in 2010. This game of planetary billiards is meant to adjust the trajectory of the spacecraft, and the imaging done on the Earth, Mars and the asteroids helps the science team work out all of the bugs in the host of science instruments on board.

Once it has arrived at 67/P Churyumov-Gerasimenko, it will deploy a lander, named Philae, which will drill into the comet to study for the first time ever the compositional nature of a comet. Rosetta will orbit the comet, following it around the Sun.

If you want to keep tabs on the progress of the Rosetta mission, the ESA has a flash animation tool that allows you to zoom in on any part of the mission.

Source: ESA Press Release

X-Ray Satellite Discovers Overlooked Nova

Novae are kind of a big deal in the Universe, so you’d think that when one occurred we would notice, especially if it were visible to the naked eye. A star that exploded in June of 2007 in the constellation of Puppis, though, slipped by the network of professional and amateur astronomers that are dedicated to watching the skies for novel stars. Luckily, the orbiting X-ray telescope XMM-Newton just happened to be observing the area, and discovered the nova that everyone else had missed.

The satellite XMM-Newton is creating a survey of X-ray sources in the Universe, and on October 9, 2007 while turning from one target to another, it passed over a bright source of X-rays that was unexpected. The science team checked over their catalog of previously known X-ray sources in the area, but the only object with that location was the faint star USNO-A2.0 0450-03360039.

Andy Read of the University of Leicester and Richard Saxton of ESA’s European Space Astronomy Centre (ESAC), Spain quickly alerted other astronomers of the finding via the internet. Astronomers at the Magellan-Clay telescope at Las Campanas Observatory in Chile used their 6.5 meter telescope to analyze the light coming from the star and found that it had brightened by more than a factor of 600.

Saxton contacted the All-Sky Automated Survey, an automated survey of millions of stars, and found that the star went nova on June 5th, 2007. The nova has been given the shorter name of V598 Puppis, and had anyone been looking closely – even with the naked eye – at the constellation of Puppis on June 5th of 2007, they would have noticed the star brighten.

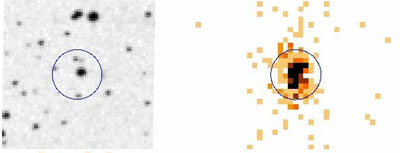
The image here shows V598 Puppis in the visible spectrum on the left, and in the X-ray on the right.

Novae of this type occur when a white dwarf, which is a smaller and more compact star, consumes material from a companion star, puffing it up. The nuclear processes in the star begin a runaway reaction after a certain amount of material is consumed, and it explodes violently.

What is curious about the case of V598 Puppis is that X-rays are only released from a nova after visible light. The expanding cloud of dust and debris from the initial explosion blocks most of the X-rays from being released. In the case of most other novae and supernovae, the discovery is made by a visible light telescope, then followed up by telescopes in the other spectra.

Source: ESA Press Release

Canada to build World’s First Asteroid-hunting Satellite

Just yesterday (June 30th) was the 100-year anniversary of the Tunguska event, when a small piece of ice or rock exploded in the air near the Podkammenaya Tungus river in Siberia, flattening trees and scaring the heck out of people in the surrounding area. Thankfully, the blast didn’t happen in a populated area and nobody was killed, but there are many more pieces of debris floating around out there in space. If we want to do something about an asteroid headed our way, or keep astronauts safe from space debris, knowing is half the battle. Thanks to a new microsatellite being built by the Canadian Space Agency, we will soon have a better map of the objects surrounding the Earth’s orbit.

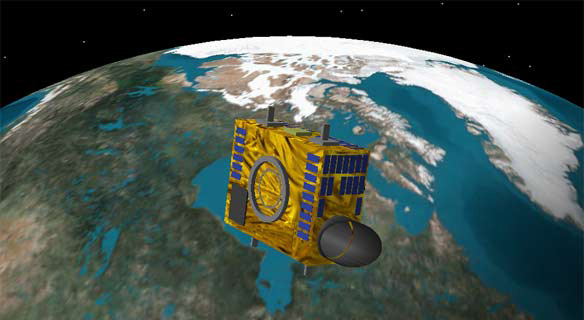
The Near Earth Object Surveillance Satellite (NEOSSat) is a small satellite, about the size of a suitcase and weighing 143 pounds (65 kilograms). This puts it in a class of satellites known as “microsatellites”. Canada has already launched a successful microsatellite mission – Microvariability and Oscillation of STars (MOST) – that measured the light oscillation of stars to determine their age.

NEOSSat will monitor asteroids, comets and space junk in near-Earth orbit – within 100 – 1240 miles (160 – 2000 km) – to create a detailed survey of objects close to the Earth. It will also track other satellites, such as geosynchronous satellites, which orbit further out at 22,400 miles (~36,000 km).

NEOSSat wont’ orbit the way many satellites do – around the equator of the Earth – but will rather follow a polar orbit, circling from pole to pole every 50 minutes. This allows it to observe near the Sun where asteroids that orbit uniquely inside the Earth’s orbit are to be found. It will use a sunshade to observe with 45 degrees of the Sun. The polar orbit also gives the spacecraft the ability to use parallax to determine the distance to asteroids, comets and debris

Because of its location outside the Earth’s atmosphere, NEOSSat can also be small – it will use only a 15cm (6 inch) telescope. The small size will make the satellite easy to pack in with another, larger satellite for launch, thus reducing the cost of the mission.

Satellites are much better at making observations because they don’t have to look through the Earth’s thick atmosphere. NEOSSat will provide a huge advantage in surveying the hundreds of thousands of objects surrounding the Earth.

Dr. Alan Hildebrand the Canada Research Chair in Planetary Science in the University of Calgary’s Department of Geoscience said,”NEOSSat being on-orbit will give us terrific skies for observing 24-hours a day, guaranteed. Keeping up with the amount of data streaming back to us will be a challenge, but it will provide us with an unprecedented view of space encompassing Earth’s orbit.”

The mission is funded by as a joint project between the Canadian Space Agency and Defense Research Development Canada.

Source: EurekAlert, NEOSSat

Dark Matter is Denser in the Solar System

Dark matter was theorized to exist relatively recently, and we’ve come a long way in understanding what makes up a whopping 23% of our Universe. Our own galaxy is surrounded by a halo of dark matter that adds to its mass. A recent paper on the dark matter closer to home – right here in our own Solar System – reveals that it is denser and more massive than in the galactic halo.

Dark matter is just plain weird stuff. It doesn’t give off light, has mass and reacts gravitationally with “normal” matter – the stuff that we and our planet and the stars are composed of. Just like normal matter, it “clumps” up, or accretes, because of this gravitational attraction; we find more dark matter near galaxies than in the vast expanses between them.

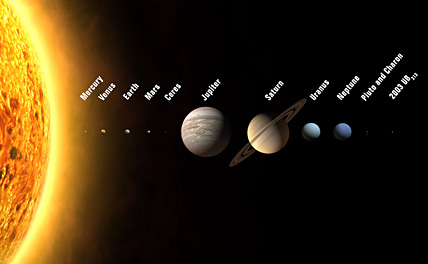
Dark matter isn’t just far off in the Milky Way or somewhere on the other side of the Universe, though: it’s right here at home in our Solar System. In a recent paper submitted to Physical Review D, Ethan Siegel and Xiaoying Xu of the University of Arizona analyzed the distribution of dark matter in our Solar System, and found that the mass of dark matter is 300 times more than that of the galactic halo average, and the density is 16,000 times higher than that of the background dark matter.

Over the history of the Solar System, Xu and Siegel calculate that 1.07 X 10^20 kg of dark matter have been captured, or about 0.0018% the mass of the Earth. To get a handle on this number, the mass of Ceres – the largest object in the asteroid belt between Mars and Jupiter – is about 9 times this amount.

Siegel and Xu calculated how much dark matter the Solar System has swept up over it’s 4.5 billion-year lifespan by modeling the composition of the background dark matter halo in the orbit of the Solar System around the galaxy, and calculating just how much dark matter would be trapped by the Solar System as it moves through this halo. They ran this calculation for the Sun and each one of the eight planets separately, giving the distribution of the matter throughout the Solar System, as well as the total amount captured.

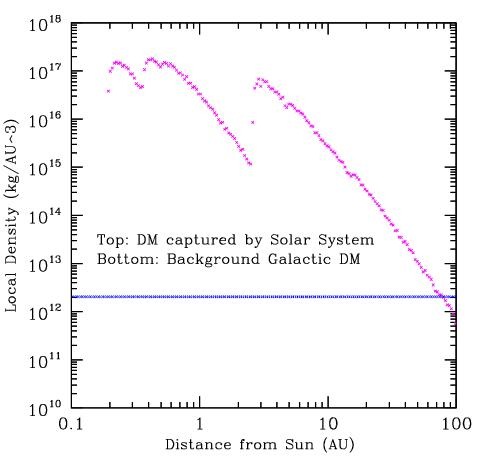
Much like when you drive your car through a light snowfall, dark matter “sticks” to the Solar System when it is gravitationally bound by the Sun and planets. Just as some of the snow melts on your windshield (hopefully), some doesn’t stick to the hood and most just flies right by, dark matter isn’t distributed evenly throughout our Solar System, either. Some planets have more dark matter surrounding them than others, depending on where they are. Shown below is the density distribution of the dark matter in the Solar System

The first spike is Mercury, and the next two spikes are Venus and Earth (Mars doesn’t show up). The next is Jupiter, followed by a small bump from Saturn and finally Uranus and Neptune combined create the last small bump.

How does the local dark matter effect interactions in the Solar System? Well,it doesn’t have a large effect on the orbits of the planets, nor does it slow down the Solar System in its orbit around the galactic center appreciably.

“Planetary orbits, if there were enough dark matter present, would have their perihelia precess faster than if there were no dark matter. The amount of dark matter allowed from these observations is considerably greater than the amount I predict. The errors on the measurements of perihelion precession are in units of hundredths of an arc second per century…Even if you assume the dark matter is at rest with respect to the galaxy that the Solar System moves through (which is the extreme example), the Sun is of order 10^30 kg; capturing a 10^20 kg clump of dark matter will slow you down by about 20 microns/second over the lifetime of the Solar System. So that would be small.” – Ethan Siegel in an email interview.

And, alas, the mystery of the Pioneer anomaly is not going to be solved by this revelation, as the mass of the captured dark matter is not enough to explain the odd motions of that spacecraft.

The discovery of a higher density and mass of dark matter in our neighborhood may aid in the study and detection of dark matter, though. Knowing the mass and density distribution of the local dark matter – and thus knowing how much and where to look for it – will provide astronomers looking into solving exactly what it’s made up of with more information .

“Our determination of the local dark matter density and velocity distribution are of great importance to direct detection experiments. The most recent calculations that have been carried out assume that the properties of dark matter at the Sun’s location are derived directly from the galactic halo. By comparison, we find that terrestrial experiments should also consider a component of dark matter with a density 16,000 times greater than the background halo density,” wrote Xu and Siegel.

Source: Arxiv, email interview with Ethan Siegel

Homer’s “Odyssey” May Chronicle Ancient Eclipse

It’s likely that sometime in your education career, an English teacher had you enjoy (or suffer through, depending on your tastes) at least part of that classic of classics, Homer’s Odyssey. It tells the story of Odysseus, a Greek general, who embarks on a 10-year journey back home after battling in the fall of Troy. The tale is filled with imagery that is referenced often in contemporary films and books. As old as it is, one would think that we’ve learned pretty much all we can from the book, but a new analysis of celestial events referenced in the Odyssey reveals that Homer may have documented a total solar eclipse.

Here’s a little background on the epic: Odysseus fights in the battle of Troy, which is believed to have occurred in approximately 1200 B.C. After the battle, he must find his way back to Ithaca in Greece, and the journey home is a harrowing one in which he is captured by the nymph Calypso, drifts on a raft at sea, battles a cyclops, resists the temptation of the Sirens and in general has hard luck. While he is away, his wife Penelope is living at his house with 108 suitors who are trying to convince her that she should accept her husband as dead and marry one of them.

Near the end of the story, a seer named Theoclymenus foretells the death of all the suitors, saying:

Poor men, what terror is this that overwhelms you so? Night shrouds your heads, your faces, down to your knees — cries of mourning are bursting into fire — cheeks rivering tears — the walls and the handsome crossbeams dripping dank with blood! Ghosts, look, thronging the entrance, thronging the court, go trooping down to the realm of death and darkness! The sun is blotted out of the sky — look there — a lethal mist spreads all across the Earth.

The reference to the Sun being blotted out of the sky on the day Odysseus returns home to retake his house and slaughter the suitors has been thought for a long time to be a reference to an actual eclipse, and was debated by astronomers, historians and classicists until it was finally decided that there was not enough evidence in the book to pinpoint a specific date for the event.

An analysis of overlooked passages in the book by Marcelo O. Magnasco, who heads the Laboratory of Mathematical Physics at Rockefeller, and Constantino Baikouzis of the Proyecto Observatorio at the Observatorio Astronómico in La Plata, Argentina reveals that there is enough evidence – if their interpretation of the events is correct – to place the eclipse on April 16th of 1178 B.C. Magnasco and Baikouzis reported their findings in this week’s Proceedings of the National Academy of Sciences.

There are four celestial clues in the Odyssey that individually happen rather often, but rarely coincide within a short period of time. As Odysseus is making his way home on a raft, he navigates by the use of the constellations Bootes and the Pleiades, which only appear together in the sky in March and September. The Moon is new when Odyesseus returns home, and on that day Venus rises before dawn, which only happens during one-third of new moons. The most important clue, though, is that Homer refers to the god Hermes flying west to the island of Ogygia about a month earlier. This reference is likely to the planet Mercury, which is low in the sky and experiences retrograde motion – seems to go backward in the sky relative to the stars – every 116 days.

Magnasco said, “Not only is this corroborative evidence that this date might be something important but if we take it as a given that the death of the suitors happened on this particular eclipse date, then everything else described in The Odyssey happens exactly as is described.”

Baikouzis and Magnasco analyzed all 1,684 new moons between 1250 and 1125 B.C. with commercial astronomy software for any dates that would match this confluence of events and came up with April 16th, 1178 B.C. Given that Homer matched the story to events in reality, this could help historians date the fall of Troy and shows that this great poet may also have had a penchant for astronomy.

Source: EurekAlert, Scientific American

Map of Milky Way Redrawn (again)

Just yesterday Fraser wrote about the Milky Way’s demotion from a 4-arm spiral galaxy to a 2-arm. This isn’t the only change we’ll have to accept about our home galaxy: a Milky Way mapping project has discovered stars in the galaxy moving slower and in more elliptical orbits than predicted. This means we might have to redraw the map we have of our own neighborhood yet again.

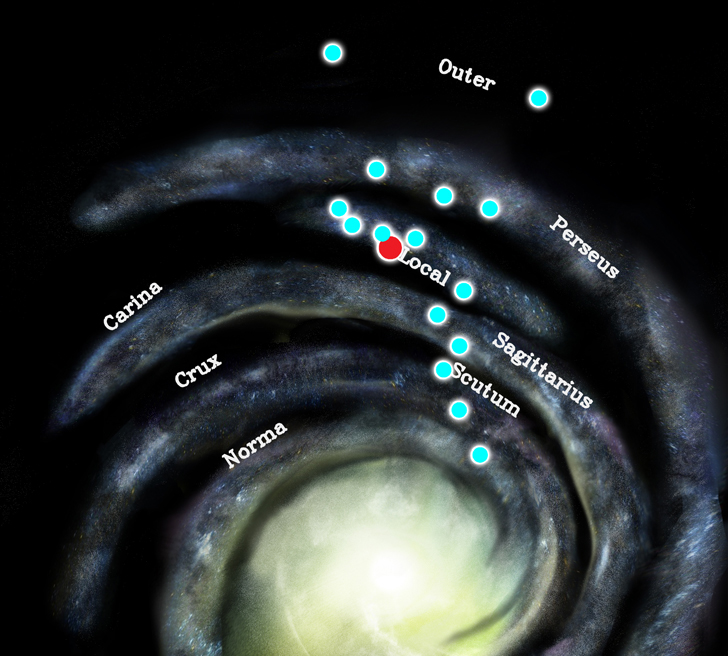
Astronomers using the Very Long Baseline Array (VLBA) – a collaboration of ten radio telescopes across the United States – tracked the positions of masers in a dozen star-forming regions in the Milky Way. They used parallax to determine the distance to the masers, then combined this information with how the masers shifted in the plane of the sky, giving a 3-dimensional model of their movement.

Drawing a map of the Milky Way is a challenging task, as we only have an edge-on view of the galaxy in which we reside. To top it off, it’s full of dust and gas that muck up the view in the visible light spectrum. Using the VLBA’s radio antennae, though, has made it possible to track radio-emitting bodies as they move across the sky because radio waves travel more easily through matter than does light. Since the VLBA functions as one huge telescope, it can track the position of stars with great accuracy.

“Right now, our map of the Milky Way still has large areas marked ‘Here there be dragons.’ Ten years from now, those areas will be filled in,” said Mark Reid, of the Harvard-Smithsonian Center for Astrophysics. Reid presented these findings at a press conference at the 212th American Astronomical Society meeting.

Instead of neatly circling the galactic center, the stars mapped by Reid and his colleagues are tracing an elliptical orbit. Previous maps of the Milky Way have assumed that the material in our galaxy orbits the center in a circular fashion, so stars that don’t follow this path come as somewhat of a surprise.

The stars are moving slower likely because of the loss of angular momentum when they interact gravitationally with other matter in the galaxy, traveling through what is called a ‘density wave’. The best description of a density wave I’ve run across has to be Phil Plait’s over at Bad Astronomy:

If you were in a helicopter over a traffic jam on the freeway, it would look like the jam is a permanent fixture of the traffic. But in reality, cars leave the jam at the same rate as cars entering it. So while the jam itself stays put, the cars making it up always change. So it is with spiral arms: they are places where the matter in the galaxy is compressed, but stars enter the jam and stars leave. The arm looks permanent, but over time its resident stars, gas, and dust change

This probably won’t be the last time the map of the Milky Way gets edited. The European Space Agency’s Gaia satellite is set to launch in 2011, and will provide a 3-dimensional map of 1 billion stars located as far as 30,000 light-years away from Earth.

Source: CfA Press Release

Over 100 Explosions Observed on the Moon

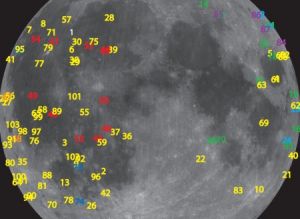
In the past two and a half years, the Moon has taken a real beating. NASA astronomers have observed over a hundred explosions on the Moon during this time, caused by meteoroids both large and small, slamming into the Moon at speeds of up to 160,000 miles per hour (257,495 kilometers per hour).

The Moon gets pelted constantly – over a metric ton of material falls on the Moon every day! Most impacts are too dim to see with the naked eye because they are small micrometeorites. The rate of the flashes from larger impacts increases dramatically – up to an impact every hour – during meteor showers such as the Perseids and Quadrantids. The sporadic impacts account for twice as many observable events as compared to meteor shower impacts.

If you were standing on the Moon, you wouldn’t see these impacts as “shooting stars,” though, since there is no atmosphere in which they can burn up. The explosion is also not something like one would see here on Earth, as the absence of oxygen doesn’t allow for any combustion. The kinetic energy of the impact heats up the rocks on the surface to the point where they become molten, and glow for a short period after the impact.

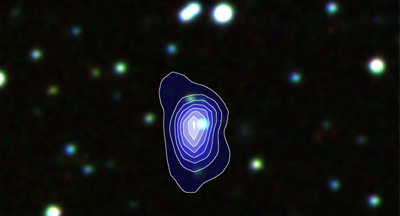
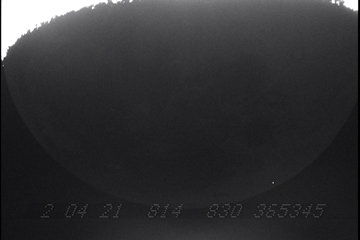
Pictured left is the flash from a confirmed impact on March 13th, 2008, as captured by amateur astronomer George Varros. The small white point in the bottom right of the picture is where the impact occurred. He has an animation of the event on his site.

Monitoring the number of impacts on the Moon is important for future missions to visit our smaller neighbor, as well as for the eventual establishment of a Moon base. It will be important to know when astronauts should take cover from potential strikes during peak periods of impacts. After all, even a small meteoroid traveling between 4500 mph (7,242 kph) and 160,000 mph (257, 495) could do a lot of damage to a space suit or lunar base. A typical blast that can be seen with a backyard telescope from Earth is equivalent to a few hundred pounds of TNT. I know I wouldn’t want to go for a Moon walk during a meteor shower…

NASA has been observing lunar impacts with one 14-inch (36 cm) telescope and one 20-inch (51 cm) located at the Marshall Space Flight Center in Alabama, and one 14-inch telescope located in Georgia.

But it’s not just NASA that can see these lunar fireworks: NASA’s Meteoroid Environment Office has called for amateur astronomers to help in recording and confirming these flashes. If you have a lot of patience, a telescope and a way to record the flashes, check out their site to get started.

Source: Physorg, NASA

Galaxy Zoo Gets a Makeover

In the near future, Galaxy Zoo will get a facelift. The project – which has already classified a large portion of the Sloan Digital Sky Survey – will be moving to its second phase, and members will be helping the science community get better information on the formation and distribution of galaxies.

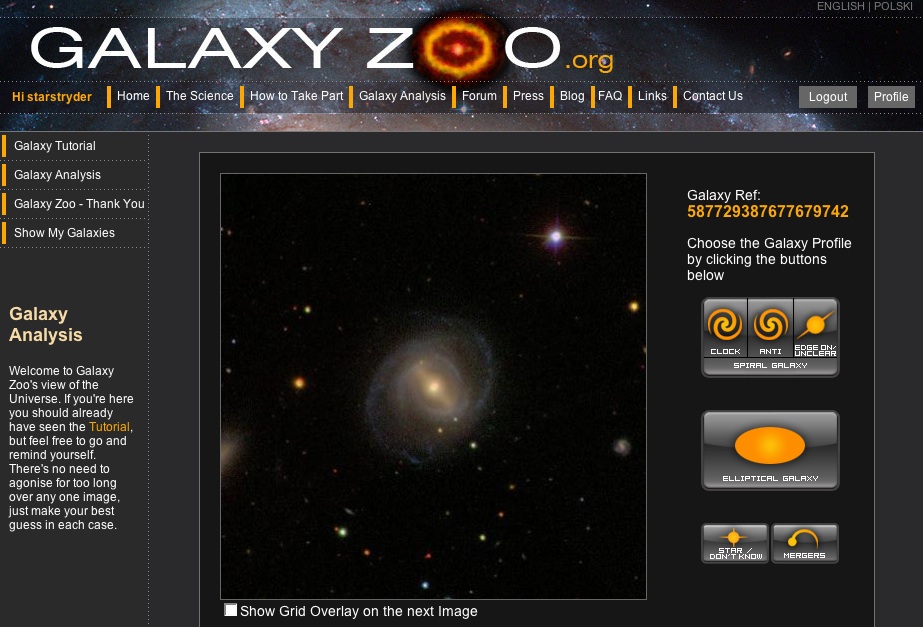
In the first phase, the science team wanted to make the task as simple as possible: is the galaxy you see an elliptical or spiral galaxy, and if it’s spiral, which way is it turning (clockwise or counter-clockwise)? As we reported the first results published using the Galaxy Zoo data showed that people have a bias for clicking on counter-clockwise images.

Galaxy Zoo 2.0 will probe more deeply some of the best classified images of the first stage. “The experience will be a bit different. Users will be asked a series of more detailed questions, and based on their answers they will be lead to answer different questions…One of the things we will incorporate is how to get people to answer the questions in a way that is interesting for them” said Chris Lintott a member of the Galaxy Zoo team and a post-doctoral researcher in the Department of Physics at the University of Oxford.

The more detailed questions will focus on a few hundred thousand of the million galaxies used in the first phase. The researchers want users to answer questions such as where on the Hubble Diagram a galaxy is, how many spiral arms it has or how close together are the spiral arms are.

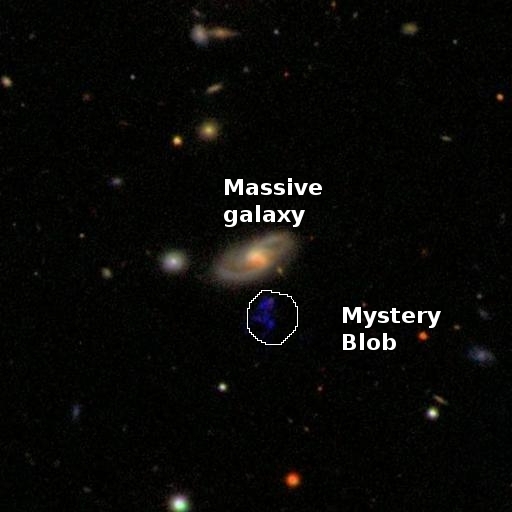
Galaxy Zoo 2.0 will also improve upon the ability for people to point out unusual galaxies or objects, including them even more in the science behind the project. The “poster child” of interesting objects from the site is Hanny’s Voorwerp (pictured).

It popped up as an unusual object in the forums, and the science team has since gotten time on the Swift and SARA telescopes for observation. The object turned out to be a ‘light echo’ from a long-dead quasar. More information (and pictures) can be found here and here.

From April 25th-29th, part of the science team will be observing a few of the over 500 overlapping galaxies pointed out by Galaxy Zoo members, using the 3.5-meter WIYN telescope at Kitt Peak, Arizona. Overlapping galaxies provide astronomers with a chance to study the interstellar dust in each galaxy, which aids in understanding how galaxies evolve.

“The new GZ will make it easier for people to point out what they think is interesting…One thing that the users are going to probably have the most fun with is a button that basically says, ‘Hey, somebody should look at this,'” Lintott said.

After they had asked users in the first few weeks of the project to email them with interesting finds – like ring galaxies, which they had thought were rare, but turned out to be rather abundant – the team received a barrage of emails. The new function for picking out interesting finds should streamline the process, making a shorter turnaround for observations of objects such as the Voorwerp.

“I like to compare Galaxy Zoo one to eating a bag of crisps. You start by eating one and then soon enough you’ve finished the whole bag. Galaxy Zoo two is like eating Michelin starred food: you want to spend time considering it and thinking about it and wondering about what is going on,” Lintott said.

The site will be connected to the Sloan Digital Sky Survey – a robotic survey of 1/4 of the Northern sky, where the images on the site originate – so people can go there and check out the objects in more detailif they would like.

Harnessing the power of 125,000 registered users and counting, the site has become a powerful (and popular!) tool for classification. There are currently over 20 projects underway using the Galaxy Zoo data. Galaxy Zoo 3.0 is already in the planning stages, and will likely include a look at more sky surveys, such as the upcoming Pan-STARRS.

“People looking at the data should become something that happens to astronomy surveys, more as a matter of course. Some human beings should look at it, or we’ll never find things like the Voorwerp and overlapping galaxies. Things like Galaxy Zoo let people play a part in the science,” remarked Lintott.

Source: Interview with Chris Lintott, Galaxy Zoo Blog

Galaxy Zoo Results Show that the Universe Isn’t ‘Lopsided’

getjpeg.thumbnail.jpg

In July of last year, the doors of the online galaxy classification site Galaxy Zoo opened for business. The response? Tens of thousands of people logged-in to begin classifying galaxies from the Sloan Digital Sky Survey. If you’ve been one of the users madly clicking away at galaxies on the Zoo, this is what you’ve been waiting for: the first results have been submitted for publication, and it turns out that our Universe is, in fact, not ‘lopsided’.

One of the questions the Galaxy Zoo site is trying to answer seems simple: are most of the spiral galaxies in our Universe spinning clockwise or counterclockwise? The Universe is observed to be isotropic on large scales, meaning that any direction you look, it appears the same. If this is true, the ways that galaxies spin should be the same, and we should see just as many clockwise galaxies as counterclockwise ones, in every direction.

To definitively answer whether this is true means that a large number of the galaxies in our Universe needed to be analyzed. Computers, as much as they can do for us, just aren’t so good at recognizing patterns. They have a hard time distinguishing with high accuracy whether a galaxy is spinning one way or the other. Thankfully, the human brain is masterful at recognizing patterns. We do so every day when when look at a friend’s face and know who they are. Galaxy Zoo recruited the brains of over 125,000 people to help comb through almost a million galaxies recorded by the Sloan Digital Sky Survey, a robotic telescope survey that is made available to scientists online.

When the first results started to come in, something seemed a bit odd: more counterclockwise galaxies were being reported than clockwise ones. Did this mean the Universe somehow formed more counterclockwise galaxies, or was it something funny with the way people were analyzing the data?

“You would need something pretty wacky to create the effect…Normally you talk to cosmologists and they have three responses to what’s going on. This one made their jaws drop,” said Chris Lintott, a member of the Galaxy Zoo team and a post-doctoral researcher in the Department of Physics at the University of Oxford.

News pieces on the project reported that the Universe was ‘lopsided’, and suggestions for the cause of this phenomenon ranged from the existence of a universe-wide magnetic field to a rethinking of the topology, or shape, of the Universe.

“People were very very critical when we released the data before completely analyzing the results to look for biases, but one thing we do with Galaxy Zoo is that we try to keep the process by which we’re doing the science as open as possible,” Lintott said.

After checking for biases in how users were classifying the galaxies, though, the explanation for the abundance of counterclockwise galaxies was found to exist on a smaller scale: right inside the human brain.

To test whether it was the Universe or the participants that were ‘lopsided’, the Galaxy Zoo team changed the images that people could classify. They inserted a ‘bias sample’ into the catalogue of galaxies on the site: a monochrome image, one image mirrored vertically and one mirrored diagonally for each of over 91,000 objects that were already classified.

If it was the Universe that was lopsided, the numbers in this sample should have switched around. In other words, if there were really more anticlockwise than clockwise galaxies, then there should have been more clockwise galaxies clicked on in this sample, when the image was flipped around. But the preference for anticlockwise galaxies stayed the same in the sample.

Why would people prefer to click on the “anticlockwise” button more often than the “clockwise” button? Either this is something odd about the human brain, in which given a choice between the two prefers one over the other, or there is something about the interface that is making people click on the anticlockwise button more often (i.e., people ‘like’ clicking on buttons toward the center of the screen).

Galaxy Zoo is far from finished with providing the public with an opportunity to participate in an ongoing research project. The site will enter a new phase in the coming months to better study both nature of galaxies and the workings of the human brain.

The first paper using the Galaxy Zoo data was published in the Monthly Notices of the Royal Astronomical Society. If you want to get involved in the very addictive and fun project, you can sign up at www.galaxyzoo.org.

Source: Arxiv, phone interview with Chris Lintott