A Snapshot of a Galactic Crash

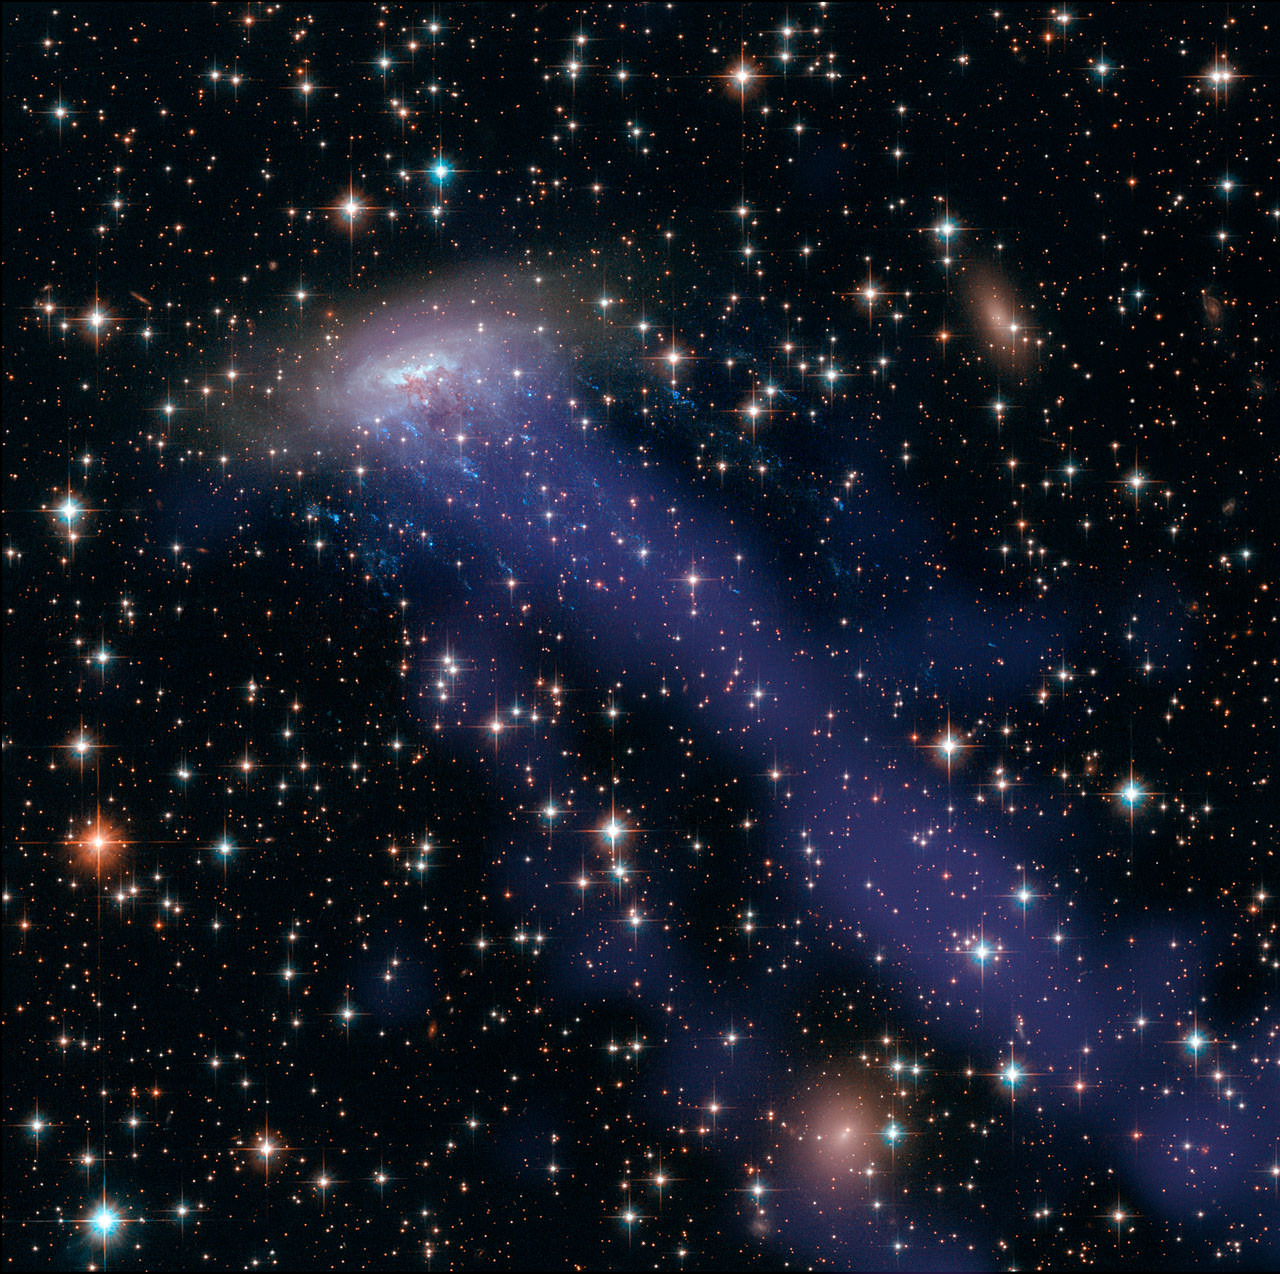
This image combines NASA/ESA Hubble Space Telescope observations with data from the Chandra X-ray Observatory. As well as the electric blue ram pressure stripping streaks seen emanating from ESO 137-001, a giant gas stream can be seen extending towards the bottom of the frame, only visible in the X-ray part of the spectrum. Credit: NASA, ESA, CXC

Some galaxies shine with a red ghostly glow. Once these galaxies stop forming new stars, they can only host long-lived stars with low masses and red optical colors. Astronomers often call these ghostly galaxies “red and dead.” But the basics behind why some form so quickly is still a mystery.

“It is one of the major tasks of modern astronomy to find out how and why galaxies in clusters evolve from blue to red over a very short period of time,” said lead author Michele Fumagalli from Durham University in a news release. “Catching a galaxy right when it switches from one to the other allows us to investigate how this happens.”

And that’s exactly what Fumagalli and colleagues did.

The team used ESO’s Multi Unit Spectroscopic Explorer (MUSE) instrument mounted on the 8-meter Very Large Telescope. With this instrument, astronomers collect 90,000 spectra every time they look at an object, allowing them to gain a detailed map of the object’s motion through space.
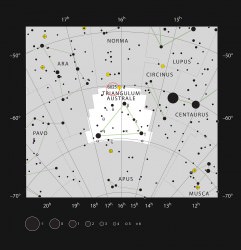
This chart shows the location of the distant galaxy ESO 137-001 in the constellation of Triangulum Australe (The Southern Triangle). This is a rich area of the sky close to the Milky Way, but this galaxy is faint and needs a large telescope to be visible. Credit: ESO, IAU and Sky & Telescope
The location of the distant galaxy ESO 137-001. Credit: ESO / IAU / Sky & Telescope

The target, ESO 137-001, is a spiral galaxy 200 million light-years away in the constellation better known as the Southern Triangle. But more importantly, it’s currently hurtling toward the Norma Cluster and embarking on a grand galactic collision.

ESO 137-001 is being stripped of most of its gas due to a process called ram-pressure stripping. As the galaxy falls into the galaxy cluster, it feels a headwind, much as a runner feels a wind on even the stillest day. At times this can compress the gas enough to spark star formation, but if it’s too intense then the gas is stripped away, leaving a galaxy that’s empty of the material needed to form new stars.

So the galaxy is in the midst of a brilliant transformation, changing from a blue gas-rich galaxy to a red gas-poor galaxy.

The observations show that the outskirts of the galaxy are already completely devoid of gas. Here the stars and matter are more thinly spread, and gravity has a relatively week hold over the gas. So it’s easier to push the gas away.

In fact, dragging behind the galaxy are 200,000 light-year-long streams of gas that have already been lost, making the galaxy look like a jellyfish trailing its tentacles through space. In these streamers, the gas is turbulent enough to compress small pockets of gas and therefore actually ignite star formation.

The center of the galaxy, however, is not yet devoid of gas because the gravitational pull is strong enough to hold out much longer. But it will only take time until all of the galactic gas is swept away, leaving ESO 137-001 red and dead.

Surprisingly the new MUSE observations show the gas trailing behind continues to rotate in the same way that the galaxy does. Furthermore, the rotation of stars at the center of the galaxy remains unhindered by the great fall.

Astronomers remain unsure why as this is only a snapshot of one galactic crash, but soon MUSE and other instruments will pry more out of the cosmic shadows.

The results will be published in the journal Monthly Notices of the Royal Astronomical Society and are available online.

Hubble Spots the Ghostly Light From Dead Galaxies

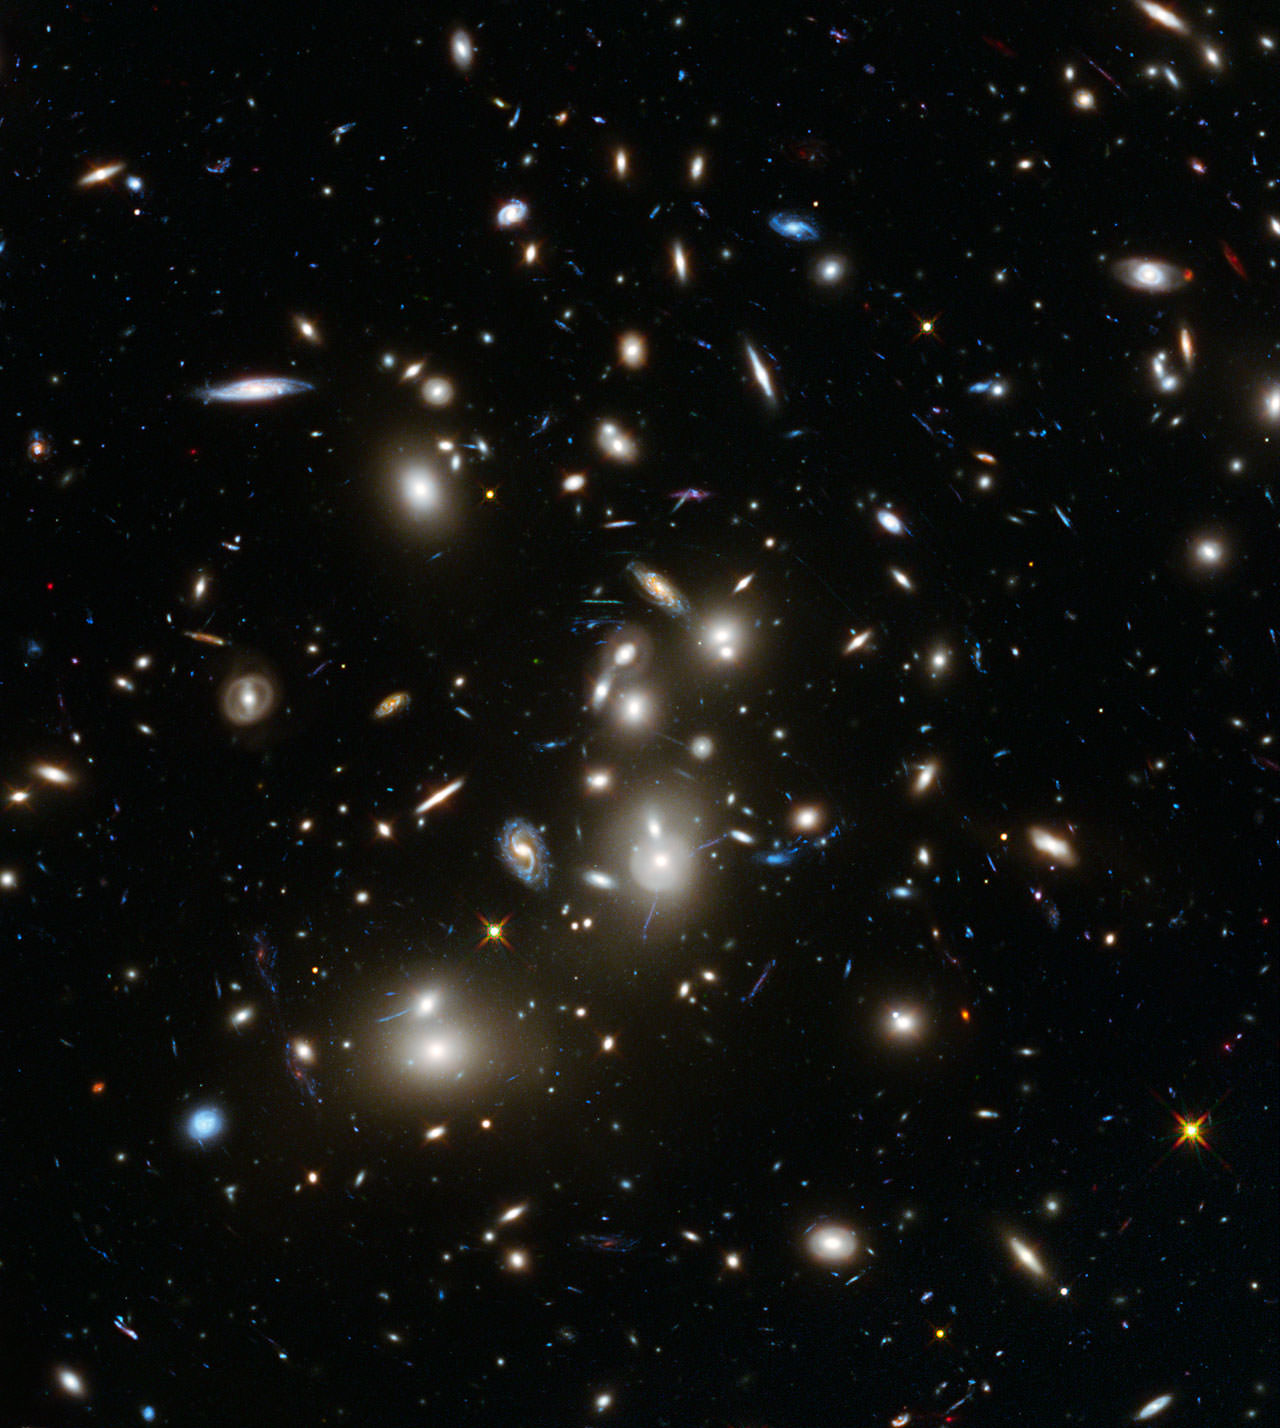
Hubble Frontier Fields observing programme, which is using the magnifying power of enormous galaxy clusters to peer deep into the distant Universe. Credit: NASA.

In a patch of sky 3.5 billion light-years away there are hazy elliptical galaxies, colorful spirals, blue arcs and distorted shapes seen clumping together. It’s the result of a vast cosmic collision that took place over the course of 350 million years.

The mess is a treasure trove of information for astronomers, allowing them to piece together the history of a cosmic pile-up of multiple galaxy clusters.

But now astronomers are digging through the nearby darkness. They’re eyeing the remnant stars that were cast adrift in intergalactic space. These stars should emit a faint glow known as intracluster light that — until now — has mostly remained a subject of speculation.

Mireia Montes and Ignacio Trujillo, both from the University of La Laguna, Spain, have used the Hubble Space Telescope to observe the aforementioned cluster, Abel 2744, in exquisite detail. The cluster has already earned the nickname Pandora’s Cluster for its violent past.

The team looked at both visible and near-infrared color images of the cluster, and then split these color images by brightness. This allowed Montes and Trujillo to pinpoint the color of the cluster’s faintest glow and therefore glean the ghost stars’ age, chemical content, and total mass.

Compared to stars within the cluster’s galaxies, the ghost stars emit bluer light and are therefore rich in heavier elements like oxygen, carbon, and nitrogen. So the scattered stars must be second- or third-generation stars enriched by previous supernovae. But they’re still between three and nine billion years younger than the stars within the cluster’s galaxies.

The team estimates that the combined light of about 100 billion outcast stars contributes approximately six percent of the cluster’s brightness.

But how did the stars get thrown from their respective galaxies in the first place? This new forensic evidence suggests that violent collisions tore apart between four and six Milky Way-size galaxies, scattering their stars into intergalactic space.

“The Hubble data revealing the ghost light are important steps forward in understanding the evolution of galaxy clusters,” said Trujillo in a news release. “It is also amazingly beautiful in that we found the telltale glow by utilizing Hubble’s unique capabilities.”

Abell 2744 is only one target in Hubble’s Frontier Fields program, which will map five more galaxy clusters in superb detail.

The results have been published in the Astrophysical Journal and are available online.
Distant Galaxies Reveal 3D Cosmic Web for the First Time

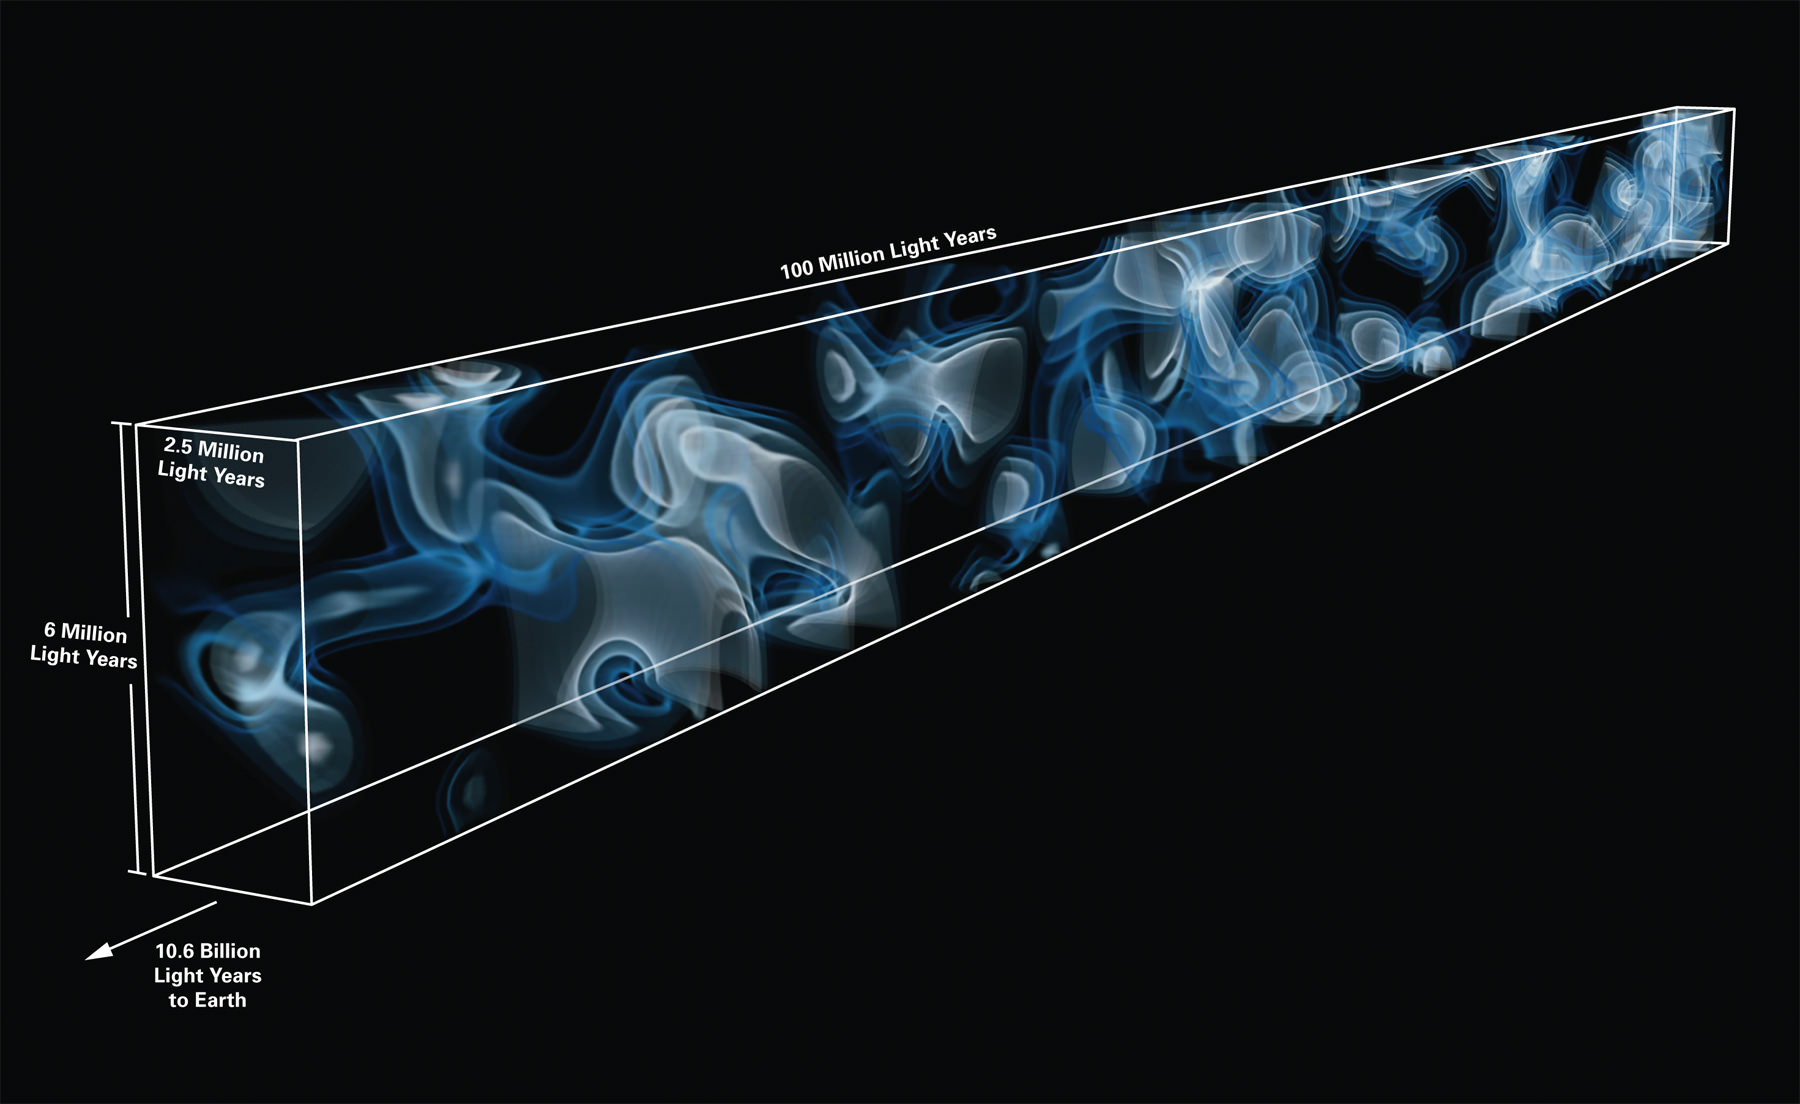
3D map of the cosmic web at a distance of 10.8 billion light years from Earth. The map was generated from imprints of hydrogen gas observed in the spectrum of 24 background galaxies, which are located behind the volume being mapped. This is the first time that large-scale structures in such a distant part of the Universe have been mapped directly. The coloring represents the density of hydrogen gas tracing the cosmic web, with brighter colors representing higher density. Credit: Casey Stark (UC Berkeley) and Khee-Gan Lee (MPIA)

On the largest scales, networks of gaseous filaments span hundreds of millions of light-years, connecting massive galaxy clusters. But this gas is so rarified, it’s impossible to see directly.

For years, astronomers have used quasars — brilliant galactic centers fueled by supermassive black holes rapidly accreting material — to map the otherwise invisible matter.

But now, for the first time, a team of astronomers led by Khee-Gan Lee, a post-doc at the Max Planck Institute for Astronomy, has managed to create a three-dimensional map of the large-scale structure of the Universe using distant galaxies. And the advantages are numerous.

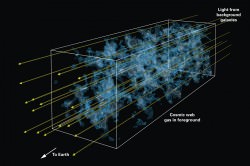
The science has always gone a little something like this: as the bright light from a distant quasar travels toward Earth, it encounters the intervening clouds of hydrogen gas and is partially absorbed. This leaves dark absorption lines in the quasar’s spectrum.

Artist's impression illustrating the technique of Lyman-alpha tomography: as light from distant background galaxies (yellow arrows) travels through the Universe towards Earth, hydrogen gas in the foreground leaves a characteristic imprint ("absorption signature"). From this imprint, astronomers can reconstruct which clouds the light has encountered as it traverses the "cosmic web" of dark matter and gas that accounts for the biggest structures in our universe. By observing a number of background galaxies in a small patch of the sky, astronomers were able to create a 3D map of the cosmic web using a technique similar to medical computer tomography (CT) scans. The coloring represents the density of hydrogen gas tracing the cosmic web, with brighter colors representing higher density. The rendition of the cosmic web in this image is based on a supercomputer simulation of cosmic structure formation. Credit: Khee-Gan Lee (MPIA) and Casey Stark (UC Berkeley)
Artist’s impression illustrating how a distant quasar’s or galaxy’s spectrum becomes clouded with absorption lines from intervening hydrogen gas. Credit: Khee-Gan Lee (MPIA) and Casey Stark (UC Berkeley)

If the Universe were static, the dark absorption lines would always be located at the same spot (121 nanometers for the so-called Lyman-alpha line) in the quasar’s spectrum. But because the Universe is expanding, the distant quasar is flying away from the Earth at a rapid speed. This stretches the quasar’s light, such that each intervening hydrogen gas cloud imprints its absorption signature on a different region of the quasar’s spectrum, leaving a forest of lines.

Therefore detailed measurements of multiple quasars’ spectra close together can actually reveal the three-dimensional nature of the intervening hydrogen clouds. But galaxies are nearly 100 times more numerous than quasars. So in theory they should provide a much more detailed map.

The only problem is that galaxies are also about 15 times fainter than quasars. So astronomers thought they were simply not bright enough to see well in the distant universe. But Lee carried out calculations that suggested otherwise.

“I was surprised to find that existing large telescopes should already be able to collect sufficient light from these faint galaxies to map the foreground absorption, albeit at a lower resolution than would be feasible with future telescopes,” said Lee in a news release. “Still, this would provide an unprecedented view of the cosmic web which has never been mapped at such vast distances.”

Lee and his colleagues used the 10-meter Keck I telescope on Mauna Kea, Hawaii to take a look a closer look at the distant galaxies and the forest of hydrogen absorption embedded in their spectra. But even the weather in Hawaii can turn ugly.

“We were pretty disappointed as the weather was terrible and we only managed to collect a few hours of good data,” said coauthor Joseph Hennawi, also from the Max Planck Institute for Astronomy. “But judging by the data quality as it came off the telescope, it was already clear to me that the experiment was going to work.”

The team was only able to collect data for four hours. But it was still unprecedented. They looked at 24 distant galaxies, which provided sufficient coverage of a small patch of the sky and allowed them to combine the information into a three-dimensional map.

The map reveals the large-scale structure of the Universe when it was only a quarter of its current age. But the team hopes to soon parse the map for more information about the structure’s function — following the flows of cosmic gas as it funneled away from voids and onto distant galaxies. It will provide a unique historical record on how the galaxy clusters and voids grew from inhomogeneities in the Big Bang.

The results have been published in the Astrophysical Journal and are available online.
MAVEN Spacecraft’s First Look at Mars Hints at Promising Results

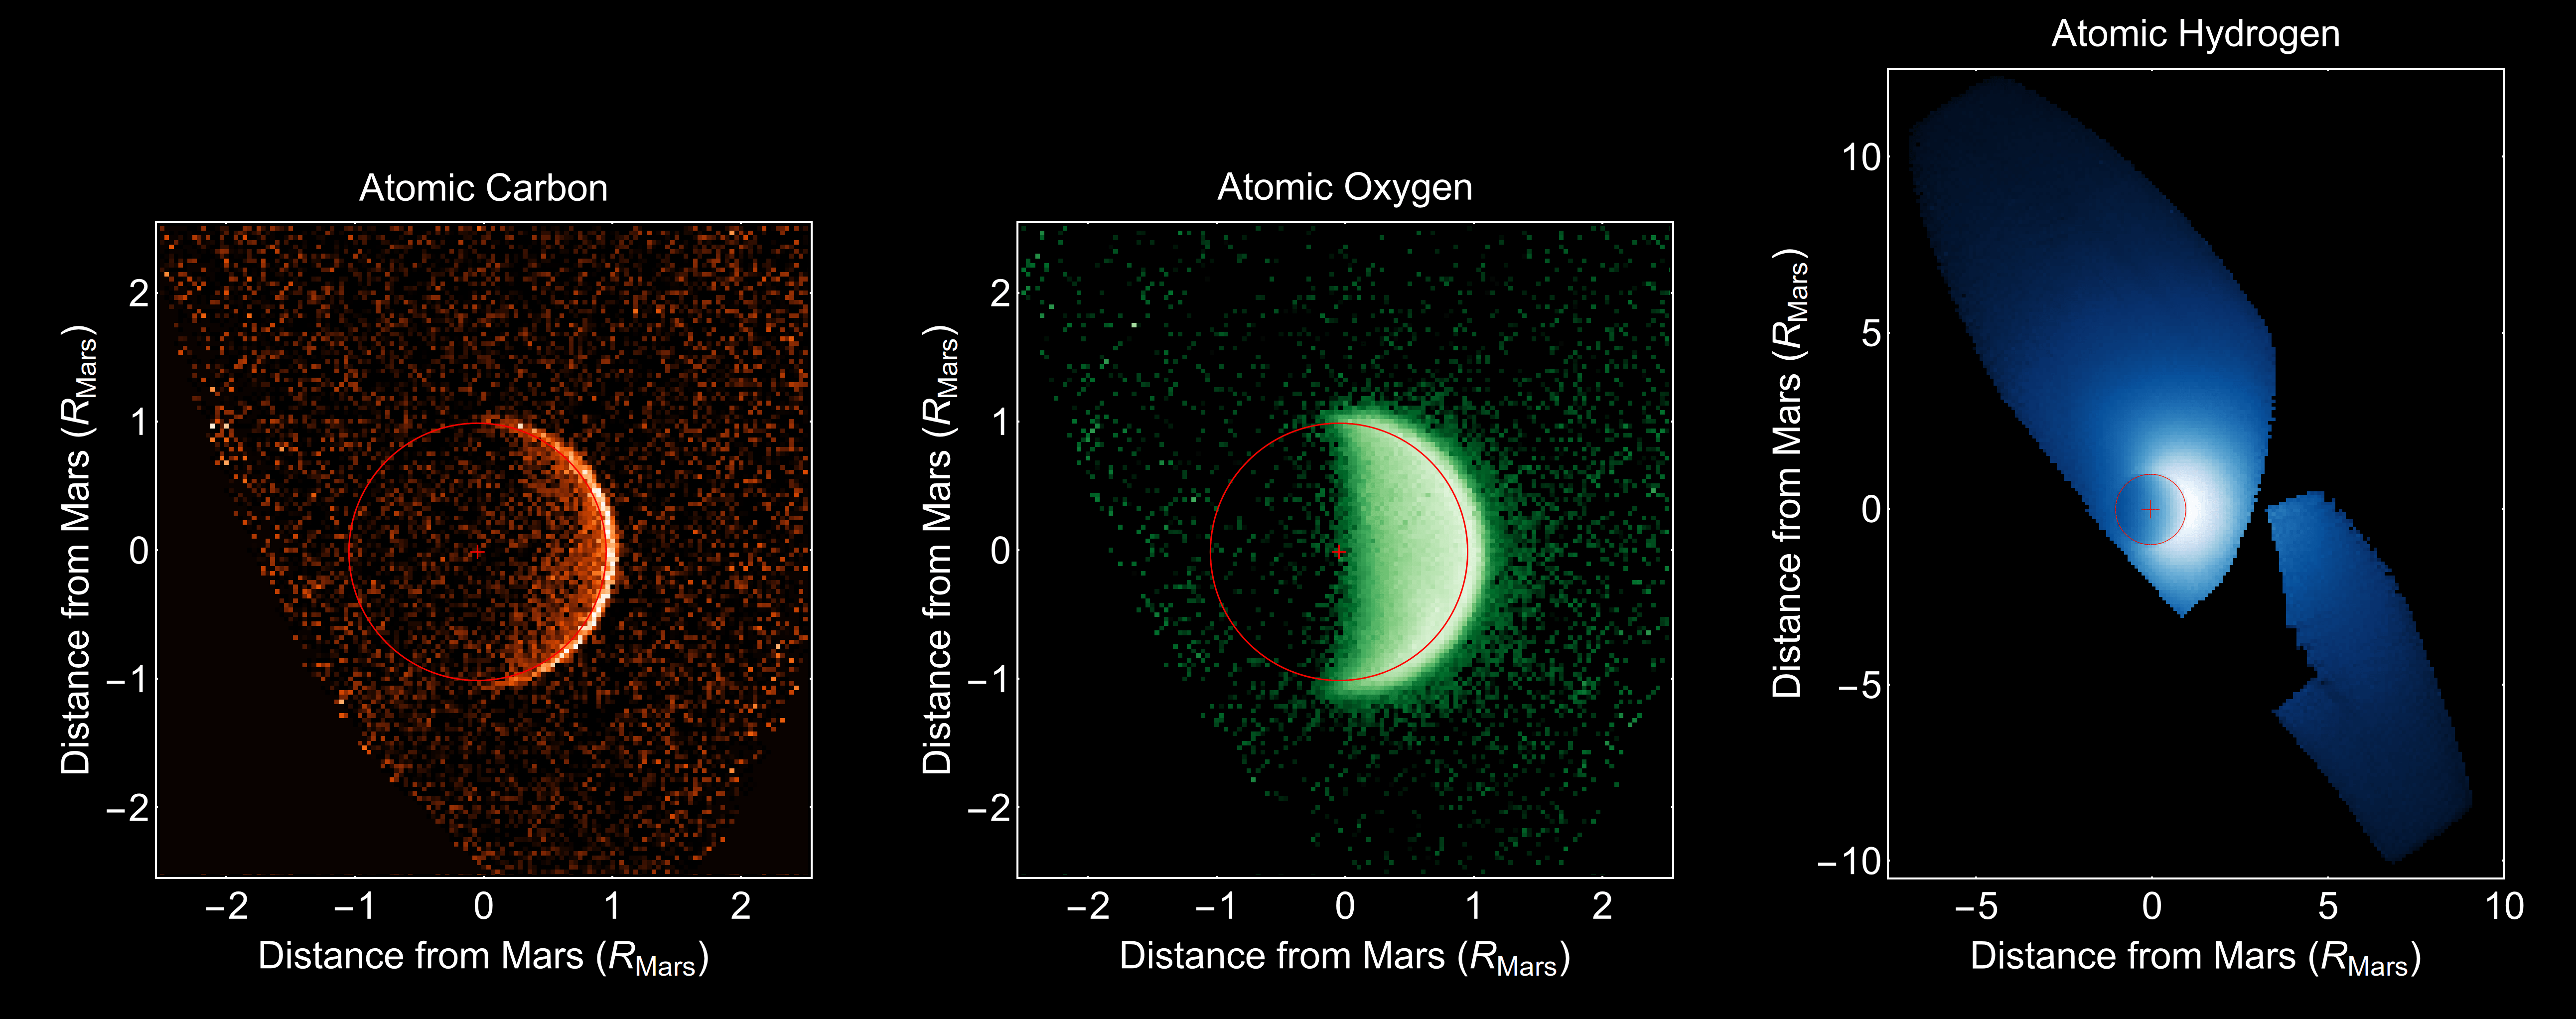
Three views of an escaping atmosphere, obtained by MAVEN’s Imaging Ultraviolet Spectrograph. By observing all of the products of water and carbon dioxide breakdown, MAVEN's remote sensing team can characterize the processes that drive atmospheric loss on Mars. Image Credit: University of Colorado/NASA

It’s been less than a month since NASA’s Mars Atmosphere and Volatile Evolution (MAVEN) spacecraft slipped into orbit. But it’s already provided mission scientists their first look at Mars’ tenuous atmosphere.

“Everything is performing well so far,” said Bruce Jakosky, the mission’s principle investigator, in a news release. “All the instruments are showing data quality that is better than anticipated at this early stage of the mission. The spacecraft is performing beautifully. It’s turning out to be an easy and straightforward spacecraft to fly, at least so far. It really looks as if we’re headed for an exciting science mission.”

Data collected by MAVEN will answer a longstanding puzzle among planetary scientists. There’s ample evidence that early in the Red Planet’s history it had a much denser atmosphere. Rain fell from the sky and water carved its surface. But then the atmosphere vanished, and scientists are unsure why.

One leading theory is that the gas escaped to space, stripped away by the solar wind rushing past. (Click here to see a cool animation of that process.) Here on Earth, our magnetosphere helps protect our atmosphere from the solar wind. But once Mars lost its own magnetosphere, billions of years ago, its atmosphere became vulnerable.

MAVEN’s spectrometers will attempt to determine if hydrogen atoms, torn from water molecules by ultraviolet sunlight, are escaping to space and at what rate. Already, the spacecraft has observed the edges of the Martian atmosphere using its Imaging Ultraviolet Spectrograph (IUVS) camera, which is sensitive to the sunlight reflected by the atoms.

“With these observations, MAVEN’s IUVS has obtained the most complete picture of the extended Martian upper atmosphere ever made,” said team member Mike Chaffin from Colorado University at Boulder.

So far scientists have used IUVS to create a map of Mars’ ozone. “With these maps we have the kind of complete and simultaneous coverage of Mars that is usually only possible for Earth,” said team member Justin Deighan, also from CU-Boulder.

There will be about two weeks of additional instrument calibration and testing before MAVEN starts its primary science mission in early to mid-November. It will then likely take a few additional months to build up enough measurements to have a clear sense of what’s going on. But the initial results are promising.

Retired Astronaut Chris Hadfield Releases Stunning Space Photos

On a clear day, astronauts aboard the ISS can see over 1,000 miles from Havana to Washington D.C. Image Credit: Chris Hadfield / NASA

Orbiting 200 miles above the Earth, Retired Astronaut Chris Hadfield could easily photograph the ridges of the Himalayan Mountains, the textures of the Sahara Desert and the shadows cast by the tallest buildings in Manhattan.

The Richat Structure in Mauritania, also known as the Eye of the Sahara, is a landmark for astronauts. It’s hard to know where you are, especially if you’re over a vast 3,600,000-square-mile desert, but this bull’s-eye orients you, instantly. Oddly, it appears not to be the scar of a meteorite but a deeply eroded dome, with a rainbow-inspired color scheme. Image Credit: Chris Hadfield / NASA
Mauritania, also known as the Eye of the Sahara, is a landmark in the vast 3,600,000-square-mile desert. Credit: Chris Hadfield / NASA

“The view of the world when you have it just right there through the visor of your helmet is overpoweringly gorgeous,” said Hadfield, speaking Oct. 14 at the American Museum of Natural History in New York City. “It is phenomenal. The world is pouring by with all its colors and textures so fast.”

Although Hadfield has already shared many of his photos via social media, he unveiled another 150 images in his latest book, “You Are Here: Around The World in 92 Minutes.” The photographs open a rare window onto the Earth, illuminating our planet’s beauty and the consequences of human settlement.

The book is designed to replicate a single 92-minute orbit aboard the International Space Station. “It’s as if you and I are sitting at the window of the space station, and I said, ‘let’s go around the world once. I want to show you the really cool stuff,’ ” said Hadfield.

The astronaut, famed for his zero-gravity rendition of David Bowie’s “Space Oddity,” took approximately 45,000 photos during his 146-day stint on the space station in 2013. That’s roughly 300 photos per day every day. Since NASA does not set aside specific time slots for astronauts to take photos, Hadfield did so while he should have been asleep or serenading millions with his guitar.

The Himalayan mountain range in South Asia.
The Himalayan mountain range in South Asia. Credit: Chris Hadfield / NASA

Why? Beauty triggers an unexplained emotional reaction, explained Hadfield. It also provides the best means of communication. Although the space station is an incredible scientific laboratory, art is equally important, he added, because it’s a way to reach people who might not otherwise be interested in the scientific nitty-gritty.

Hadfield is often attributed for humanizing space travel in a way that others before him had not. His use of social media, videos designed to quench our curiosity about living in space, and music, demonstrate a sheer passion that has inspired millions.

Manhattan awake at 9:23 a.m. local time, and Manhattan at rest at 3:45 a.m. local time. Image Credit: Chris Hadfield / NASA
Manhattan awake at 9:23 a.m. local time, and Manhattan at rest at 3:45 a.m. local time. Credit: Chris Hadfield / NASA

His photos not only share the natural beauty of our home planet, but also many signs of humanity, from bright city lights to the devastations of climate change as lakes dry up and disappear. “There’s so much information in just one glimpse out the window of human decision making and geology,” said Hadfield.

Hadfield’s remote yet vivid photos stand as a reminder of both the magnificence and fragility of life on our planet. “To have the world on one side, like this huge kaleidoscope, and then the bottomlessness of the Universe right there beside you,” said Hadfield, trailing off in awe. “You’re not on the world looking at it. You’re in the Universe with the world.”

A New Look at Dark Matter — Is the Milky Way Less of a Behemoth Than Previously Thought?

This annotated artist's conception illustrates our current understanding of the structure of the Milky Way galaxy. Image Credit: NASA

Astronomy is notorious for raising more questions than it answers. Take the observation that the vast majority of matter is invisible.

Although astronomers have gathered overwhelming evidence that dark matter makes up roughly 84 percent of the universe’s matter — providing straightforward explanations for the rotation of individual galaxies, the motions of distant galaxy clusters, and the bending of distant starlight — they remain unsure about any specifics.

Now, a group of Australian astronomers thinks there’s only half as much dark matter in the Milky Way as previously thought.

In 1933, Swiss astronomer Fritz Zwicky observed the Coma cluster — a galaxy cluster roughly 320 million light-years away and nearly 2 light-years across — and found that it moved too rapidly. There simply wasn’t enough visible matter to hold the galaxy cluster together.

Zwicky decided there must be a hidden ingredient, known as dunkle Materie, or dark matter, that caused the motions of these galaxies to be so large.

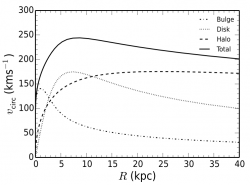
The rotation curve of the Milky Way. Image Credit: Kafle et al.

Then in 1978, American astronomer Vera Rubin looked at individual galaxies. Astronomers largely assumed galaxies rotated much like our Solar System, with the outer planets rotating slower than the inner planets. This argument aligns with Newton’s Laws and the assumption that most of the mass is located in the center.

But Rubin found that galaxies rotated nothing like our own Solar System. The outer stars did not rotate slower than the inner stars, but just as fast. There had to be dark matter on the outskirts of every galaxy.

Now, astronomer Prajwal Kafle, from The University of Western Australia, and his colleagues have once again observed the speed of stars on the outskirts of our own galaxy, the Milky Way. But he did so in much greater detail than previous estimates.

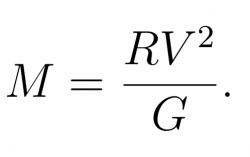
From a star’s speed, it’s relatively simple to calculate any interior mass. The simple equation below shows that the interior mass (M) is equal to the distance the star is from the galactic center (R) times its velocity (V) squared, all divided by the gravitational constant (G):
Screen Shot 2014-10-13 at 2.35.47 PM

Kafle and his colleagues used messier physics accounting for the sloppiness of the galaxy. But the point holds, with a star’s velocity, you can calculate any interior mass. And with multiple stars’ velocities you’re bound to be more accurate. The team found the dark matter in our galaxy weighs 800 billion times the mass of the Sun, half of previous estimates.

“The current idea of galaxy formation and evolution … predicts that there should be a handful of big satellite galaxies around the Milky Way that are visible with the naked eye, but we don’t see that,” said Kafle in a news release. This is typically referred to as the missing satellites problem, and it has evaded astronomers for years.

“When you use our measurement of the mass of the dark matter the theory predicts that there should only be three satellite galaxies out there, which is exactly what we see; the Large Magellanic Cloud, the Small Magellanic Cloud and the Sagittarius Dwarf Galaxy,” said Kafle.

These new measurements might prove the Milky Way is not quite the behemoth astronomers previously thought. They also help explain why there are so few satellite galaxies in orbit. But first the results will have to be confirmed as they stand up against numerous other ways to weigh the dark matter in our galaxy.

The results have been published in the Astrophysical Journal and are available online.

Time Dilation Confirmed in the Lab

Blah.

It sounds like science fiction, but the time you experience between two events depends directly on the path you take through the universe. In other words, Einstein’s theory of special relativity postulates that a person traveling in a high-speed rocket would age more slowly than people back on Earth.

Although few physicists doubt Einstein was right, it’s crucial to verify time dilation to the best possible accuracy. Now, an international team of researchers, including Nobel laureate Theodor Hänsch, director of the Max Planck optics institute, has done just this.

Tests of special relativity date back to 1938. But once we started going to space regularly, we had to learn to deal with time dilation on a daily basis. GPS satellites, for example, are basically clocks in orbit. They travel at a whopping speed of 14,000 kilometers per hour well above the Earth’s surface at a distance of 20,000 kilometers. So relative to an atomic clock on the ground they lose about 7 microseconds per day, a number that has to be taken into account for them to work properly.

To test time dilation to a much higher precision, Benjamin Botermann of Johannes Gutenberg-University, Germany, and colleagues accelerated lithium ions to one-third the speed of light. Here the Doppler shift quickly comes into play. Any ions flying toward the observer will be blue shifted and any ions flying away from the observer will be red shifted.

The level at which the ions undergo a Doppler shift depends on their relative motion, with respect to the observer. But this also makes their clock run slow, which redshifts the light from the observer’s point of view — an effect that you should be able to measure in the lab.

So the team stimulated transitions in the ions using two lasers propagating in opposite directions. Then any shifts in the absorption frequency of the ions are dependent on the Doppler effect, which we can easily calculate, and the redshift due to time dilation.

The team verified their time dilation prediction to a few parts per billion, improving on previous limits. The findings were published on Sept. 16 in the journal Physical Review Letters.

Have Astronomers Seen a Forming Planet in Action?

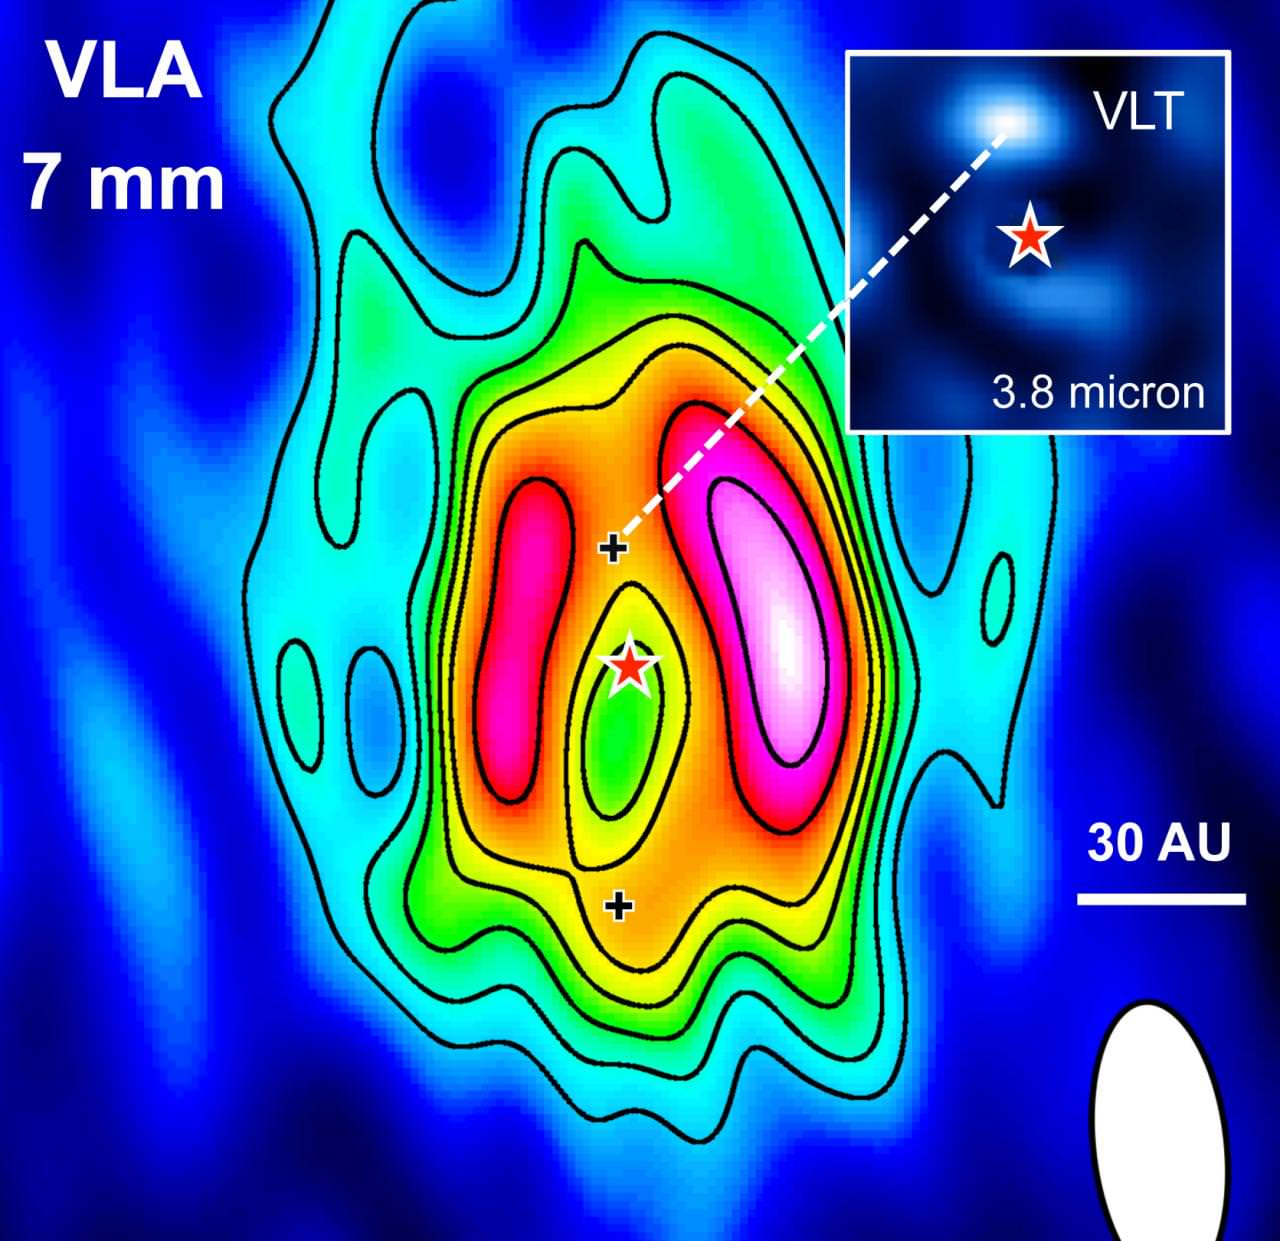
Image at 7 mm wavelength of the dusty disk around the star HD 169142 obtained with the Very Large Array (VLA) at 7 mm wavelength. The positions of the protoplanet candidates are marked with plus signs (+) (Osorio et al. 2014, ApJ, 791, L36). The insert in the upper right corner shows, at the same scale, the bright infrared source in the inner disk cavity, as observed with the Very Large Telescope (VLT) at 3.8 micron wavelength (Reggiani et al. 2014, ApJ, 792, L23).

Huge disks of dust and gas encircle many young stars. Some contain circular gaps — likely the result of forming planets carving out cavities along their orbital paths — that make the disks look more like ripples in a pond than flat pancakes.

But astronomers know only a few examples, including the archetypal disk surrounding Beta Pictoris, of this transitional stage between the original disk and the young planetary system. And they have never spotted a forming planet.

Two independent research teams think they’ve observed precisely this around the star HD 169142, a young star with a disk that extends up to 250 astronomical units (AU), roughly six times greater than the average distance from the Sun to Pluto.

Mayra Osorio from the Institute of Astrophysics of Andalusia in Spain and colleagues first explored HD 169142’s disk with the Very Large Array (VLA) in New Mexico. The 27 radio dishes configured in a Y-shape allowed the team to detect centimeter-sized dust grains. Then combining their results with infrared data, which traces the presence of microscopic dust, the group was able to see two gaps in the disk.

One gap is located between 0.7 and 20 AU, and the second larger gap is located between 30 and 70 AU. In our Solar System the first would begin at the orbit of Venus and end at the orbit of Uranus, while the second would begin at the orbit of Neptune, pass Pluto’s orbit, and extend beyond.

“This structure already suggested that the disk was being modified by two planets or sub-stellar objects, but, additionally, the radio data reveal the existence of a clump of material within the external gap, located approximately at the distance of Neptune’s orbit, which points to the existence of a forming planet,” said Mayra Osorio in a news release.

Maddalena Reggiani from the Institute for Astronomy in Zurich and colleagues then tried to search for infrared sources in the gaps using the Very Large Telescope. They found a bright signal in the inner gap, which likely corresponds to a forming planet or a young brown dwarf, an object that isn’t massive enough to kick start nuclear fusion.

The team was unable to confirm an object in the second gap, likely due to technical limitations. Any object with a mass less than 18 times Jupiter’s mass will remain hidden in the data.

Future observations will shed more light on the exotic system, hopefully allowing astronomers to better understand how planets first form around young stars.

Both papers have been published in the Astrophysical Journal Letters.

219 Million Stars Create the Most Detailed Catalogue of our Milky Way Yet

A density map of part of the Milky Way disk, constructed from IPHAS data. The axes show galactic latitude and longitude, coordinates that relate to the position of the centre of the galaxy. The mapped data are the counts of stars detected in i, the longer (redder) wavelength broad band of the survey, down to a faint limit of 19th magnitude. Although this is just a small section of the full map, it portrays in exquisite detail the complex patterns of obscuration due to interstellar dust. Credit: Hywel Farnhill, University of Hertfordshire.

On the darkest of nights, thousands of stars are sprinkled across the celestial sphere above us. Or, to be exact, there are 9,096 stars observable across the entire sky. Divide that number in half, and there are 4,548 stars (give or take a few) visible from horizon to horizon.

But this number excludes the glowing band stretching across the night sky, the Milky Way. It’s the disk of our own galaxy, a system stretching 100,000 light-years across. The naked eye is unable to distinguish individual specks of light, but the Isaac Newton Telescope (INT) on La Palma in the Canary Islands has recently charted 219 million separate stars in this disk alone.

For the last 10 years a team of astronomers led by Geert Barentsen from the University of Hertfordshire has been collecting and compiling light from all stars brighter than 20th magnitude, or one million times fainter than the human eye can see (at 6th magnitude).

They created a beautiful density map of the Milky Way, giving them new insight into the structure of this vast system. The black, fog-like regions are galactic dust, which blocks more distant light. The brighter regions are densely packed stars.

The INT took measurements in two broad filters, which captured light at the red end of the visible spectrum, and in one narrow filter, which captured light only from the hydrogen emission line, H-alpha. The inclusion of H-alpha enables exquisite mapping of nebulae, glowing clouds of hydrogen gas.

The production of the catalogue is an example of modern astronomy’s exploitation of “big data.” But it would also grace the walls of any art studio.

This Exoplanet Has Prematurely Aged its Star

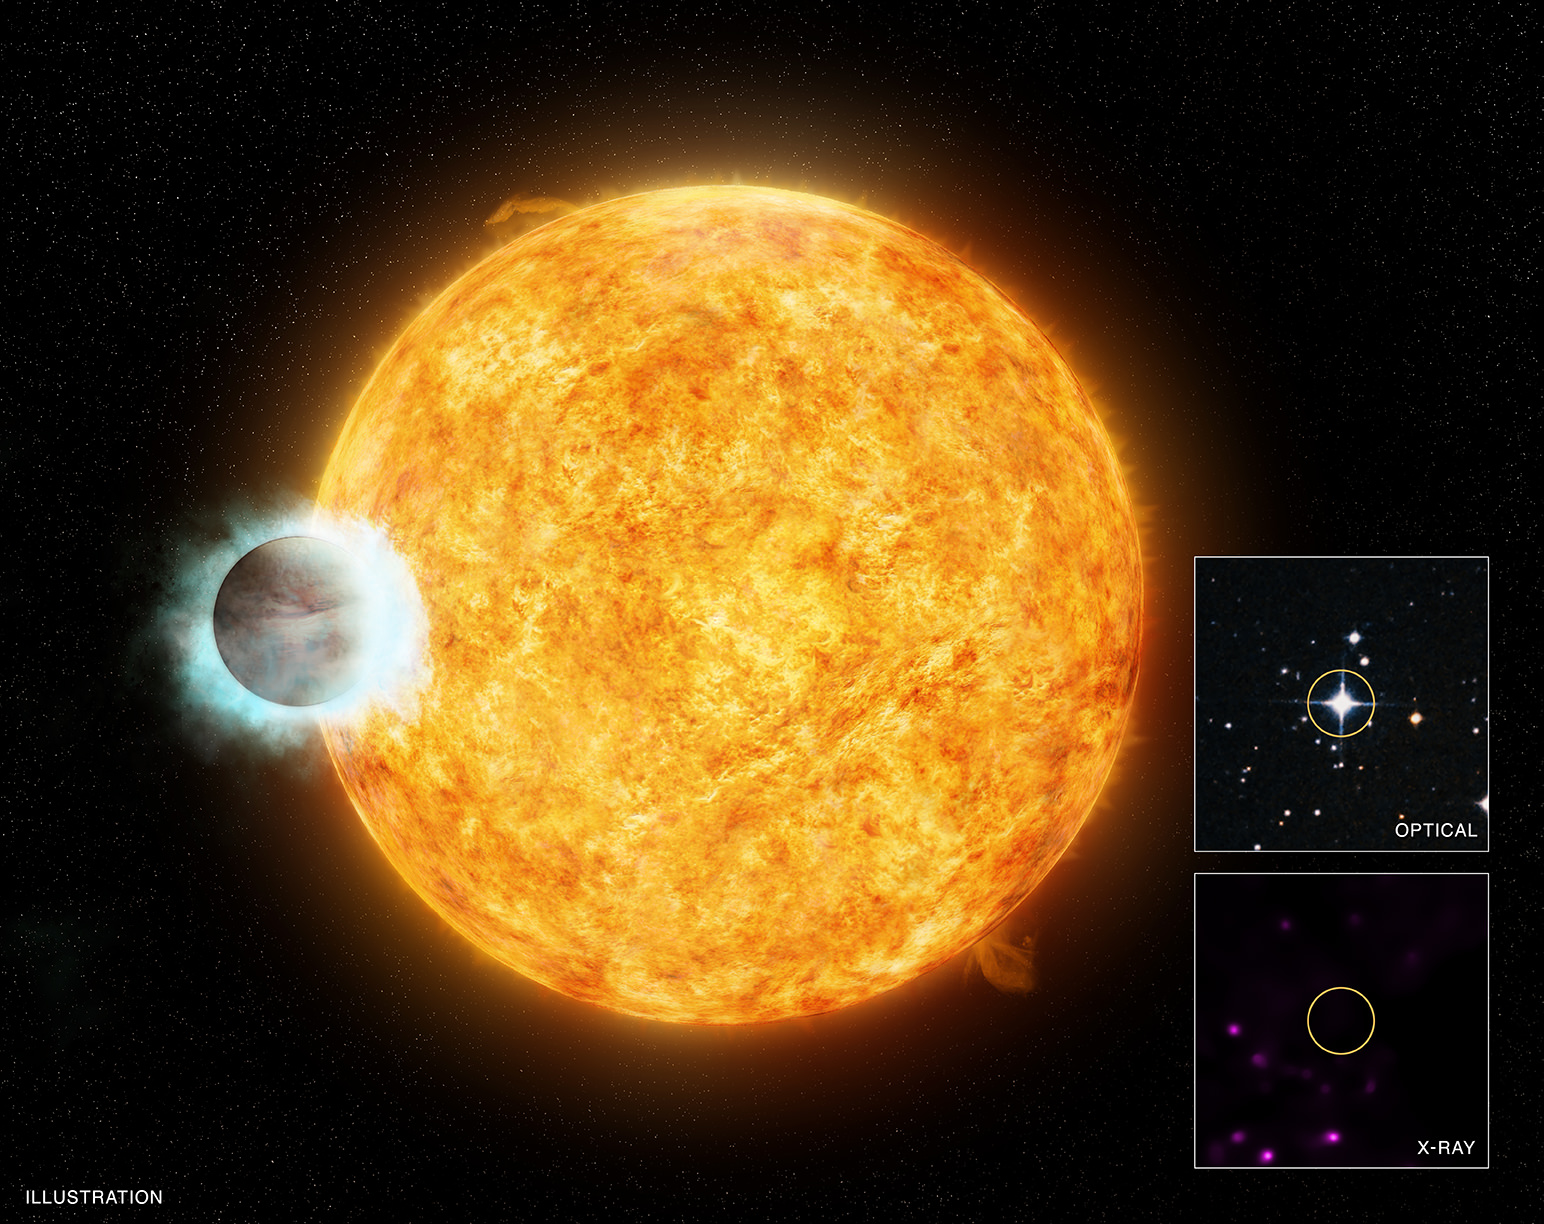
An exoplanet about ten times Jupiter's mass located some 330 light years from Earth. X-ray: NASA/CXC/SAO/I.Pillitteri et al; Optical: DSS; Illustration: NASA/CXC/M.Weiss

Hot young stars are wildly active, emitting huge eruptions of charged particles form their surfaces. But as they age they naturally become less active, their X-ray emission weakens and their rotation slows.

Astronomers have theorized that a hot Jupiter — a sizzling gas giant circling close to its host star — might be able to sustain a young star’s activity, ultimately prolonging its youth. Earlier this year, two astronomers from the Harvard-Smithsonian Center for Astrophysics tested this hypothesis and found it true.

But now, observations of a different system show the opposite effect: a planet that’s causing its star to age much more quickly.

The planet, WASP-18b has a mass roughly 10 times Jupiter’s and circles its host star in less than 23 hours. So it’s not exactly a classic hot Jupiter — a sizzling gas giant whipping around its host star — because it’s characteristics are a little more drastic.

“WASP-18b is an extreme exoplanet,” said lead author Ignazio Pillitteri of the National Institute for Astrophysics in Italy, in a news release. “It is one of the most massive hot Jupiters known and one of the closest to its host star, and these characteristics lead to unexpected behavior.”

The team thinks WASP-18 is 600 million years old, relatively young compared to our 5-billion-year-old Sun. But when Pillitteri and colleagues took a long look with NASA’s Chandra X-ray Observatory at the star, they didn’t see any X-rays — a telltale sign the star is youthful. In fact, the observations show the star is 100 times less active than it should be.

“We think the planet is aging the star by wreaking havoc on its innards,” said co-author Scott Wolk (who also worked on the previous study showing the opposite effect) from the Harvard-Smithsonian Center for Astrophysics.

The researchers argue that tidal forces created by the gravitational pull of the massive planet might have disrupted the star’s magnetic field generated by the motion of conductive plasma deep inside the star. It’s possible the exoplanet significantly interfered with the upper layers of the convective zone, reduced any mixing of stellar material, and effectively canceled out the magnetic activity.

The effect of tidal forces from the planet may also explain an unusually high amount of lithium seen in the star. Lithium is usually abundant in younger stars, but disappears over time as convection carries it further toward the star’s center, where it’s destroyed by nuclear reactions. So if there’s less convection — as seems to be the case for WASP 18 — then the lithium won’t circulate toward the center of the star and instead will survive.

The findings have been published in the July issue of Astronomy and Astrophysics and are available online.