GRB Lights Up Ancient Hidden Galaxy

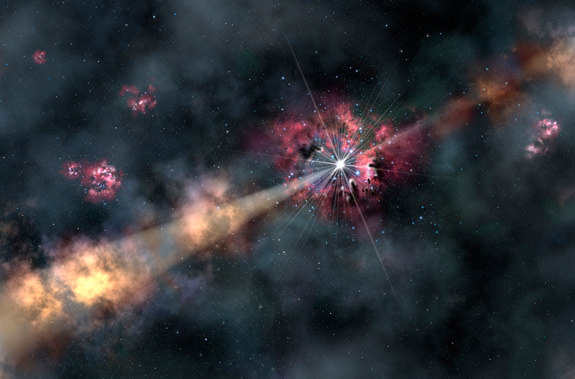
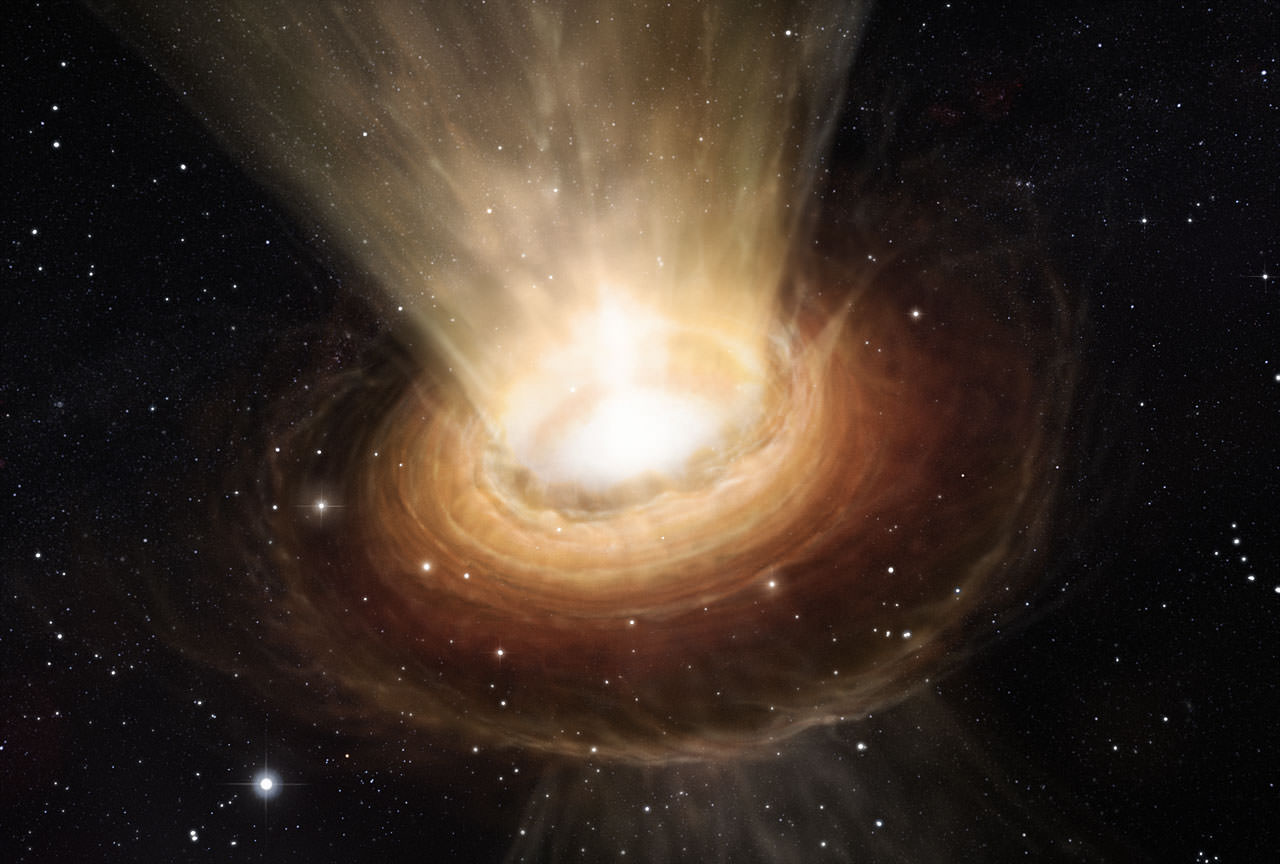
This artist's illustration depicts a gamma-ray burst illuminating clouds of interstellar gas in its host galaxy. By analyzing a recent gamma-ray burst, astronomers were able to learn about the chemistry of a galaxy 12.7 billion light-years from Earth. They discovered it contains only one-tenth of the heavy elements (metals) found in our solar system. Credit: Gemini Observatory/AURA, artwork by Lynette Cook

Once upon a time, more than 12.7 billion years ago, a star was poised on the edge of extinction. It made its home in a galaxy too small, too faint and too far away to even be spotted by the Hubble Space Telescope. Not that it would matter, because this star was going to end its life before the Earth formed. As it blew itself apart, it expelled its materials in twin jets which ripped through space at close to the speed of light – yet the light of its death throes outshone its parent galaxy by a million times.

“This star lived at a very interesting time, the so-called dark ages just a billion years after the Big Bang,” says lead author Ryan Chornock of the Harvard-Smithsonian Center for Astrophysics (CfA).

“In a sense, we’re forensic scientists investigating the death of a star and the life of a galaxy in the earliest phases of cosmic time,” he adds.

When this unsung star expired, it created one of the scariest things in astronomy… a gamma-ray burst (GRB). However, it wasn’t just a normal, garden variety GRB – it was long one, lasting more than four minutes. After century upon century of travel, the light reached our little corner of the Universe and was detected by NASA’s Swift spacecraft on June 6th. Chornock and his team quickly organized follow-up observations by the MMT Telescope in Arizona and the Gemini North telescope in Hawaii.

“We were able to get right on target in a matter of hours,” Chornock says. “That speed was crucial in detecting and studying the afterglow.”

Time to kick back and have a smoke? In a sense. The “afterglow” of a GRB happens when the jets impact the surrounding gas in an almost tsunami-like effect. As it sweeps up the material, it begins to heat and glow. As this light traverses the parent galaxy, it impacts clouds of interstellar gas, illuminating their spectra. Through these chemical signatures, astronomers are able to ascertain what gases the distant galaxy may have contained. As we know, all chemical elements heavier than hydrogen, helium, and lithium are the product of stars. Researchers refer to this as “metal content” and it takes a certain amount of time to accumulate. In the scheme of creation, the elements necessary for life – carbon and oxygen – didn’t exist. What Chornock and his team discovered was the GRB galaxy was host to only about a tenth of the “metals” in our solar system. What does that mean? In the eyes of the astronomers, rocky planets might have been able to form in that far away galaxy, but chances are good that life could not.

“At the time this star died, the universe was still getting ready for life. It didn’t have life yet, but was building the required elements,” says Chornock.

At a redshift of 5.9, or a distance of 12.7 billion light-years, GRB 130606A is one of the most distant gamma-ray bursts ever found.

“In the future we will be able to find and exploit even more distant GRBs with the planned Giant Magellan Telescope,” says Edo Berger of the CfA, a co-author on the publication.

Original Story Source: Harvard Smithsonian Center for Astrophysics News Release.

The Great Galactic Turn-Off

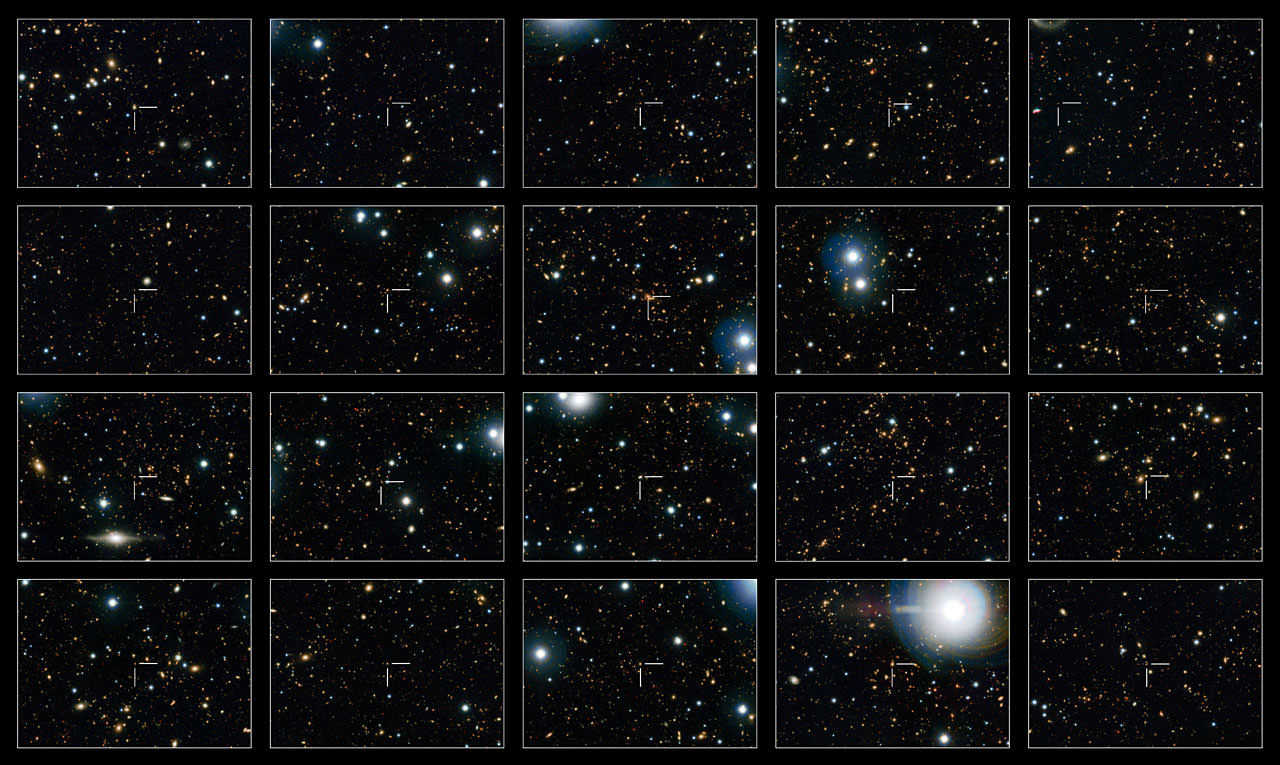
This image shows 20 of the quenched galaxies — galaxies that are no longer forming stars — seen in the Hubble COSMOS observations. Each galaxy is identified by a crosshair at the centre of each frame. Quenched galaxies in the distant Universe are much smaller than those seen nearby. It was thought that these small galaxies merged with other smaller, gas-free galaxies to grow bigger, but it turns out that larger galaxies were "switching off" at later times and adding their numbers to those of their smaller and older siblings, giving the mistaken impression of individual galaxy growth over time. Credit: NASA, ESA, M. Carollo (ETH Zurich)

Are you ready for a new galactic puzzle? Then let’s start with some clues. It has been long assumed that some galaxies reach a point in their evolution when star formation stops. In the distant past, these saturated galaxies appeared smaller than those formed more recently. This is what baffles astronomers. Why do some galaxies continue to grow if they are no longer forming stars? Thanks to some very astute Hubble Space Telescope observations, a team of astronomers has found what appears to be a rather simple explanation. Which came first? The chicken or the egg?

Until now, these diminutive, turned-off galaxies were theorized to continue to grow into the more massive, saturated galaxies observed closer to us. Because they no longer have active star-forming regions, it was assumed they gained their extra mass by combining with other smaller galaxies – ones five to ten times less in overall size. However, for this theory to be plausible, it would take a host of small galaxies to be present for the saturated population to consume… and it’s just not happening. Because we simply did not have the data available about such a large number of galaxies, it was impossible to count and identify potential candidates, but the Hubble COSMOS survey has provided an eight billion year look at the cosmic history of turned-off galaxies.

Loading player…

“The apparent puffing up of quenched galaxies has been one of the biggest puzzles about galaxy evolution for many years,” says Marcella Carollo of ETH Zurich, Switzerland, lead author on a new paper exploring these galaxies. “No single collection of images has been large enough to enable us to study very large numbers of galaxies in exactly the same way — until Hubble’s COSMOS,” adds co-author Nick Scoville of Caltech, USA.

According to the news release, the team utilized a large set of COSMOS images – the product of close to a 1,000 hours of observations and consisting of 575 over-lapped images taken with the Advanced Camera for Surveys (ACS) . Needless to say, it was one of the most ambitious projects ever undertaken by Hubble. The HST data was combined with additional observations from Canada-France-Hawaii Telescope and the Subaru Telescope to look back to when the Universe was about half its present age. This huge data set covered an area of sky almost nine times the size of the full Moon! The saturated – or “quenched” – galaxies present at that age were small and compact… and apparently remained in that state. Instead of getting larger as they evolved, they kept their small size – apparently the same size they were when star-formation ceased. Yet, these galaxy types appear to be gaining in girth as time passes. What gives?

“We found that a large number of the bigger galaxies instead switch off at later times, joining their smaller quenched siblings and giving the mistaken impression of individual galaxy growth over time,” says co-author Simon Lilly, also of ETH Zurich. “It’s like saying that the increase in the average apartment size in a city is not due to the addition of new rooms to old buildings, but rather to the construction of new, larger apartments,” adds co-author Alvio Renzini of INAF Padua Observatory, Italy.

If eight billion years teaches us anything, it teaches us that we don’t know everything…. and sometimes the most simple of answers could be the correct one. We knew that actively star-forming galaxies were far less massive in the early Universe and that explains why they were smaller when star-formation turned off.

“COSMOS provided us with simply the best set of observations for this sort of work — it lets us study very large numbers of galaxies in exactly the same way, which hasn’t been possible before,” adds co-author Peter Capak, also of Caltech. “Our study offers a surprisingly simple and obvious explanation to this puzzle. Whenever we see simplicity in nature amidst apparent complexity, it’s very satisfying,” concludes Carollo.

Original Story Source: ESA/Hubble News Release.

Isotopes May One Day Aid In Planet Search

Modeling results show where the injected gas and dust ended ups only 34 years after being injected at the disk’s surface. It was injected 9 astronomical units from the central prostar and is now in the disk’s midplane. The outer edge shown is 10 astronomical units from the central prostar. Mixing and transport are still underway and the underlying spiral arms that drive the mixing and transport can be seen. Image courtesy of Alan Boss.

When we consider samples from the solar nebula, we think about comets and meteorites. These materials come from our solar system’s beginning, but the clues they give to formation don’t always mesh neatly. Thanks to a new study done by Carnegie’s Alan Boss, we’re now able to take a look at the Sun’s formation through a set of theoretical models. This work could not only help explain some of the differences we’ve discovered, but could also point to habitable exoplanets.

At the present time, a way to look back at the solar system’s early period is to theorize about tiny pockets of crystalline particles found in comets. These particles were forged at high temperatures. An alternate method of studying solar system formation is to analyze isotopes. These variants of elements carry the exact same number of protons, but contain a different number of neutrons. Unlike the crystalline particles, we can get our hands on samples of isotopes, because they are found in meteorites. As they decay, they turn into different elements. However, the initial number of isotopes can clue researchers as to their origin and how they might have journeyed across the neophyte solar system.

“Stars are surrounded by disks of rotating gas during the early stages of their lives.” says the Carnegie team. “Observations of young stars that still have these gas disks demonstrate that Sun-like stars undergo periodic bursts, lasting about 100 years each, during which mass is transferred from the disk to the young star.”

However, the study isn’t cut and dried just yet. The study of both particles and isotopes from comets and meteorites still present a somewhat confused look at early solar system formation. It would appear there’s more to the picture than just a single path of matter from the protoplanetary disk to the parent star. The crystalline grains found in comets are heat-formed and they signal that considerable mixing and outward flow occurred from materials close to the parent star and out to the perimeter of the system itself. Certain isotopes, such as aluminum, support this theory, but others, like oxygen, defy such a neat explanation.

According to the news release, Boss’ new model shows how a period of slight gravitational instability in the gas disk surrounding a proto-Sun about to go into an outburst phase, could account for these findings. What’s more, the models also predict this could happen with a wide variety of both mass and disk sizes. It shows that instability can “cause a relatively rapid transportation of matter between the star and the gas disk, where matter is moved both inward and outward. This accounts for the presence of heat-formed crystalline particles in comets from the solar system’s outer reaches.”

So what of aluminum? According to Boss’ model, the ratios of aluminum isotopes can be explained. It would appear the original isotope was imparted during a singular event – such as an exploding star sending a shock wave both inward and outward in the protoplanetary disk. As far as oxygen goes, it can be present in different pattern because it originated from sustained chemical reactions natural to the outer solar nebula and did not just happen as a singular event.

“These results not only teach us about the formation of our own solar system, but also could aid us in the search for other stars orbited by habitable planets,” Boss said. “Understanding the mixing and transport processes that occur around Sun-like stars could give us clues about which of their surrounding planets might have conditions similar to our own.”

Original Story Source: Carnegie Institution for Science Press Release

Pulled Apart By Black Hole Heart

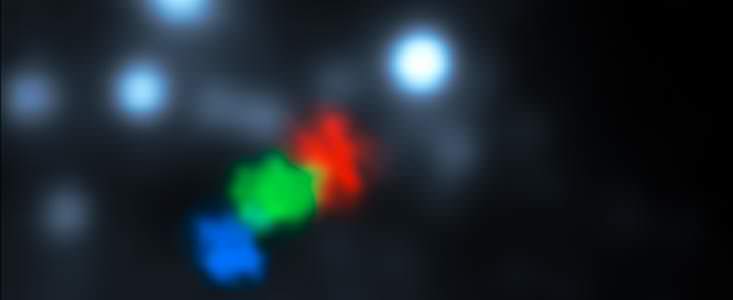
New observations from ESO’s Very Large Telescope show for the first time a gas cloud being ripped apart by the supermassive black hole at the centre of the galaxy. Shown here are VLT observations from 2006, 2010 and 2013, coloured blue, green and red respectively. Credit: ESO/S. Gillessen

If you thought all was reasonably quiet at the center of the Milky Way, you’d be wrong. Of course, you knew there was a black hole waiting… but did you know the ESO’s Very Large Telescope has seen a cloud of gas being ripped apart by its influence? Thanks to new observations, we’re able to see – in real time – a gaseous region so stretched that its leading edge has reached the event horizon and it’s retreating from the black hole at more than 10 million km/h while the trailing end is still falling inward!

Just two years ago, the VLT observed a gas cloud several times the mass of Earth making haste towards the Milky Way’s central black hole… an oblivion which dwarfs the cloud by about a trillion times. Right now the plucky cloud has reached its closest approach and “spaghettification” has began. The vaporous vagabond is being stretched out of proportion by the black hole’s gravitational field.

“The gas at the head of the cloud is now stretched over more than 160 billion kilometres around the closest point of the orbit to the black hole. And the closest approach is only a bit more than 25 billion kilometres from the black hole itself — barely escaping falling right in,” explains Stefan Gillessen (Max Planck Institute for Extraterrestrial Physics, Garching, Germany) who led the observing team. “The cloud is so stretched that the close approach is not a single event but rather a process that extends over a period of at least one year.”

At this point, the gas cloud is becoming so thin that its light is difficult to detect. However, by using the SINFONI instrument on the VLT, researchers took 20 hours of exposure time with the integral field spectrometer and were able to measure the velocity of various regions of the gas cloud as it blazes by the black hole.

“The most exciting thing we now see in the new observations is the head of the cloud coming back towards us at more than 10 million km/h along the orbit — about 1% of the speed of light,” adds Reinhard Genzel, leader of the research group that has been studied this region for nearly twenty years. “This means that the front end of the cloud has already made its closest approach to the black hole.”

Loading player…

Where the gas cloud originated is anyone’s guess – but there are suggestions. Possibilities include jets from the galactic center, or stellar winds from orbiting stars. There may have once been a star in the center of the cloud, and the gas may have been a product of its winds or even a protoplanetary disk. In any circumstance, these new observations help to sort out the variety of possibilities.

“Like an unfortunate astronaut in a science fiction film, we see that the cloud is now being stretched so much that it resembles spaghetti. This means that it probably doesn’t have a star in it,” concludes Gillessen. “At the moment we think that the gas probably came from the stars we see orbiting the black hole.”

It’s an exciting time to be an astronomer. Through the “eyes” of the VLT, researchers the world over are able to watch a very unique event as it happens and not after the fact. ” This intense observing campaign will provide a wealth of data, not only revealing more about the gas cloud, but also probing the regions close to the black hole that have not been previously studied and the effects of super-strong gravity.”

As this drama at the heart of the Milky Way unfolds, astronomers are able to witness its many changes – “from purely gravitational and tidal to complex, turbulent hydrodynamics.”

Original Story Source: ESO News Release.

Neutron Stars: A Cataclysmic Conception

This "SWASI" phenomenon is an analogue of the SASI instability occurring in the supernova core, but it is one million times smaller and about one hundred times slower than its astrophysical counterpart. (Image copyrights: Thierry Foglizzo, Laboratoire AIM Paris-Saclay, CEA)

It’s one of the most intense and violent of all events in space – a supernova. Now a team of researchers at the Max Planck Institute for Astrophysics have been taking a very specialized look at the formation of neutron stars at the center of collapsing stars. Through the use of sophisticated computer simulations, they have been able to create three-dimensional models which show the physical effects – intense and violent motions which occur when stellar matter is drawn inward. It’s a bold, new look into the dynamics which happen when a star explodes.

As we know, stars which have eight to ten times the mass of the Sun are destined to end their lives in a massive explosion, the gases blown into space with incredible force. These cataclysmic events are among the brightest and most powerful events in the Universe and can outshine a galaxy when they occur. It is this very process which creates elements critical to life as we know it – and the beginnings of neutron stars.

Neutron stars are an enigma unto themselves. These highly compact stellar remnants contain as much as 1.5 times the mass of the Sun, yet are compressed to the size of a city. It is not a slow squeeze. This compression happens when the stellar core implodes from the intense gravity of its own mass… and it takes only a fraction of a second. Can anything stop it? Yes. It has a limit. Collapse ceases when the density of the atomic nuclei is exceeded. That’s comparable to around 300 million tons compressed into something the size of a sugar cube.

Studying neutron stars opens up a whole new dimension of questions which scientists are keen to answer. They want to know what causes stellar disruption and how can the implosion of the stellar core revert to an explosion. At present, they theorize that neutrinos may be a critical factor. These tiny elemental particles are created and expelled in monumental numbers during the supernova process and may very well act as heating elements which ignite the explosion. According to the research team, neutrinos could impart energy into the stellar gas, causing it to build up pressure. From there, a shock wave is created and as it speeds up, it could disrupt the star and cause a supernova.

As plausible as it might sound, astronomers aren’t sure if this theory could work or not. Because the processes of a supernova cannot be recreated under laboratory conditions and we’re not able to directly see into the interior of a supernovae, we’ll just have to rely on computer simulations. Right now, researchers are able to recreate a supernova event with complex mathematical equations which replicate the motions of stellar gas and the physical properties which happen at the critical moment of core collapse. These types of computations require the use of some of the most powerful supercomputers in the world, but it has also been possible to use more simplified models to get the same results. “If, for example, the crucial effects of neutrinos were included in some detailed treatment, the computer simulations could only be performed in two dimensions, which means that the star in the models was assumed to have an artificial rotational symmetry around an axis.” says the research team.

With the support of the Rechenzentrum Garching (RZG), scientists were able to create in a singularly efficient and fast computer program. They were also given access to most powerful supercomputers, and a computer time award of nearly 150 million processor hours, which is the greatest contingent so far granted by the “Partnership for Advanced Computing in Europe (PRACE)” initiative of the European Union, the team of researchers at the Max Planck Institute for Astrophysics (MPA) in Garching could now for the first time simulate the processes in collapsing stars in three dimensions and with a sophisticated description of all relevant physics.

“For this purpose we used nearly 16,000 processor cores in parallel mode, but still a single model run took about 4.5 months of continuous computing”, says PhD student Florian Hanke, who performed the simulations. Only two computing centers in Europe were able to provide sufficiently powerful machines for such long periods of time, namely CURIE at Très Grand Centre de calcul (TGCC) du CEA near Paris and SuperMUC at the Leibniz-Rechenzentrum (LRZ) in Munich/Garching.

Turbulent evolution of a neutron star for six moments (0.154, 0.223, 0.240, 0.245, 0.249 and 0.278 seconds) after the beginning of the neutron star formation in a threedimensional computer simulation. The mushroom-like bubbles are characteristic of "boiling" neutrino-heated gas, whereas simultaneously the "SASI" instability causes wild sloshing and rotational motions of the whole neutrino-heated layer (red) and of the enveloping supernova shock (blue) . (Images by Elena Erastova and Markus Rampp, RZG)
Turbulent evolution of a neutron star for six moments (0.154, 0.223, 0.240, 0.245, 0.249 and 0.278 seconds) after the beginning of the neutron star formation in a threedimensional computer simulation. The mushroom-like bubbles are characteristic of “boiling” neutrino-heated gas, whereas simultaneously the “SASI” instability causes wild sloshing and rotational motions of the whole neutrino-heated layer (red) and of the enveloping supernova shock (blue) . (Images by Elena Erastova and Markus Rampp, RZG)
Given several thousand billion bytes of simulation data, it took some time before researchers could fully understand the implications of their model runs. However, what they saw both elated and surprised them. The stellar gas performed in a manner very much like ordinary convection, with the neutrinos driving the heating process. And that’s not all… They also found strong sloshing motions which transiently change to rotational motions. This behavior has been observed before and named Standing Accretion Shock Instability. According to the news release, “This term expresses the fact that the initial sphericity of the supernova shock wave is spontaneously broken, because the shock develops large-amplitude, pulsating asymmetries by the oscillatory growth of initially small, random seed perturbations. So far, however, this had been found only in simplified and incomplete model simulations.”

“My colleague Thierry Foglizzo at the Service d’ Astrophysique des CEA-Saclay near Paris has obtained a detailed understanding of the growth conditions of this instability”, explains Hans-Thomas Janka, the head of the research team. “He has constructed an experiment, in which a hydraulic jump in a circular water flow exhibits pulsational asymmetries in close analogy to the shock front in the collapsing matter of the supernova core.” Known as Shallow Water Analogue of Shock Instability, the dynamic process can be demonstrated in less technicalized manners by eliminating the important effects of neutrino heating – a reason which causes many astrophysicists to doubt that collapsing stars might go through this type of instability. However, the new computer models are able to demonstrate the Standing Accretion Shock Instability is a critical factor.

“It does not only govern the mass motions in the supernova core but it also imposes characteristic signatures on the neutrino and gravitational-wave emission, which will be measurable for a future Galactic supernova. Moreover, it may lead to strong asymmetries of the stellar explosion, in course of which the newly formed neutron star will receive a large kick and spin”, describes team member Bernhard Müller the most significant consequences of such dynamical processes in the supernova core.

Are we finished with supernova research? Do we understand everything there is to know about neutron stars? Not hardly. At the present time, the scientist are ready to further their investigations into the measurable effects connected to SASI and refine their predictions of associated signals. In the future they will further their understanding by performing more and longer simulations to reveal how instability and neutrino heating react together. Perhaps one day they’ll be able to show this relationship to be the trigger which ignites a supernova explosion and conceives a neutron star.

Original Story Source: Max Planck Institute for Astrophysics News Release.

Astronomers Spy Early Galaxies Caught In A Cosmic Spiderweb

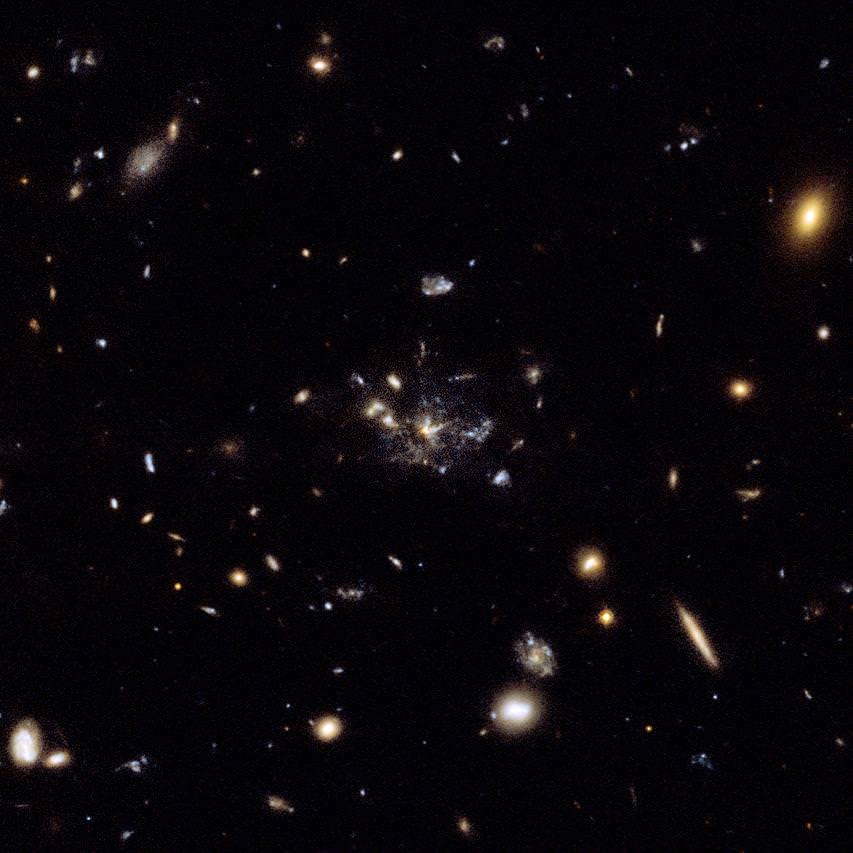
The Spiderweb, imaged by the Hubble Space Telescope – a central galaxy (MRC 1138-262) surrounded by hundreds of other star-forming 'clumps'. Credit: NASA, ESA, George Miley and Roderik Overzier (Leiden Observatory)

Once upon a time, when the Universe was just about three billion years old, galaxies started to form. Now astronomers using a CSIRO radio telescope have captured evidence of the raw materials these galaxies used to fashion their first stars… cold molecular hydrogen gas, H2. Even though we can’t see it directly, we know it is there by using another gas that reveals its presence – carbon monoxide (CO) – a radio wave emitter.

The telescope is CSIRO’s Australia Telescope Compact Array telescope near Narrabri, NSW. “It one of very few telescopes in the world that can do such difficult work, because it is both extremely sensitive and can receive radio waves of the right wavelengths,” says CSIRO astronomer Professor Ron Ekers.

One of the studies of these “raw” galaxies was performed by astronomer Dr. Bjorn Emonts of CSIRO Astronomy and Space Science. He and fellow researchers employed the Compact Array to observe and record a gigantic and distant amalgamation of “star forming clumps or proto-galaxies” which are congealing together to create a single massive galaxy. This framework is known as the “Spiderweb” and is theorized to be at least ten thousand million light years distant. The Compact Array radio telescope is capable of picking up the signature of star formation, giving astronomers vital clues about how early galaxies began star formation.

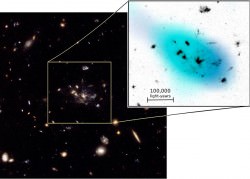
In blue, the carbon monoxide gas detected in and around the Spiderweb. Credit: B. Emonts et al (CSIRO/ATCA)
The “Spiderweb” was loaded. Here Dr. Emont and his colleagues found the molecular hydrogen gas fuel they were seeking. It covered an area of space almost a quarter of a million light-years across and contained at least sixty thousand million times the mass of the Sun! Surely this had to be the material responsible for the new stars seen sprinkled across the region. “Indeed, it is enough to keep stars forming for at least another 40 million years,” says Emonts.

In another research project headed by Dr. Manuel Aravena of the European Southern Observatory, the scientists measured the CO – the indicator of H2 – in two very distant galaxies. The signal of the faint radio waves was amped up by the gravitational fields of the additional galaxies – the “line of sight” members – which created gravitational lensing. Says Dr. Aravena, “This acts like a magnifying lens and allows us to see even more distant objects than the Spiderweb.”

Dr. Aravena’s team went to work measuring the amount of H2 in both of their study galaxies. One of these, SPT-S 053816-5030.8, produced enough radio emissions to allow them to infer how quickly it was forming stars – “an estimate independent of the other ways astronomers measure this rate.”

The Compact Array was tuned in. Thanks to an upgrade which increased its bandwidth – the amount of the radio spectrum which can be observed at any particular time – it is now sixteen times stronger and capable of reaching a range from 256 MHz to 4 GHz. That makes it a very sensitive ear!

“The Compact Array complements the new ALMA telescope in Chile, which looks for the higher-frequency transitions of CO,” says Ron Ekers.

Original Story Source: CSIRO News Release

Dust In The Wind… Black Hole Style

This artist’s impression shows the surroundings of the supermassive black hole at the heart of the active galaxy NGC 3783 in the southern constellation of Centaurus (The Centaur). Credit: ESO/M. Kornmesser

Over the years, researchers have taken myriad observations of black holes and their environs, but now ESO’s Very Large Telescope Interferometer is giving us the most detailed look of the dust around a black hole at the center of an active galaxy ever obtained. Originally expected to be contained within the ring-shaped torus around the black hole, the observation held a surprise as astronomers discovered that a significant amount of the dust was located both above and below the torus. What can this mean? According to the latest findings and contrary to popular theory, it is possible the dust is being evacuated from the region as a cool wind.

For the last two decades, astronomers have discovered that nearly all galaxies harbor a black hole at their hearts. In many cases, these monsters increase in size by accreting matter from the immediate vicinity. This, in turn, is responsible for the creation of active galactic nuclei (AGN), one of the most energetic objects in the Universe. Surrounding the super-luminous giants are rings of cosmic dust which originate from space – drawn in like water swirling down a dark drain. According to theory, the intense infrared radiation exerted by AGN must have originated from these dusty eddies.

Thanks to the powerful eye of the Very Large Telescope Interferometer (VLTI) at ESO’s Paranal Observatory in Chile, astronomers have now seen something new in a nearby active galaxy cataloged as NGC 3783. While they observed the expected hot dust clocking in at some 700 to 1000 degrees Celsius, what they also observed confounded them… Huge amounts of cooler dust both above and below the main torus.

As Sebastian Hönig (University of California Santa Barbara, USA and Christian-Albrechts-Universität zu Kiel, Germany), lead author of the paper presenting the new results, explains, “This is the first time we’ve been able to combine detailed mid-infrared observations of the cool, room-temperature dust around an AGN with similarly detailed observations of the very hot dust. This also represents the largest set of infrared interferometry for an AGN published yet.”

Is this a black hole teething ring? From their observations, the researchers suspect the newly-discovered dust is flowing outward from the central black hole. This means the wind most likely plays a critical part in the tangled relationship of both the black hole and its surroundings. Apparently the black hole pulls immediate material into it, but the incredible amount of radiation this produces also seems to be pushing it away. Scientists are far from clear as to how these two processes work together, but the discovery of this dusty wind could lead to a better understanding of their evolution.

To get the resolution needed to study the core area of NGC 3783, astronomers needed to use the combined power of the Unit Telescopes of ESO’s Very Large Telescope. Through this union, an interferometer is created – one capable of “seeing” with the equivalent of a 130-meter telescope.

Another team member, Gerd Weigelt (Max-Planck-Institut für Radioastronomie, Bonn, Germany), explains, “By combining the world-class sensitivity of the large mirrors of the VLT with interferometry we are able to collect enough light to observe faint objects. This lets us study a region as small as the distance from our Sun to its closest neighbouring star, in a galaxy tens of millions of light-years away. No other optical or infrared system in the world is currently capable of this.”

What do these new observations mean to the world of astronomy? It might very well change the pattern of how we currently understand AGN. With proof that dust is being expelled by intense radiation, new models must be created – models which include this recent information of how dust can be distributed.

Hönig concludes, “I am now really looking forward to MATISSE, which will allow us to combine all four VLT Unit Telescopes at once and observe simultaneously in the near- and mid-infrared — giving us much more detailed data.” MATISSE, a second generation instrument for the VLTI, is currently under construction.

Original Story Source: ESO News Release.

Stacking Galactic Signals Reveals A Clearer Universe

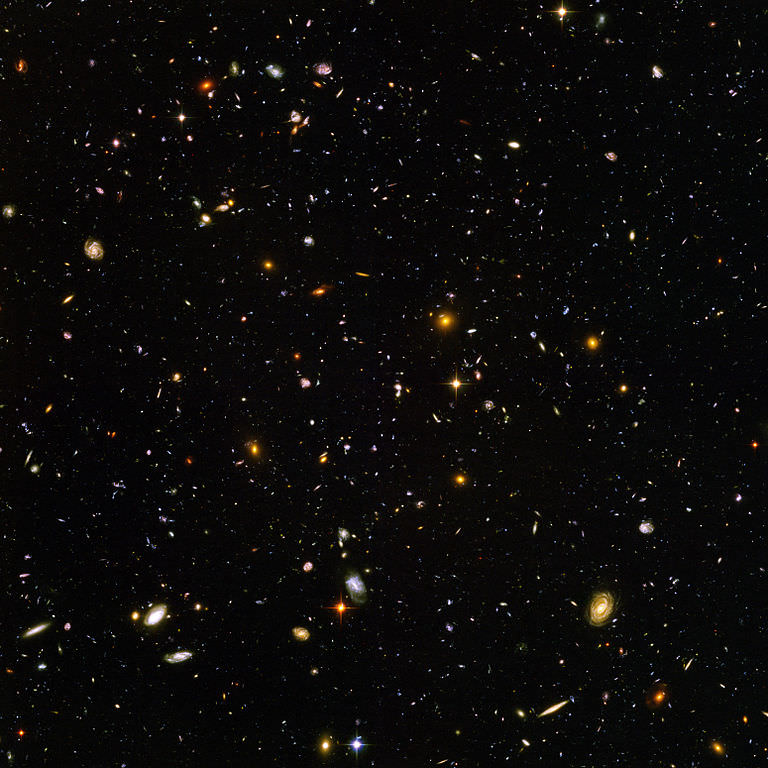
Jacinta studies distant galaxies like those shown in this image from the Hubble Space Telescope, using the new 'stacking' technique to gather information only available through radio telescope observations. Credit: NASA, STScI, and ESA.

Very similar to stacking astronomy images to achieve a better picture, researchers from the International Centre for Radio Astronomy Research (ICRAR) are employing new methods which will give us a clearer look at the history of the Universe. Through data taken with the next generation of radio telescopes like the Square Kilometer Array (SKA), scientists like Jacinta Delhaize can “stack” galactic signals en masse to study one of their most important properties… how much hydrogen gas is present.

Probing the cosmos with a telescope is virtually using a time machine. Astronomers are able to look back at the Universe as it appeared billions of years ago. By comparing the present with the past, they are able to chart its history. We can see how things have changed over the ages and speculate about the origin and future of the vastness of space and all its many wonders.

“Distant, younger, galaxies look very different to nearby galaxies, which means that they’ve changed, or evolved, over time,” said Delhaize. “The challenge is to try and figure out what physical properties within the galaxy have changed, and how and why this has happened.”

According to Delhaize a vital clue to solving the riddle lay in hydrogen gas. By understanding how much of it that galaxies contained will help us map their history.

“Hydrogen is the building block of the Universe, it’s what stars form from and what keeps a galaxy ‘alive’,” said Delhaize.

“Galaxies in the past formed stars at a much faster rate than galaxies now. We think that past galaxies had more hydrogen, and that might be why their star formation rate is higher.”

Jacinta Delhaize with CSIRO's Parkes Radio Telescope during one of her data collecting trips. Credit: Anita Redfern Photography.
Jacinta Delhaize with CSIRO’s Parkes Radio Telescope during one of her data collecting trips. Credit: Anita Redfern Photography.
When it comes to distant galaxies, they don’t give up their information easily. Even so, it was a task that Delhaize and her supervisors were determined to observe. The faint radio signals of hydrogen gas were nearly impossible to detect, but the new stacking method allowed the team to collect enough data for her research. By combining the weak signals of thousands of galaxies, Delhaize then “stacked” them to create a stronger, averaged signal,

“What we are trying to achieve with stacking is sort of like detecting a faint whisper in a room full of people shouting,” said Delhaize. “When you combine together thousands of whispers, you get a shout that you can hear above a noisy room, just like combining the radio light from thousands of galaxies to detect them above the background.”

However, it wasn’t a slow process. The researchers engaged CSIRO’s Parkes Radio Telescope for 87 hours and surveyed a large region of galactic landscape. Their work collected signals from hydrogen over a vast amount of space and stretched back over two billion years in time.

“The Parkes telescope views a big section of the sky at once, so it was quick to survey the large field we chose for our study,” said ICRAR Deputy Director and Jacinta’s supervisor, Professor Lister Staveley-Smith.

Stacking up a clearer picture of the Universe from ICRAR on Vimeo.

As Delhaize explains, observing such a massive volume of space means more accurate calculations of the average amount of hydrogen gas present in particular galaxies at a certain distance from Earth. These readings correspond to a given period in the history of the Universe. With this data, simulations can be created to depict the Universe’s evolution and give us a better understanding of how galaxies formed and evolved with time. What’s even more spectacular is that next generation telescopes like the international Square Kilometre Array (SKA) and CSIRO’s Australian SKA Pathfinder (ASKAP) will be able to observe even larger volumes of the Universe with higher resolution.

“That makes them fast, accurate and perfect for studying the distant Universe. We can use the stacking technique to get every last piece of valuable information out of their observations,” said Delhaize. “Bring on ASKAP and the SKA!”.

Original Story Source: International Centre for Radio Astronomy Research.

ALMA and the Comet Factory

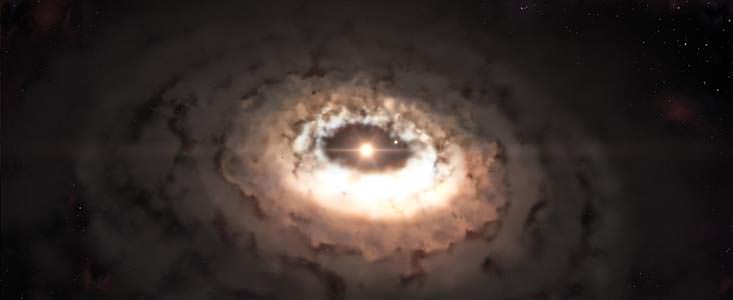
This artist’s impression shows the dust trap in the system Oph-IRS 48. The dust trap provides a safe haven for the tiny rocks in the disc, allowing them to clump together and grow to sizes that allow them to survive on their own. Credit: ESO/L. Calçada

“Ooompah, loompah, roopity rust… ALMA finds comets hiding in dust.” According to many studies over recent years, astronomers are aware planets seem to be everywhere around stars. However, just how these rocky bodies, including comets, are created is something of an enigma. Now, thanks to one sweet telescope, the Atacama Large Millimeter/submillimeter Array (ALMA), science has taken a big step forward in understanding how minuscule dust grains in a protoplanetary disk can one day evolve into a larger format.

A little less than 400 light years from Earth is a youthful solar system cataloged as Oph IRS 48. In images taken of its outer perimeters, astronomers have picked up a vital clue in its swirling masses of dust – a crescent-shaped region dubbed a “dust trap”. Researchers feel this area may be a protective cocoon which allows rocky formations to take shape. Why is such a region important? It’s the smash-factor. When astronomers try to model dust to rocky formations, they have found the particles self-destruct… either by crashing into each other, or being drawn into the central star. In order for them to progress past a certain size, they simply must have an area of protection to allow them to grow.

“There is a major hurdle in the long chain of events that leads from tiny dust grains to planet-sized objects,” said Til Birnstiel, a researcher at the Harvard-Smithsonian Center for Astrophysics in Cambridge, Mass., and co-author on the paper published in the journal Science. “In computer models of planet formation, dust grains must grow from submicron sizes to objects up to ten times the mass of the Earth in just a few million years. But once particles grow larger enough, they begin to pick up speed and either collide, sending them back to square one, or slowly drift inward, thwarting further growth.”

So where can a newborn planet, comet or asteroid hide? Nienke van der Marel, a PhD student at Leiden Observatory in the Netherlands, and lead author of the article, was using ALMA along with her co-workers, to take a close look at Oph IRS 48 and discovered a torus of gas with a central hole. This absence of dust particles was very different from earlier results picked up on ESO’s Very Large Telescope.

“At first the shape of the dust in the image came as a complete surprise to us,” says van der Marel. “Instead of the ring we had expected to see, we found a very clear cashew-nut shape! We had to convince ourselves that this feature was real, but the strong signal and sharpness of the ALMA observations left no doubt about the structure. Then we realised what we had found.”

A surprise? You bet. What the team uncovered was a region where large dust grains remained captive and could continue to gain mass as more and more grains collided and melded together. Here was the “dust trap” which theorists predicted.

Loading player…

So what makes it up? To keep the dust grains together and forming requires a vortex – an area of high pressure to protect them. To form this vortex, there needs to be a large object present, either a companion star or a gas-giant. Like a boat sluicing through algae-filled waters, the secondary object in the planetary disk would clear a path in its wake, producing the critical eddies and vortices needed to fashion the dust trap. While previous studies of Oph IRS 48 uncovered a rigid ring of carbon monoxide gas combined with dust, there was no observed “trap”. However, that doesn’t mean the observation was negative. Astronomers also uncovered a gap between the inner and outer portions of the solar system – a clue to the presence of the necessary large body.

The conditions were right for a possible dust trap. Enter ALMA. Now the researchers were able to see both the gas and larger dust grains at the same time. These new observations led to a discovery no other telescope had yet revealed… a lopsided bulge in the outer portion of the disk.

As van der Marel explains: “It’s likely that we are looking at a kind of comet factory as the conditions are right for the particles to grow from millimetre to comet size. The dust is not likely to form full-sized planets at this distance from the star. But in the near future ALMA will be able to observe dust traps closer to their parent stars, where the same mechanisms are at work. Such dust traps really would be the cradles for new-born planets.”

As larger particles migrate towards the areas of higher pressure, the dust trap takes shape. To validate their findings the researchers employed computer modeling to show that a high pressure region could arise from the motion of the gas at the opening edges. It matches with the observation of the Oph IRS 48 disc.

“The combination of modelling work and high quality observations of ALMA makes this a unique project”, says Cornelis Dullemond from the Institute for Theoretical Astrophysics in Heidelberg, Germany, who is an expert on dust evolution and disc modelling, and a member of the team. “Around the time that these observations were obtained, we were working on models predicting exactly these kinds of structures: a very lucky coincidence.”

“This structure we see with ALMA could be scaled down to represent what may be happening in the inner solar system where more Earth-like rocky planets would form,” said Birnstiel. “In the case of these observations, however, we may be seeing something analogous to the formation of our Sun’s Kuiper Belt or Oort Cloud, the region of our solar system where comets are believed to originate.”

Like that dream factory of our childhood, ALMA is still under construction. These unique observations were taken with the ALMA Band 9 receivers – European-made instrumentation which permits ALMA to deliver its sharpest, most detailed images so far.

“These observations show that ALMA is capable of delivering transformational science, even with less than half of the full array in use,” says Ewine van Dishoeck of the Leiden Observatory, who has been a major contributor to the ALMA project for more than 20 years. “The incredible jump in both sensitivity and image sharpness in Band 9 gives us the opportunity to study basic aspects of planet formation in ways that were simply not possible before.”

Original Story Source: ESO News Release. For further reading: NRAO News Release.

Black Hole Secrets: Revealing The S-Star

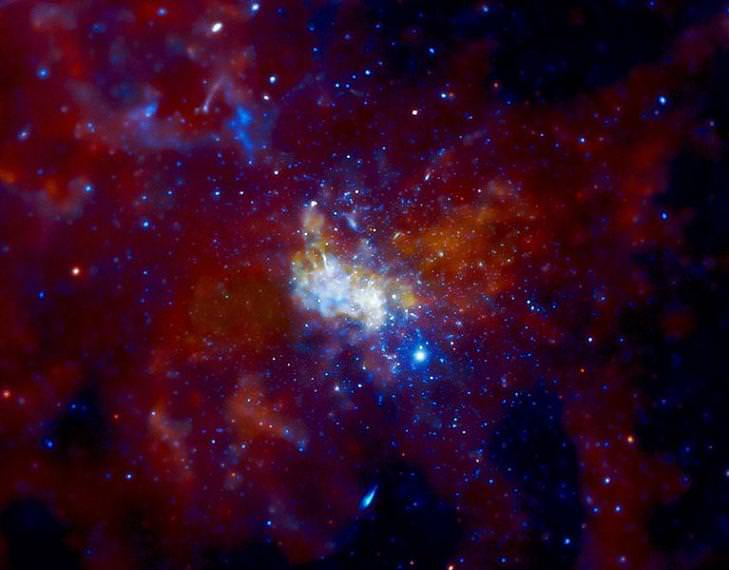
Sgr A Chandra Image Courtesy of NASA/CXC/MIT/F. Baganoff, R. Shcherbakov et al.

Deep in the heart of the Milky Way resides a black hole. However, that is not the mysterious object which scientists Fabio Antonini, of the Canadian Institute for Theoretical Astrophysics, and David Merritt, of the Rochester Institute of Technology, have been endeavoring to explain. The objects of their attention are the orbits of massive young stars which attend it. They are called “S-stars”.

No. That’s not a stutter. S-Stars are a legitimate phenomenon which enable researchers to even more closely examine black hole activity. Their very presence causes astronomers to question what they know. For example, how is it possible for these massive young stars to orbit so close to a region where it would be highly unlikely for them to form there? The sheer force of the strong gravity near a black hole means these stars had to have once been further away from their observed position. However, when theoreticians created models to depict how S-stars might have traveled to their current orbital positions, the numbers simply didn’t match up. How could their orbits be so radically removed from predictions?

Today, Dr. Antonini offered his best explanation of this enigma at the annual meeting of the Canadian Astronomical Society (CASCA). In “The Origin of the S-star Cluster at the Galactic Center,” he gave a unified theory for the origin and dynamics of the S-stars. It hasn’t been an easy task, but Antonini has been able to produce a very viable theory of how these stars were able to get in close proximity to a supermassive black hole in only tens of millions of years since their formation.

“Theories exist for how migration from larger distances has occurred, but have up until now been unable to convincingly explain why the S-stars orbit the galactic center the way they do,” Antonini said. “As main-sequence stars, the S-stars cannot be older than about 100 million years, yet their orbital distribution appears to be ‘relaxed’, contrary to the predictions of models for their origin.”

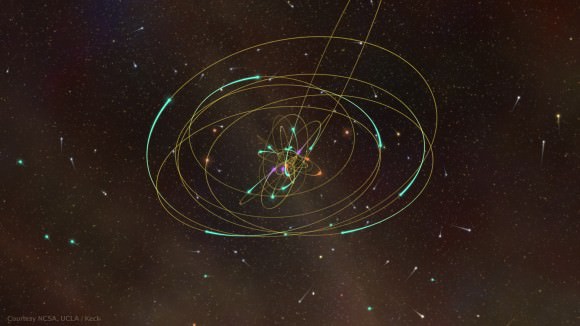
3-dimensional visualization of the stellar orbits in the Galactic center based on data obtained by the W. M. Keck Telescopes between 1995 and 2012. Stars with the best determined orbits are shown with full ellipses and trails behind each star span ~15-20 years. These stars are color-coded to represent their spectral type: Early-type (young) stars are shown in teal green, late-type (old) stars are shown in orange, and those with unknown spectral type are shown in magenta. Stars without ellipses are from a statistical sample and follow the observed radial distributions for the early (white) or late (yellow/orange) type stars. These stars are embedded in a model representation of the inner Milky Way provided by NCSA/AVL to provide context for the visualization.

According to Antonini and Merritt’s model, S-stars began much further away from the galactic center. Normal? Yep. Normal mode. Then these seemingly normal orbiting stars encountered the black hole’s gravity and began their spiral inward. As they made the inexorable trek, they then encountered the gravity of other stars in the vicinity which then changed the S-stars orbital pattern. It’s a simple insight, and one that verifies how the galactic center evolves from the conjoined influence of a supermassive black holes relativistic effects and the handiwork of gravitational interactions.

“Theoretical modeling of S-star orbits is a means to constrain their origin, to probe the dynamical mechanisms of the region near the galactic center and,” says Merritt, “indirectly to learn about the density and number of unseen objects in this region.”

Although the presence of supermassive black holes at the center of nearly all massive galaxies isn’t a new concept, further research into how they take shape and evolve leads to a better understanding of what we see around them. These regions are deeply connected to the very formation of the galaxy where they exist. With the center of our own galaxy – Sagittarius A – so near to home, it has become the perfect laboratory to observe manifestations such as S-stars. Tracking their orbits over an extended period of time has validated the presence of a supermassive black hole and enlightened our thinking of our own galaxy’s many peculiarities.

Original Story Source: Canadian Astronomical Society Press Release