Aliens Hanging Out in the Kuiper Belt? We Could See the Light from their Cities

Astronaut photograph ISS025-E-9858 was acquired on October 28, 2010, with a Nikon D3S digital camera using a 16 mm lens, and is provided by the ISS Crew Earth Observations experiment and Image Science & Analysis Laboratory, Johnson Space Center. The image was taken by the Expedition 25 crew.

[/caption]

When it comes to searching for ET, current efforts have been almost exclusively placed in picking up a radio signal – just a small portion of the electromagnetic spectrum. Consider for a moment just how much lighting we here on Earth produce and how our “night side” might appear as viewed from a telescope on another planet. If we can assume that alternate civilizations would evolve enjoying their natural lighting, wouldn’t it be plausible to also assume they might develop artificial lighting sources as well?

Is it possible for us to peer into space and spot artificially illuminated objects “out there?” According to a new study done by Abraham Loeb (Harvard), Edwin L. Turner (Princeton), the answer is yes.

For gathering light, the array of Earthly telescopes now at science’s disposal are able to confidently observe a light source comparable in overall brightness to a large city — up to a certain distance. Right now astronomers are able to measure the orbital parameters of Kuiper belt objects (KBOs) with the greatest of precision by their observed flux and computing their changing orbital distances.

However, is it possible to see light if it were to occur on the dark side? Loeb and Turner say that current optical telescopes and surveys would have the ability to see this amount of light at the edge of our Solar System and observations with large telescopes can measure a KBOs spectra to determine if they are illuminated by artificial lighting using a logarithmic slope (sunlit object would exhibit alpha=(dlogF/dlogD) = -4, whereas artificially-illuminated objects should exhibit alpha = -2.)

“Our civilization uses two basic classes of illumination: thermal (incandescent light bulbs) and quantum (light emitting diodes [LEDs] and fluorescent lamps)” Loeb and Turn write in their paper. “Such artificial light sources have different spectral properties than sunlight. The spectra of artificial lights on distant objects would likely distinguish them from natural illumination sources, since such emission would be exceptionally rare in the natural thermodynamic conditions present on the surface of relatively cold objects. Therefore, artificial illumination may serve as a lamppost which signals the existence of extraterrestrial technologies and thus civilizations.”

Spotting this illumination difference in the optical band would be tricky but by calculating the observed flux from solar illumination on Kuiper Belt Objects with a typical albedo, the team is confident that existing telescopes and surveys could detect the artificial light from a reasonably brightly illuminated region, roughly the size of a terrestrial city, located on a KBO. Even though the light signature would be weaker, it would still carry the dead give-away – the spectral signature.

However, we currently don’t expect there to be any civilizations thriving at the edge of our solar system, as it is dark and cold out there.

But Loeb has posed that possibly planets ejected from other parent stars in our galaxy may have traveled to the edge of our Solar System and ended up residing there. Whether a civilization would survive an ejection event from their parent system, and then put up lamposts is up for debate, however.

The team isn’t suggesting that any random light source detected where there should be darkness might be considered a sign of life, though. There are many factors which could contribute to illumination, such as viewing angle, backscattering, surface shadowing, outgassing, rotation, surface albedo variations and more. this is just a new suggestion and a new way of looking at things, as well as suggested exercises for future telescopes and studying exoplanets.

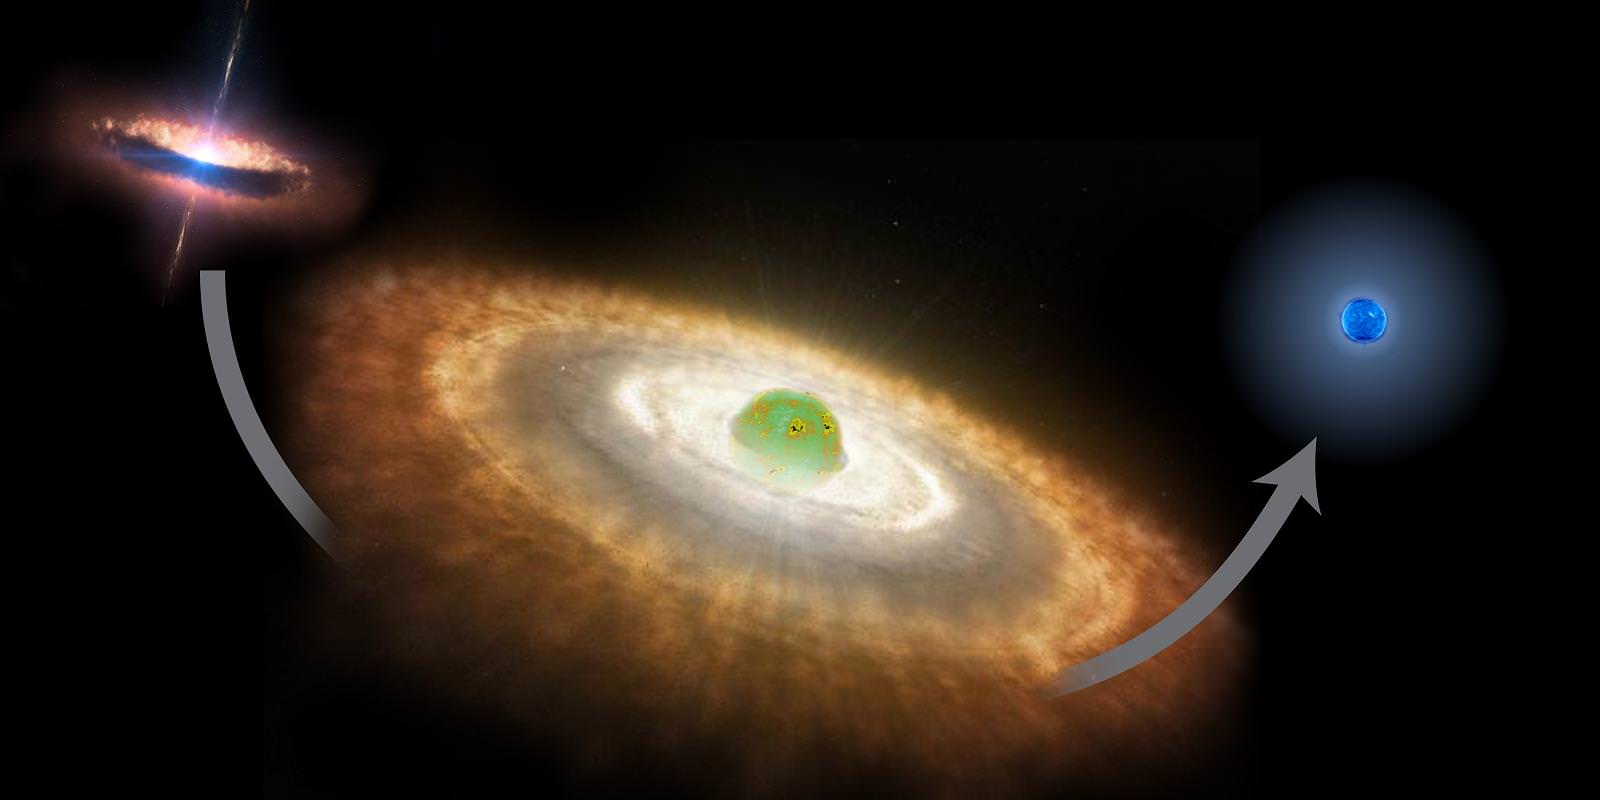
“City lights would be easier to detect on a planet which was left in the dark of a formerly-habitable zone after its host star turned into a faint white dwarf,” Loeb and Turner say. “The related civilization will need to survive the intermediate red giant phase of its star. If it does, separating its artificial light from the natural light of a white dwarf, would be much easier than for the original star, both spectroscopically and in total brightness.”

The next generation of optical and space-based telescopes could help to refine the search process when observing extra-solar planets and preliminary broad-band photometric detection could be improved through the use of narrow-band filters which are tuned to the spectral features of artificial light sources such as light emitting diodes. While such a scenario on a distant world would need to involve far more “light pollution” than even we produce – why rule it out?

“This method opens a new window in the search for extraterrestrial civilizations,” Loeb and Turner write. “The search can be extended beyond the Solar System with next generation telescopes on the ground and in space, which would be capable of detecting phase modulation due to very strong artificial illumination on the night-side of planets as they orbit their parent stars.”

Read Loeb and Turner’s paper: Detection Technique for Artificially-Illuminated Objects in the Outer Solar System and Beyond.

This article was inspired by a discussion on Google+.

Nancy Atkinson also contributed to this article.

Geminid Meteor Shower Reminder and There’s An App For That!

2011 Geminids in the Winter Triangle. Image Courtesy of John Chumack

[/caption]

Have you been watching the Geminid Meteor Shower? With just hours to go before the peak, activity has been high – despite this year’s Moon! If you’d like to know more on the history of this meteor shower, then check out this great article by Adrian West. If you plan on watching and would like to do something cool and unusual, then step inside…

As you can see from this below video sent to us by John Chumack, even the bright moonlight isn’t interfering too badly with this year’s awesome Geminid meteor shower display. While it will make the fainter ones more difficult to observe, the “fireball” attitude of this meteor shower just won’t quit!

As a reminder, be sure to be out tonight and through tomorrow morning for the peak of the show. You’ll want to try when the skies are the darkest, begin before moonrise – but don’t forget the display is usually the greatest around 2:00 a.m. local time when the sky window is pointed in the optimum direction. Just look along the ecliptic plane and follow the constellation of Gemini as it cruises roughly east to west across the sky as the night goes on! If you get clouded out? Try again the next night… and the next. The stream for the Geminids is very broad and lasts for some time.

Now… if you really want to have some fun and have an iPhone, here’s a real treat…

Thanks to NASA, there’s a new application which will help you to track, count and record information about this meteor shower and any meteor shower in the world – including sporadic ones! The “Meteor Counter” app will allow you to record your observations with an easy-to-use “piano key” interface. As you strike the keys, the app records information for each meteor, including the brightness and time. Once your observing session ends, your information and data is automatically uploaded to NASA researchers for analysis.

Created by Dr. Bill Cooke, head of NASA’s Meteoroid Environment Office at NASA’s Marshall Space Flight Center and the one-and-only Dr. Tony Phillips of SpaceWeather.com, this new iPhone application is going to change the way you observe and help science, too. “We developed the iPhone app to be fun, and informative, but also to encourage going outside to observe the sky,” said Cooke. “Our hope is the app will be useful for amateur and professional astronomers — we want to include their observations in NASA’s discoveries — and have them share in the excitement of building a knowledge base about meteor showers.”

The app is more than just a set of keys, though… It has an optional recorded audio track and users can even add their own comments as they observe. This will all be sent to NASA along with the numbers – vital information which will help researchers identify meteors associated with specific radiants and one-time events. The “Meteor Counter” was designed with everyone in mind – from the beginner to the expert – and even those who have never seen a meteor before. “The beauty is that it gradually transforms novices into experts,“ says Cooke. “As an observer gains experience , we weigh their data accordingly in our analyses.”

The Meteor Counter app is also much more. It provides a newsfeed and event calendar that’s kept up-to-the-moment by professional NASA and meteor scientists, and it will help keep you informed of upcoming meteor showers and the most current sightings. The app is currently available for iPhone, iPad and iPod Touch. Download the free app at : http://itunes.apple.com/us/app/meteor-counter/id466896415. A version for other mobile devices will be available in the near future. Complete instructions for using the Meteor Counter app is available at: http://meteorcounter.com/ and more information about NASA’s Meteoroid Environment Office can be found at: http://www.nasa.gov/offices/meo/home/index.html.

Wishing you clear skies!

Original Story Source: NASA Marshall Space Flight Center News Release. Geminid photography courtesy of John Chumack.

Martian Sundial – A New “Curiosity”

The Sundial aboard NASA’s Curiosity rover. Credit: MER Sundial Team

[/caption]

There’s been a lot of artifacts sent to the surface of Mars – and now there’s about to be another one left for future generations to discover. Artist Jon Lomberg has collaborated with a team of space scientists to design a sundial which sports edges with designs and images. These embellishments have been authored by Jim Bell and the MER sundial team with the graphics designed by Lomberg.

The upcoming scientific mission to Mars – the Mars Science Laboratory – rover is called Curiosity. Much like its forerunners, NASA’s Mars Exploration Rovers Spirit and Opportunity, the planned sundial will also act as a camera calibration target for the Mastcam camera. Developed by Malin Space Science Systems, inc. of San Diego, CA, the Mastcam camera will be the rover’s principal instrument for photographing the Martian surface. It was developed under the supervision of Principal Investigator Michael Malin and the calibration target will become an outstanding educational opportunity for students. How? The image of the sundial can be transmitted back to Earth, where watchers can engage themselves with how such simple tools can be used to pinpoint times, dates, seasons and even latitudes on Mars. This celebration of space exploration is further cemented by the artistry contained on the “face” of the sundial – the word for Mars written in sixteen languages, including ancient Sumerian, Mayan, Inuktitut, and Hawaiian.

The original idea for this creative educational experience came from Bill Nye The Science Guy, who is currently the Executive Director of The Planetary Society. The message comes from Planetary Society President, Professor James Bell, who is also the MER imaging scientist and leader of the team which included Lomberg to design the sundial and its message. However, don’t think the message was designed for aliens! This time the artwork was intended for future generations of “Martians” – human beings who may one day explore or inhabit Mars. It might be within our lifetimes and it might be centuries from now, but perhaps some day an explorer will encounter what we’ve left behind. This is truly the target audience the message is being left for – but we can only hope they understand English, the primary language of the nation from where the probe originated. The illustrations are simple and elegant – an attempt to show mankind’s involvement with Mars. It combines classic illustrations of the god Ares, an astronomer’s interpretation of Mars, the Viking lander and assorted Mars spacecraft. Like the symbolic step on the Moon, the footprints on the Martian soil are meant to evoke the sands of time and our human need to explore.

The message on the edges of the Sundial. Credit: Jim Bell and Jon Lomberg

Both Spirit and Opportunity took similar sundials along for the ride – ones that included Bell and Lomberg on the design team. While the idea was much the same, they were crafted with a different date, motto and message that combined Lomberg’s drawings and children’s art. The same team, including Diane Bollen, Lou Friedman, Sheri Klug, Tyler Nordgren, Bill Nye, Steve Squyres, Larry Stark, Woody Sullivan, and Aileen Yingst, also provided input on Curiosity’s new message. Jim Bell is a planetary scientist from Arizona State University in Tempe AZ, the Payload Element Lead for the Pancam instruments on Spirit and Opportunity, and President of The Planetary Society in Pasadena, CA and artist Jon Lomberg was Design Director for NASA’s Voyager Golden Record and a long-time collaborator of Carl Sagan. He won an Emmy Award for his work as Chief Artist of the TV series COSMOS.

There are still a lot of credits to go along, though. Lomberg is on his fifth Mars’ message artifact and earlier work includes Russia’s failed Mars 96 mission. As of now, three of Lomberg’s visions have made it to the Red Planet and soon the fifth will be on its way!

Original Story Source: Citizen of the Galaxy.

In The Dragonfish’s Mouth – The Next Generation Of “SuperStars”

A high-resolution infrared image of Dragonfish association, showing the shell of hot gas. Credit:NASA/JPL-Caltech/GLIMPSE Team/Mubdi Rahman

[/caption]

At the University of Toronto, a trio of astronomers have been fishing – fishing for a copious catch of young, supermassive stars. What they caught was unprecedented… Hundreds of thousands of stars with several hundreds of these being the most massive kind. They hauled in blue stars dozens of times heavier than the Sun, with light so intense it ate its way through the gas that created it. All that’s left is the hollow egg-shell… A shell that measures a hundred light years across.

Their work will be published in the December 20 issue of the Astrophysical Journal Letters, but the team isn’t stopping there. The next catch is waiting. “By studying these supermassive stars and the shell surrounding them, we hope to learn more about how energy is transmitted in such extreme environments,” says Mubdi Rahman, a PhD candidate in the Department of Astronomy & Astrophysics at the University of Toronto. Rahman led the team, along with supervisors, Professors Dae-Sik Moon and Christopher Matzner.

Is the discovery of a huge factory for massive stars new? No. Astronomers have picked them up in other galaxies, but the distance didn’t allow for a clear picture – even when combined with data from other telescopes. “This time, the massive stars are right here in our galaxy, and we can even count them individually,” Rahman says.

However, studying this bright stellar cache isn’t going to be an easy task. Since they are located some 30,000 light years away, the measurements will be extremely labor intensive due to intervening gas and dust. Their light is absorbed, which makes the most luminous of them seem to be smaller and closer. To make matters worse, the fainter stars don’t show up at all. “All this dust made it difficult for us to figure out what type of stars they are,” Rahman says. “These stars are incredibly bright, yet, they’re very hard to see.”

By employing the New Technology Telescope at the European Southern Observatory in Chile, the researchers gathered as much light as possible from a small collection of stars. From this point, they calculated the amount of light each star emitted across the spectrum to determine how many were massive. At least twelve were of the highest order, with a few measuring out to be around a hundred times more massive than the Sun. Before researching the area with a ground-based telescope, Rahman used the WMAP satellite to study the microwave band. There he encountered the glow of the heated gas shell. Then it was Spitzer time… and the imaging began in infra-red.

Once the photos came back the picture was clear… Rahman noticed the stellar egg-shell had a striking resemblance to Peter Shearer’s illustration “The Dragonfish”. And indeed it does look like a mythical creature! With just a bit of imagination you can see a tooth-filled mouth, eyes and even a fin. The interior of the mouth is where the gas has been expelled by the stellar light and propelled forward to form the shell. Not a sight you’d want to encounter on a dark night… Or maybe you would!

“We were able to see the effect of the stars on their surroundings before seeing the stars directly,” Rahman says. This strange heat signature would almost be like watching a face lit by a fire without being able to see the fueling source. Just as red coals are cooler than blue flame, gas behaves the same way in color – with much of it in the infra-red end of the spectrum and only visible to the correct instrumentation. At the other end of the equation are the giant stars which emit in ultra-violet and remain invisible in this type of image. “But we had to make sure what was at the heart of the shell,” Rahman says.

With the positive identification of several massive stars, the team knew they would expire quickly in astronomical terms. “Still, if you thought the inside of the shell was empty, think again,” explains Rahman. For every few hundred superstars, thousands of ordinary stars like the Sun also exist in this region. When the massive ones go supernova, they’ll release metals and heavy atoms which – in turn – may create solar nebulae around the less dramatic stars. This means they could eventually form solar systems of their own

“There may be newer stars already forming in the eyes of the Dragonfish,” Rahman says. Because some areas of the shell appear brighter, researchers surmise the gases contained there are possibly compressing enough to ignite new stars – with enough to go around for many more. However, when there’s no mass or gravity to hold them captive, it would seem they want to fly the nest. “We’ve found a rebel in the group, a runaway star escaping from the group at high speed,” Rahman says. “We think the group is no longer tied together by gravity: however, how the association will fly apart is something we still don’t understand well.”

Original Story Source: In The Dragonfish’s Mouth: The Next Generation Of Superstars To Stir Up Our Galaxy.

Massive Stars Start Life Big… Really BIG!

Artist’s impression illustrating the formation process of massive stars. At the end of the formation process, the surrounding accretion disk disappears, revealing the surface of the young star. At this phase the young massive star is much larger than when it has reached a table equilibrium, i.e., when arriving on the so-called main sequence. Copyright: Lucas Ellerbroek/Lex Kaper University of Amsterdam

[/caption]

It might be hard to believe, but massive stars are larger in their infant stage than they are when fully formed. Thanks to a team of astronomers at the University of Amsterdam, observations have shown that during the initial stages of creation, super-massive stars are super-sized. This research now confirms the theory that massive stars contract until they reach the age of equilibrium.

In the past, one of the difficulties in proving this theory has been the near impossibility of getting a clear spectrum of a massive star during formation due to obscuring dust and gases. Now, using the powerful spectrograph X-shooter on ESO’s Very Large Telescope in Chile, researchers have been able to obtain data on a young star cataloged as B275 in the “Omega Nebula” (M17). Built by an international team, the X-shooter has a special wavelength coverage: from 300 nm (UV) to 2500 nm (infrared) and is the most powerful tool of its kind. Its “one shot” image has now provided us with the first solid spectral evidence of a star on its way to main sequence. Seven times more massive than the Sun, B275 has shown itself to be three times the size of a normal main-sequence star. These results help to confirm present modeling.

When young, massive stars begin to coalesce, they are shrouded in a rotating gas disk where the mass-accretion process starts. In this state, strong jets are also produced in a very complicated mechanism which isn’t well understood. These actions were reported earlier by the same research group. When accretion is complete, the disk evaporates and the stellar surface then becomes visible. As of now, B275 is displaying these traits and its core temperature has reached the point where hydrogen fusion has commenced. Now the star will continue to contract until the energy production at its center matches the radiation at the surface and equilibrium is achieved. To make the situation even more curious, the X-shooter spectrum has shown B275 to have a measurably lower surface temperature for a star of its type – a very luminous one. This wide margin of difference can be equated to its large radius – and that’s what the results show. The intense spectral lines associated with B275 are consistent with a giant star.

Lead author Bram Ochsendorf, was the man to analyze the spectrum of this curious star as part of his Master’s research program at the University of Amsterdam. He has also began his PhD project in Leiden. Says Ochsendorf, “The large wavelength coverage of X shooter provides the opportunity to determine many stellar properties at once, like the surface temperature, size, and the presence of a disk.”

The spectrum of B275 was obtained during the X-shooter science verification process by co-authors Rolf Chini and Vera Hoffmeister from the Ruhr-Universitaet in Bochum, Germany. “This is a beautiful confirmation of new theoretical models describing the formation process of massive stars, obtained thanks to the extreme sensitivity of X-shooter”, remarks Ochsendorf’s supervisor Prof. Lex Kaper.

Original Story Source: First firm spectral classification of an early-B pre-main-sequence star: B275 in M17.

International Measure The Moon Night – December 10, 2011

Are you planning on watching the lunar eclipse on Saturday, December 10? Would you like to try your hand at doing something new and unusual, like measuring the Moon? Then join the The Classroom Astronomer (TCA) magazine effort by using time-honored techniques – with a modern twist! Step inside and we’ll tell you where to get the information on how it’s done…

During the total lunar eclipse, viewers will be participating by observing the Moon’s location in the sky and its path through Earth’s shadow. These methods, known as the “Shadow Transit Method” and the “Lunar Parallax Method” are techniques that have been used throughout astronomical history.

“The Shadow technique can be done anyplace where the Moon can be watched through the beginning partial, total and end partial phases of the eclipse. It can be recorded by drawing or photography.” says MTM. “The Parallax technique has to be done with two observers sufficiently far apart (we estimate at least 2000 miles (3200 kilometers). It must be recorded with photography and the photographs have to be taken at the exact same time, with a field of view wide enough (4-8 degrees) such that the neighboring stars can be recorded at the same time on both photographs. A comparison of photographs through overlay procedures will show the shift of the stars (or Moon) as seen from one side of Earth to the other. The larger the shift, the closer the Moon.”

The Classroom Astronomer has created a website – MeasureTheMoon.org to help generate interest – for everyone from general observers to classrooms. Think of what a great activity this would make for your public outreach event!

When it comes to the Shadow Transit Method, the website has a downloadable template with lunar illustrations for hand plots of the shadow over the Moon’s face and a timeline sheet for putting those drawings and cut-out of the template into the proper position. A table to calculate the Moon’s distance and size from the resulting plot is also online. More information on the MeasureTheMoon.org website includes a map that shows where on Earth you need to be to use both methods. When the total lunar eclipse has ended, the website will open a venue where you can upload your photos, along with your Moon distance and diameter observations.

Have fun!!

Information provided by Measure The Moon.

Mapping The Milky Way’s Magnetic Fields – The Faraday Sky

Fig. 3: In this map of the sky, a correction for the effect of the galactic disk has been made in order to emphasize weaker magnetic field structures. The magnetic field directions above and below the disk seem to be diametrically opposed, as indicated by the positive (red) and negative (blue) values. An analogous change of direction takes place accross the vertical center line, which runs through the center of the Milky Way.

[/caption]

Kudos to the scientists at the Max Planck Institut and an international team of radio astronomers for an incredibly detailed new map of our galaxy’s magnetic fields! This unique all-sky map has surpassed its predecessors and is giving us insight into the magnetic field structure of the Milky Way beyond anything so far seen. What’s so special about this one? It’s showing us a quality known as Faraday depth – a concept which works along a specific line of sight. To construct the map, data was melded from 41,000 measurements collected from a new image reconstruction technique. We can now see not only the major structure of galactic fields, but less obvious features like turbulence in galactic gas.

So, exactly what does a new map of this kind mean? All galaxies possess magnetic fields, but their source is a mystery. As of now, we can only guess they occur due to dynamo processes… where mechanical energy is transformed into magnetic energy. This type of creation is perfectly normal and happens here on Earth, the Sun, and even on a smaller scale like a hand-crank powered radio – or a Faraday flashlight! By showing us where magnetic field structures occur in the Milky Way, we can get a better understanding of galactic dynamos.

Fig. 1: The sky map of the Faraday effect caused by the magnetic fields of the Milky Way. Red and blue colors indicate regions of the sky where the magnetic field points toward and away from the observer, respectively. The band of the Milky Way (the plane of the galactic disk) extends horizontally in this panoramic view. The center of the Milky Way lies in the middle of the image. The North celestial pole is at the top left and the South Pole is at the bottom right.
For the last century and a half, we’ve known about Faraday rotation and scientists use it to measure cosmic magnetic fields. This action happens when polarized light goes through a magnetized medium and the plane of polarization revolves. The amount of turn is dependent on the strength and direction of the magnetic field. By observation of the rotation we can further understand the properties of the intervening magnetic fields. Radio astronomers gather and examine the polarized light from distant radio sources passing through our galaxy on its way to us. The Faraday effect can then be judged by measuring the source polarization at various frequencies. However, these measurements can only tell us about the one path through the Milky Way. To see things as a whole, one needs to know how many sources are scattered over the visible sky. This is where the international group of radio astronomers played an important role. They proved data from 26 different projects which gave a grand total of 41,300 pinpoint sources – at an average of about one radio source per square degree of sky.

Although that sounds like a wealth of information, it’s still not really enough. There are huge areas, particularly in the southern sky, where only a few measurements exist. Because of this lack of data, we have to interpolate between existing data points and that creates its own problems. First, the accuracy varies and more precise measurements should help. Also, astronomers are not exactly sure of how reliable a single measurement can be – they just have to take their best guess based on what information they have. Still, other problems exist. There are measurement uncertainties due to the complex nature of the process. A small error can increase by tenfold and this could convolute the map if not corrected. To help fix these problems, scientists at MPA developed a new algorithm for image capture, named the “extended critical filter”. In its creation, the team utilizes tools provided by the new discipline known as information field theory – a powerful tool that blends logical and statistical methods to applied fields and stacks it up against inaccurate information. This new work is exciting because it can also be applied to other imaging and signal-processing venues in alternate scientific fields.

Fig. 2: The uncertainty in the Faraday map. Note that the range of values is significantly smaller than in the Faraday map (Fig. 1). In the area of the celestial south pole, the measurement uncertainties are particularly high because of the low density of data points.
“In addition to the detailed Faraday depth map (Fig. 1), the algorithm provides a map of the uncertainties (Fig. 2). Especially in the galactic disk and in the less well-observed region around the south celestial pole (bottom right quadrant), the uncertainties are significantly larger.” says the team. “To better emphasize the structures in the galactic magnetic field, in Figure 3 (above) the effect of the galactic disk has been removed so that weaker features above and below the galactic disk are more visible. This reveals not only the conspicuous horizontal band of the gas disk of our Milky Way in the middle of the picture, but also that the magnetic field directions seem to be opposite above and below the disk. An analogous change of direction also takes place between the left and right sides of the image, from one side of the center of the Milky Way to the other.”

The good news is the galactic dynamo theory seems to be spot on. It has predicted symmetrical structures and the new map reflects it. In this projection, the magnetic fields are lined up parallel to the plane of the galactic disc in a spiral. This direction is opposite above and below the disc and the observed symmetries in the Faraday map arise from our location within the galactic disc. Here we see both large and small structures tied in with the turbulent, dynamic Milky Way gas structures. This new map algorithm has a great side-line, too… it characterizes the size distribution of these structures. Larger ones are more definitive than smaller ones, which is normal for turbulent systems. This spectrum can then be stacked against computer models of dynamics – allowing for intricate testing of the galactic dynamo models.

This incredible new map is more than just another pretty face in astronomy. By providing information of extragalactic magnetic fields, we’re enabling radio telescope projects such as LOFAR, eVLA, ASKAP, Meerkat and the SKA to rise to new heights. With this will come even more updates to the Faraday Sky and reveal the mystery of the origin of galactic magnetic fields.

Original Story Source: Max Planck Institut for Astrophysics News Release. For Further Reading: An improved map of the galactic Faraday sky”. Download the map HERE.

Lunar Eclipse – Saturday, December 10, 2011

Aligning his camera on the same star for nine successive exposures, Sky & Telescope contributing photographer Akira Fujii captured this record of the Moon’s progress dead center through the Earth’s shadow in July 2000. Credit: Sky & Telescope / Akira Fujii

[/caption]

Are you ready for some good, old-fashioned observing fun? Although you might not want to get up early, it’s going to be worth your time. This Saturday, December 10, 2011, marks the last total lunar eclipse event for the western portion of the Americas until 2014. While a solar eclipse event has a very small footprint where it is visible, a lunar eclipse has a wide and wonderful path that encompasses a huge amount of viewers. “We’re all looking at this together,” says Sky & Telescope senior editor Alan MacRobert.

How much of the dawn lunar eclipse will be visible for you? For your location, this map tells what stage the eclipse will have progressed to by the time the Moon sets below your west-northwestern horizon. Credit: Sky & Telescope
If you live in the eastern portion of the Americas, sorry… You’ll miss out on this one. In the Central time zone, the Moon will be setting while it is partially eclipsed. However, beginning in a line that takes in Arizona and the Dakotas you’ll be treated to the beginning of the lunar eclipse, totality, and it will set as it is beginning to come out of eclipse. If you live in the western portion of the US or Canada? Lucky you! You’ll get to enjoy the Moon as it goes through the initial states of eclipse, see totality and even might catch the phases as it slips out of Earth’s shadow again – just as the Sun begins to rise. For Skywatchers in Hawaii, Australia, and East Asia, you’ll have it better. Seen from there, the whole eclipse happens high in a dark sky from start to finish. For Europe and Africa, the eclipsed Moon will be lower in the east during or after twilight on the evening of the 10th.

When exactly does the event begin? The lunar eclipse will be total from 6:05 to 6:57 a.m. Pacific Standard Time. The partial stage of the eclipse begins more than an hour earlier, at 4:45 a.m. PST. Be sure to watch the southern lunar edge, too. Because the Moon will be skimming by the southern edge of the Earth’s shadow, it will remain slightly brighter and add to the dimensional effect you’ll see. Enjoy the coppery colors from the refracted sunlight! The Moon won’t be black – but it will most certainly be a very photogenic experience.

“That red light on the Moon during a lunar eclipse comes from all the sunrises and sunsets around the Earth at the time,” explains Sky & Telescope editor in chief Robert Naeye. “If you were an astronaut standing on the Moon and looking up, the whole picture would be clear. The Sun would be covered up by a dark Earth that was ringed all around with a thin, brilliant band of sunset- and sunrise-colored light — bright enough to dimly illuminate the lunar landscape around you.”

May clear skies be yours!

Original News Source: Sky and Telescope News Release. Image Credits: Sky and Telescope.

Staking Out A Vampire Star

These super-sharp images of the unusual vampire double star system SS Leporis were created from observations made with the VLT Interferometer at ESO’s Paranal Observatory using the PIONIER instrument. The system consists of a red giant star orbiting a hotter companion. Note that the stars have been artificially coloured to match their known temperatures. Credit: ESO/PIONIER/IPAG

[/caption]

How do you peer into the dark heart of a vampire star? Try combining four telescopes! At ESO’s Paranal Observatory they created a virtual telescope 130 metres across with vision 50 times sharper than the NASA/ESA Hubble Space Telescope and observed a very unusual event… the transfer of mass from one star to another. While you might assume this to be a violent action, it turns out that it’s a gradual drain. Apparently SS Leporis stands for “super slow”.

“We can now combine light from four VLT telescopes and create super-sharp images much more quickly than before,” says Nicolas Blind (IPAG, Grenoble, France), who is the lead author on the paper presenting the results, “The images are so sharp that we can not only watch the stars orbiting around each other, but also measure the size of the larger of the two stars.”

This stellar duo, cataloged as SS Leporis, are only separated by slightly more than one AU and have an orbital period of 260 days. Of the two, the more massive and cooler member expands to a size of about Mercury’s orbit. It’s this very action of being pushed closer that draws the hot companion to feed on its host – consuming almost half of its mass. Weird? You bet.

“We knew that this double star was unusual, and that material was flowing from one star to the other,” says co-author Henri Boffin, from ESO. “What we found, however, is that the way in which the mass transfer most likely took place is completely different from previous models of the process. The ‘bite’ of the vampire star is very gentle but highly effective.”

The technique of combining telescopes gives us an incredibly candid image – one which shows us the larger star isn’t quite as large as surmised. Rather than clarifying the picture, it complicates. Just how did a red giant lose matter to its companion? Researchers are guessing that rather than streaming material from one star to another, that stellar winds may have released mass – only to be collected by the companion vampire star.

“These observations have demonstrated the new snapshot imaging capability of the Very Large Telescope Interferometer. They pave the way for many further fascinating studies of interacting double stars,” concludes co-author Jean-Philippe Berger.

Where’s van Helsing when you need him?

Original Story Source: ESO Press Release For Further Reading: An Incisive Look At The Symbiotic Star SS Leoporis.

Pinning The Tails On Galaxy Clusters

A visible light image of the FGC 1287 group of galaxies in Abell 1367. This is based on a composite of images taken from the Sloan Digital Sky Survey through three colour filters. The white contours show the neutral hydrogen distribution. The huge gas tail emanates from the edge on spiral galaxy FGC 1287. Two other members of the group have associated neutral hydrogen here marked by contour lines.

[/caption]

When it comes to understanding how galaxies behave both inside and outside of galaxy clusters, it would seem that we still have quite a lot to learn. Tom Scott from the Instituto de Astrofisica de Andalucia in Granada, Spain, and a group of international astronomers have been busy with the Expanded Very Large Array (EVLA) of the National Radio Astronomy Observatory (NRAO) in the USA, checking out an assortment of galaxies associated with galaxy cluster Abell 1367. What they have found is unexpectedly long one-sided gaseous tails in two sets of galaxies… the longest of their type ever observed.

Located in the constellation of Leo and about 300 million light years away, galaxies CGCG 097-026 and FGC1287 are displaying gaseous tail structures that may rearrange thinking on how stripping of materials behaves. Current thinking has hot gases trapped within the galaxy cluster’s gravitational field – with incoming galaxies being depleted of their cold hydrogen gases when captured by the gravitational influence. Through this impact, galaxies added to the cluster generally tend to lose their star-forming abilities and begin to quickly age. Astronomers assume this is why less aggressive galaxy structures tend to be found in lower density environments. However, thanks to Scott’s research, astronomers might be able to assume that galaxies can be robbed of their gases before entering a clustered environment.

“When we looked at the data, we were amazed to see these tail structures” says Tom Scott. “The projected lengths of the gaseous tails are 9 to 10 times that of the size of the parent galaxies, i.e., 520,000 and 815,000 light years respectively. In both cases the amount of cold hydrogen gas in the tails is approximately the same as that remaining in the galaxy’s disk. In other words, these galaxies have already left behind half of their fuel for star formation before entering the sphere of influence of the cluster.”

As stated, the commonly accepted theory for gaseous tail structures is interaction with the hot, gaseous medium located within the cluster’s influence – a process known as ram-pressure stripping. But this case is different. Galaxies CGCG 097-026 and FGC1287 aren’t being perturbed by the nearby cluster just yet… But they are still displaying long tails of material.

“We considered the various physical processes proposed by theorists in the past to describe gas removal from galaxies, but no one seems to be able to explain our observations” says Luca Cortese, researcher at ESO-Garching, Germany, and co-author of this work. “Whereas in the case of CGCG97-026, the gravitational interaction between the various members of the group could explain what we see, FGC1287 is completely different from any case we have seen before.”

Right now, ram-pressure stripping isn’t the answer – and gravitational interactions don’t seem to fit the picture, either. It’s leaving scientists at a loss to explain these long tails and lack of stellar disturbance.

“Although the mechanism responsible for this extraordinary gas tail remains to be determined, our discovery highlights how much there still is to learn about environmental effects in galaxy groups” says team member Elias Brinks, a scientist at the University of Hertfordshire. “This discovery might open a new chapter in our understanding of environmental effects on galaxy evolution.”

Original Story Source: Royal Astronomical Society News Release. For Further Reading: Two long tails in the outskirts of Abell 1367.