Impact On Asteroid Scheila?

(Left to right): images of (596) Scheila corresponding to 2010 December 13, 14, 17, and 29. The upper row corresponds to the observations, while the lower row to the models. The tails clearly show a bifid pattern with a central spike in the sunward direction, although it is not detectable in the December 29 image. Except for this latter case, the modeled images are rendered using the same color code for the intensities as the corresponding observed images in the top row. Credit: Fernando Moreno

[/caption]

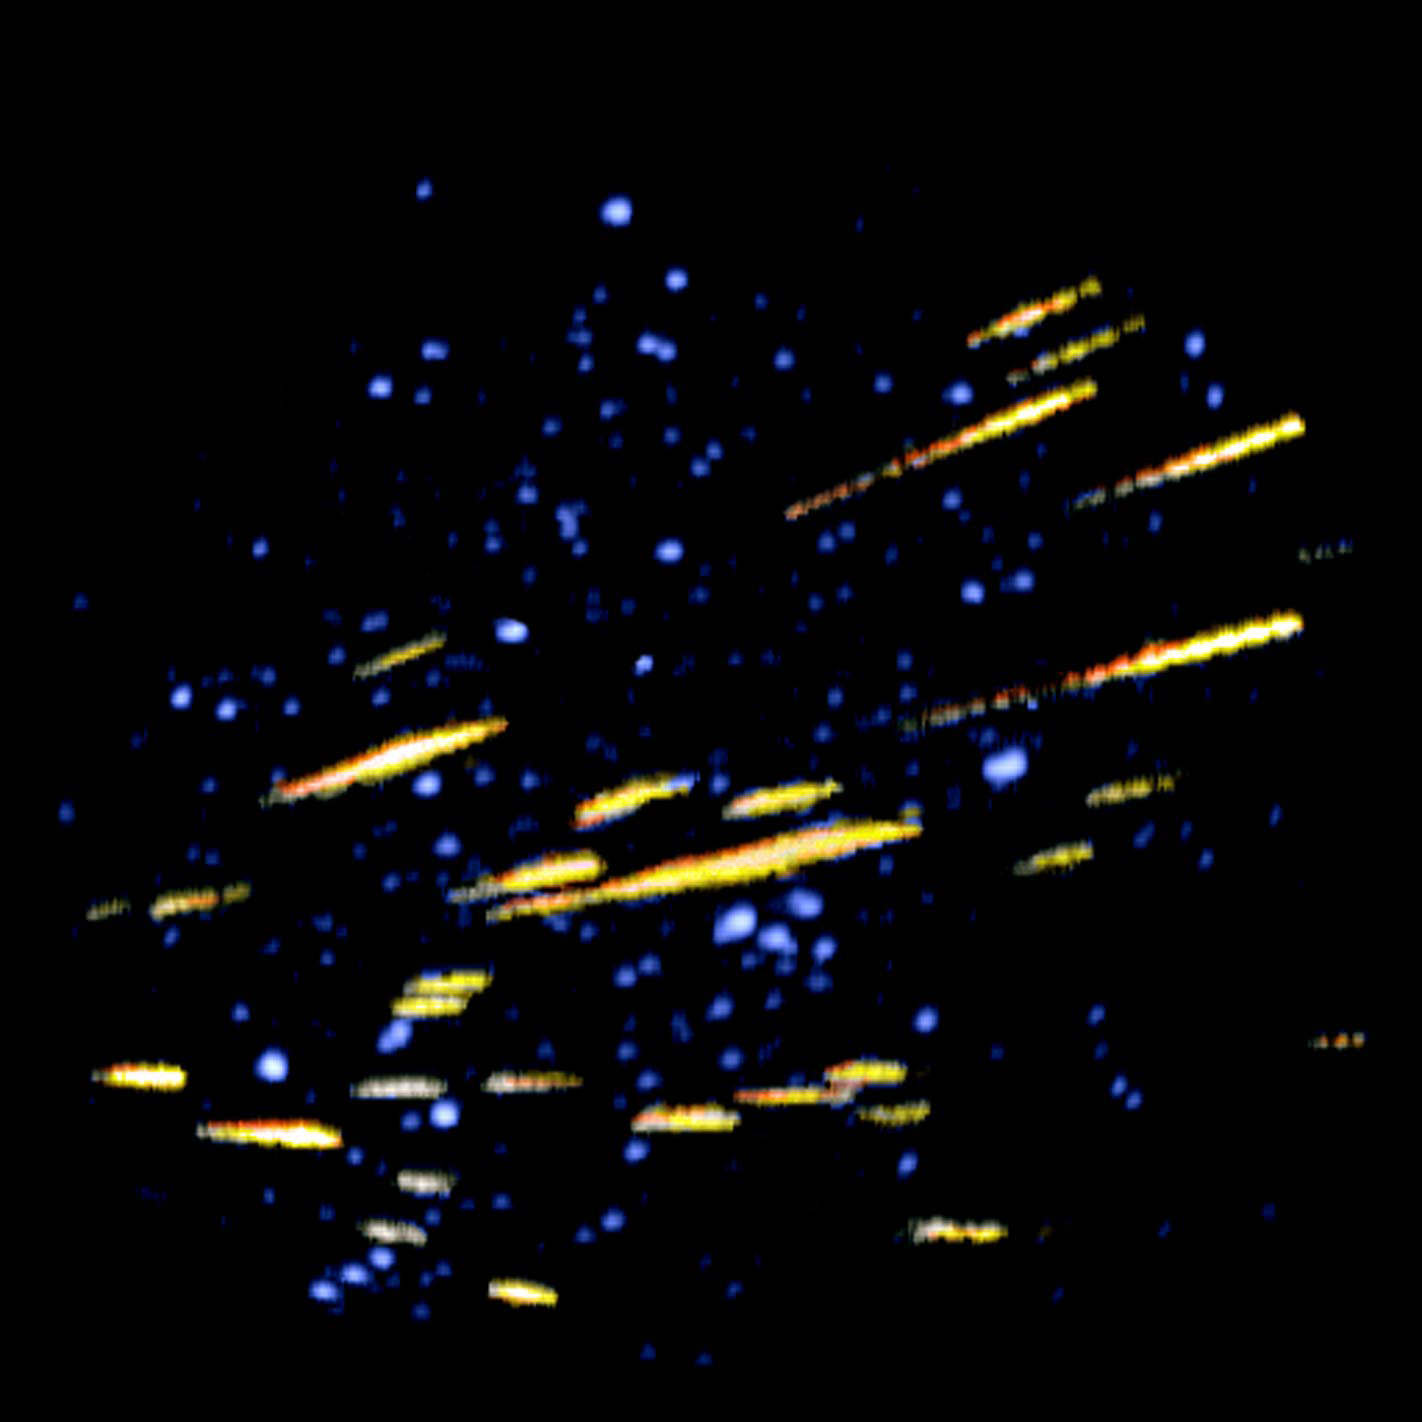
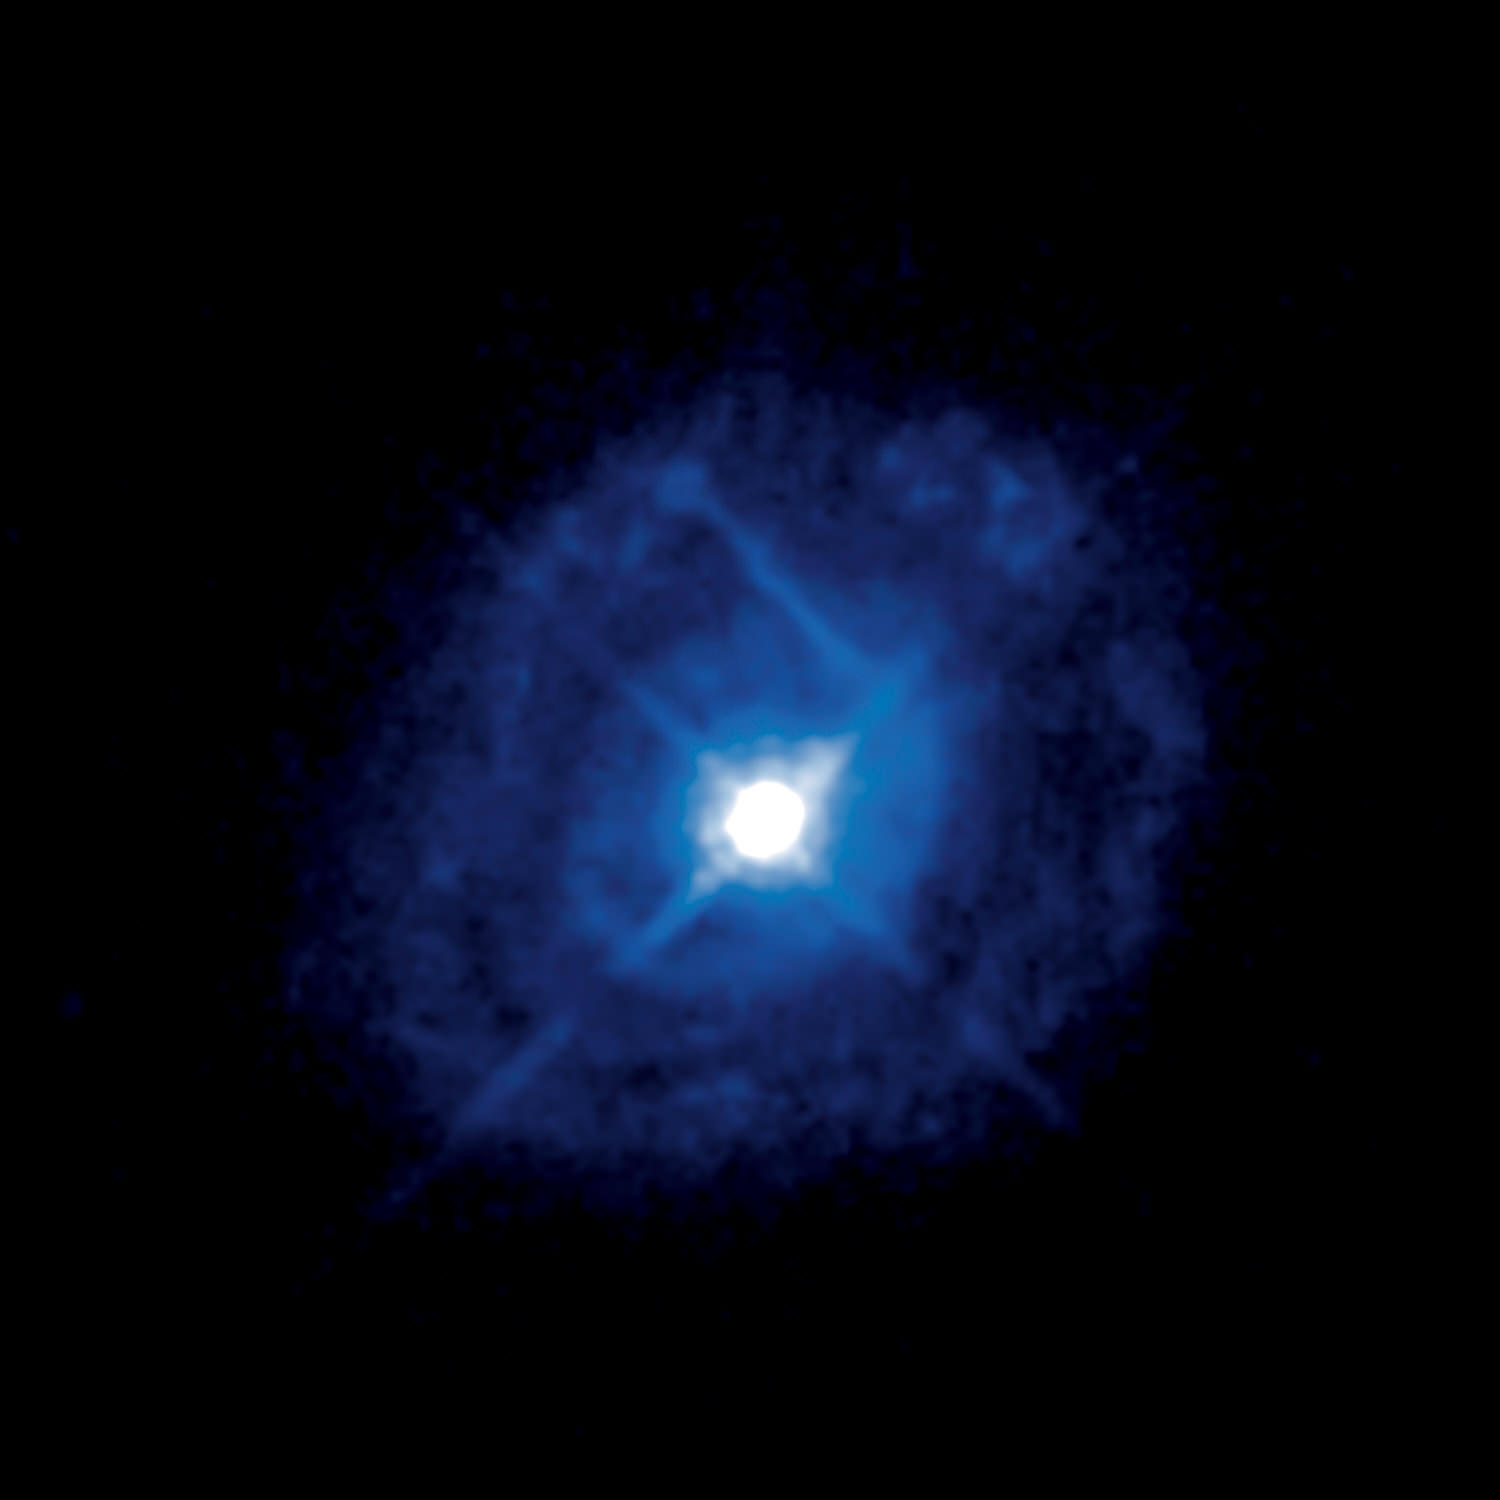
On December 12, 2010, something very unusual happened to asteroid Scheila. For a short period of time, its appearance changed dramatically and it even developed a comet-like tail. Now a group of international scientists headed by Fernando Moreno of the Instituto de Astrofísica de Andalucía in Granada, Spain have created a computer model which may explain this weird activity… an impact.

In results revealed October 7th in Nantes, France at the joint meeting of the European Planetary Science Congress and the American Astronomical Society’s Division for Planetary Sciences, the team explained their theory of how this innocent asteroid may have been crashed into by a smaller object. Moreno and his team plotted the brightness curve of Scheila’s newly developed “tail” – watching how it declined over a period of weeks. Their conclusion was that Scheila was either responsible for bumping into an uncatalogued object – or the object bumped into it causing a debris trail.

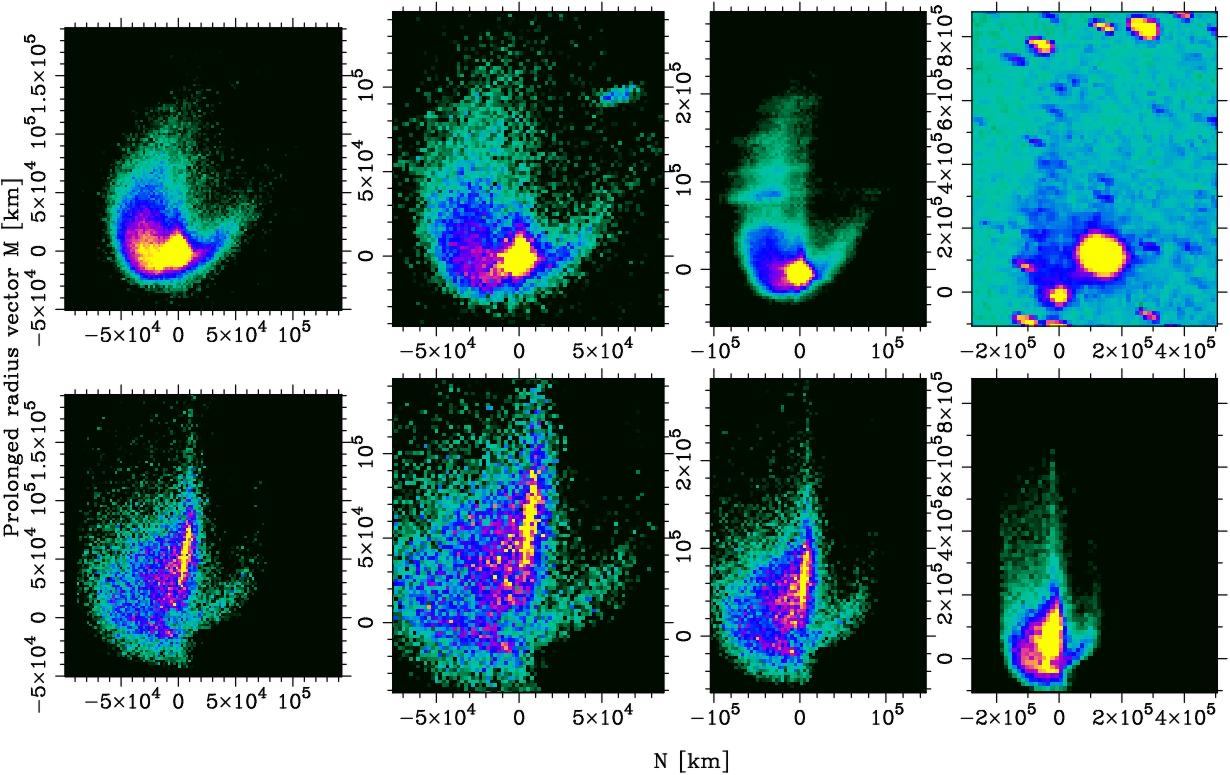
“The model we used involves a very large number of particles ejected from Scheila.” explains Moreno. “We took into account gravity from the Sun, pressure radiation on the ejected particles, and Scheila´s gravity, which has a strong effect on the particles in its vicinity owing to its large mass.”

Just when did this crash occur? The first indications placed the “asteroid accident” at a period of somewhere between November 11 and December 3, 2010. But, thanks to refined studies the team has placed the smash-up to on – or within – three days of November 27, 2010. With a size of about 110 kilometers across, Scheila isn’t very large and the impactor was estimated to be anywhere from 60 to 180 meters in diameter. That’s quite enough to send visible pieces flying into space!

“We applied a scaling law that uses impact velocity to indicate the mass of the impactor and ejected material.” concludes Moreno. “We know the impact should be about 5 kilometres per second because that’s the average velocity of asteroids in the Main Belt. Using this number we predicted both the ejection velocity of the particles (50 to 80 meters per second) and the size of the impactor.”

As for asteroid Scheila, she’s also a step off the beaten path, too. It belongs to a class known Main-Belt Comets – objects which have orbital characteristics of Main-Belt Asteroids – but sometimes behave like a comet. The reason why they have outbursts still isn’t clear. While these new modeling techniques may lend credence to the impact theory, there’s also a strong possibility of gaseous emissions. However, astronomers from the University of Maryland and Institute for Astronomy, University of Hawaii have ruled out venting in Scheila’s case.

Original Story Source: EuroPlanet News.

Venus Express Discovers Venusian Ozone Layer

Venus Express has two solar cell panels per wing comprising alternating rows of standard triple junction solar cells as well as highly reflective mirrors to reduce the operating temperatures. There is twice as much sunlight in Venus's orbit as there is in Earth's orbit, plus additional thermal input from the Venusian surface and atmosphere – 75% of sunlight being reflected up from it. In certain cases, this results in Venus Express receiving an equivalent of the thermal input from 3.5 Suns. Credit: ESA

Every day brings on new discoveries and now ESA’s Venus Express spacecraft has delivered another… the red-hot planet has an ozone layer. Located high in the Venusian atmosphere, this planetary property will help us further understand how such features compare to Earth and Mars – along with refining our search for extra-terrestrial life.

This wonderful discovery was made while Venus Express was busy watching stars at the periphery. When seen through the planet’s atmosphere, the SPICAV instrument was able to distinguish gas types spectroscopically. By picking apart the wavelengths, ozone was detected through its absorption of ultraviolet light. It forms when sunlight breaks down the carbon dioxide molecules and releases oxygen. From there, they are distributed by planetary winds where the oxygen atoms will either combine into two-atom oxygen molecules, or form three-atom ozone.

“This detection gives us an important constraint on understanding the chemistry of Venus’ atmosphere,” says Franck Montmessin, who led the research.

This is an animation of Venus Express performing stellar occultation at Venus. Venus Express is the first mission ever to apply the technique of stellar occultation at Venus. The technique consists of looking at a star through the atmospheric limb. By analysing the way the starlight is absorbed by the atmosphere, one can deduce the characteristics of the atmosphere itself. Credits: ESA (Animation by AOES Medialab)

To date, ozone has been the sole property of Earth and Mars – but this type of discovery method could aid astronomers in searching for life on other worlds. Why is it important? Because ozone absorbs most of the Sun’s harmful ultra-violet rays… and because it is believed to be a by-product of life itself. When combined with carbon dioxide, this could create a signature as a strong signal for life. But don’t get too excited at the prospects, yet. The amount of ozone detected is also critical to refining models. It will need to be at least 20% of Earth’s value to even be considered.

“We can use these new observations to test and refine the scenarios for the detection of life on other worlds,” says Dr Montmessin.

While we know that chances are almost non-existent that Venus has life, it still brings it one step closer to planets like Mars and Earth.

“This ozone detection tells us a lot about the circulation and the chemistry of Venus’ atmosphere,” says Hakan Svedhem, ESA Project Scientist for the Venus Express mission. “Beyond that, it is yet more evidence of the fundamental similarity between the rocky planets, and shows the importance of studying Venus to understand them all.”

Original Story Source: ESA Space Science News.

Observing Alert – Draconid Meteor Shower Could Unleash A Burst Of Activity On October 8!

Meteor Burst - Credit: NASA

[/caption]

If you live in the Europe, North Africa, and the Middle East area, then keep watching the clock for 17-18:00 UTC when you may be in the right place at the right time for a burst of activity from the annual Draconid Meteor Shower. There’s a possibility you might see up to 1,000 meteors an hour!

As always, meteor showers are unpredictable events – but that doesn’t mean you can’t be prepared or forewarned. While the gibbous Moon will put a damper on fainter meteor streaks, observers in Europe, North Africa, and the Middle East. are well situated to catch a strong pocket of activity.

“Meteor showers are as difficult to predict as rain showers. The Draconids have surprised us before, and they may do so again.” says Canadian astronomer Paul Wiegert. “I’d encourage anyone outside on the night of October the 8 to look to the northern skies, just in case.”

This isn’t the first time the Draconid meteor shower has produced a brief storm. In 1933 and 1946 the activity reached an average hourly rate of 10,000. While that’s pretty incredible, the same cometary debris trail left quite a show in the years 1952, 1985, and 1998 when it produced hundreds per hour. These remnants of Comet Giacobini-Zinner aren’t the most dramatic of all showings – but knowing where the meteoroid stream is located makes such predictions valid.

When and where? In this case, start your observations just as soon as the sky gets dark. Since Draco is a northern constellation, those at high latitudes are move favored (sorry, southern hemisphere), so face toward the north and get comfortable. While the storm prediction will happen during daylight hours for North American observers, don’t give up hope! It looks like clear skies for many of us and chances are above average for catching a shooting star.

When opportunity knocks, ya’ gotta’ be there to open the door…

And don’t despair if you don’t live in Europe, North Africa, and the Middle East, or if you get clouded out. You can still watch and listen to meteors enter the atmosphere on Spaceweather radio. Meteors reflect radio signals as they burn up and you can hear this as eerie whistles and pings.

A similar system, still employing the radio reflection method displays meteors coming in on your computer with a cool graph – The Meteorwatch Live View

And follow Universe Today’s Adrian West on his Twitter feed, VirtualAstro and on his website MeteorWatch as he’ll be providing updates on observed meteor rates in various parts of the world.

For Further Reading: Wiegert’s original announcement via Physorg.com.

The Crab Gets Cooked With Gamma Rays

X-ray: NASA/CXC/ASU/J. Hester et al.; Optical: NASA/HST/ASU/J. Hester et al.; Radio: NRAO/AUI/NSF Image of the Crab Nebula combines visible light (green) and radio waves (red) emitted by the remnants of a cataclysmic supernova explosion in the year 1054. and the x-ray nebula (blue) created inside the optical nebula by a pulsar (the collapsed core of the massive star destroyed in the explosion). The pulsar, which is the size of a small city, was discovered only in 1969. The optical data are from the Hubble Space Telescope, and the radio emission from the National Radio Astronomy Observatory, and the X-ray data from the Chandra Observatory.

[/caption]

It’s one of the most famous sights in the night sky… and 957 years ago it was bright enough to be seen during the day. This supernova event was one of the most spectacular of its kind and it still delights, amazes and even surprises astronomers to this day. Think there’s nothing new to know about M1? Then think again…

An international collaboration of astrophysicists, including a group from the Department of Physics in Arts & Sciences at Washington University in St. Louis, has detected pulsed gamma rays coming from the heart of the “Crab”. Apparently the central neutron star is putting off energies that can’t quite be explained. These pulses between range 100 and 400 billion electronvolts (Gigaelectronvolts, or GeV), far higher than 25 GeV, the most energetic radiation recorded. To give you an example, a 400 GeV photon is almost a trillion times more energetic than a light photon.

“This is the first time very-high-energy gamma rays have been detected from a pulsar – a rapidly spinning neutron star about the size of the city of Ames but with a mass greater than that of the Sun,” said Frank Krennrich, an Iowa State professor of physics and astronomy and a co-author of the paper.

We can thank the Arizona based Very Energetic Radiation Imaging Telescope Array System (VERITAS) array of four 12-meter Cherenkov telescopes covered in 350 mirrors for the findings. It is continually monitoring Earth’s atmosphere for the fleeting signals of gamma-ray radiation. However, findings like these on such a well-known object is nearly unprecedented.

“We presented the results at a conference and the entire community was stunned,” says Henric Krawczynski, PhD, professor of physics at Washington University. The WUSTL group led by James H. Buckley, PhD, professor of physics, and Krawczynski is one of six founding members of the VERITAS consortium.

An X-ray image of the Crab Nebula and pulsar. Image by the Chandra X-ray Observatory, NASA/CXC/SAO/F. Seward.

We know the Crab’s story and how its pulsar sweeps around like a lighthouse… But Krennrich said such high energies can’t be explained by the current understanding of pulsars. Not even curvature radiation can be at the root of these gamma-ray emissions.

“The pulsar in the center of the nebula had been seen in radio, optical, X-ray and soft gamma-ray wavelengths,” says Matthias Beilicke, PhD, research assistant professor of physics at Washington University. “But we didn’t think it was radiating pulsed emissions above 100 GeV. VERITAS can observe gamma-rays between100 GeV and 30 trillion electronvolts (Teraelectronvolts or TeV).”

Just enough to cook one crab… well done!

Original Story Source: Iowa State University News Release. For Further Reading: Washington University in St. Louis News Release.

First Look At Interstellar Turbulence

Regions of gas where the density and magnetic field are changing rapidly as a result of turbulence. [Technical note: the image shows the gradient of linear polarisation over an 18-square-degree region of the Southern Galactic Plane.] Image credit – B. Gaensler et al. Data: CSIRO/ATCA

[/caption]

All of the space that surrounds us isn’t empty. We’ve always known the Milky Way was filled with great areas of turbulent gas, but we’ve never been able to see them… Until now. Professor Bryan Gaensler of the University of Sydney, Australia, and his team used a CSIRO radio telescope in eastern Australia to create this first-ever look which was published in Nature today.

“This is the first time anyone has been able to make a picture of this interstellar turbulence,” said Professor Gaensler. “People have been trying to do this for 30 years.”

So what’s the point behind the motion? Turbulence distributes magnetism, disperses heat from supernova events and even plays a role in star formation.

“We now plan to study turbulence throughout the Milky Way. Ultimately this will help us understand why some parts of the galaxy are hotter than others, and why stars form at particular times in particular places,” Professor Gaensler said.

Employing CSIRO’s Australia Telescope Compact Array because “it is one of the world’s best telescopes for this kind of work,” as Dr. Robert Braun, Chief Scientist at CSIRO Astronomy and Space Science, explained, the team set their sights about 10,000 light years away in the constellation of Norma. Their goal was to document the radio signals which emanate from that section of the Milky Way. As the radio waves pass through the swirling gas, they become polarized. This changes the direction in which the light waves can “vibrate” and the sensitive equipment can pick up on these small differentiations.

By measuring the polarization changes, the team was able to paint a radio portrait of the gaseous regions where the turbulence causes the density and magnetic fields to fluctuate wildly. The tendrils in the image are also important, too. They show just how fast changes are occurring – critical for their description. Team member Blakesley Burkhart, a PhD student from the University of Wisconsin, made several computer simulations of turbulent gas moving at different speeds. By matching the simulations with the actual image, the team concluded “the speed of the swirling in the turbulent interstellar gas is around 70,000 kilometers per hour — relatively slow by cosmic standards.”

Original Story Source: CSIRO Astronomy and Space Science News Release. For Further Reading: Low Mach number turbulence in interstellar gas revealed by radio polarization gradients.

Planetary Pinball – Uranus Gets The “Tilt”

Between 3 to 4 billion years ago, a body twice the size of Earth impacted Uranus, knocking the ice giant onto its side. Image Credit: Jacob A. Kegerreis/Durham University
Near-infrared views of Uranus reveal its otherwise faint ring system, highlighting the extent to which it is tilted. Credit: Lawrence Sromovsky, (Univ. Wisconsin-Madison), Keck Observatory.

[/caption]

Popular theory on how Uranus ended up with a highly eccentric axis has always been pretty standard – one giant blow. However, at today’s (October 6) EPSC-DPS Joint Meeting in Nantes, astronomers are thinking things may have occurred slightly differently. Instead of a singular impact, the glowing blue-green gas giant may have been the victim of a series of smaller punches.

At a 98 degree inclination, Uranus and its satellites have always been somewhat of a mystery to planetary scientists. While many of the Solar Systems planets have an inclined axis, none can compare with nearly being on its side. It has always been popular conjecture that Uranus was plastered that way at some point in its evolution by a body a few times larger than Earth. While this seems plausible, only one hole remains in the theory. Why did its moons take on the same inclination instead of staying in their original position?

This long-standing puzzle may have been solved by an international team of scientists led by Alessandro Morbidelli (Observatoire de la Cote d’Azur in Nice, France). Their theory relies on computer modeling – and the thought the impact might have occurred while Uranus was still forming. If the simulations are correct and the strike happened when the planet was still surrounded by a protoplanetary disk, ” the disk would have reformed into a fat doughnut shape around the new, highly-tilted equatorial plane. Collisions within the disk would have flattened the doughnut, which would then go onto form the moons in the positions we see today.”

But that’s not a neat answer. Just like throwing a tilt into pinball, the game changes. In this new scheme, the moons displayed retrograde motion – precisely the opposite of the way things are now. So what’s a player to do? Change the game again by re-arranging the parameters. By adding multiple strikes to Uranus – instead of just one large – the satellites now behave as we observe them.

Of course, when you “tilt” the game is over, and the new research doesn’t jive with current theories of planetary formation. This may mean re-writing the rules again. Morbidelli elaborates: “The standard planet formation theory assumes that Uranus, Neptune and the cores of Jupiter and Saturn formed by accreting only small objects in the protoplanetary disk. They should have suffered no giant collisions. The fact that Uranus was hit at least twice suggests that significant impacts were typical in the formation of giant planets. So, the standard theory has to be revised.”

That deaf, dumb and blind kid… Sure plays a mean pinball!

Original Story Source: Europlanet News Release.

Uncloaking Type Ia Supernovae

This three-color composite of a portion of the Subaru Deep Field shows mostly galaxies with a few stars. The inset shows one of the 10 most distant and ancient Type Ia supernovae discovered by the American, Israeli and Japanese team.

Type Ia supernovae… Right now they are one of the most studied – and most mysterious – of all stellar phenomenon. Their origins are sheer conjecture, but explaining them is only half the story. Taking a look back into almost the very beginnings of our Universe is what it’s all about and a team of Japanese, Israeli, and U.S. astronomers have employed the Subaru Telescope to give us the most up-to-date information on these elementally explosive cosmic players.

By understanding the energy release of a Type Ia supernova, astronomers have been able to measure unfathomable distances and speculate on dark energy expansion. It was popular opinion that what caused them was a white dwarf star pulling in so much matter from a companion that it finally exploded, but new research points in a different direction. According to the latest buzz, it may very well be the merging of two white dwarfs.

“The nature of these events themselves is poorly understood, and there is a fierce debate about how these explosions ignite,” said Dovi Poznanski, one of the main authors of the paper and a post-doctoral fellow at the University of California, Berkeley, and Lawrence Berkeley National Laboratory.

“The main goal of this survey was to measure the statistics of a large population of supernovae at a very early time, to get a look at the possible star systems,” he said. “Two white dwarfs merging can explain well what we are seeing.”

Can you imagine the power behind this theory? The Type Ia unleashed a thermonuclear reaction so strong that it is able to be traced back to nearly the beginning of expansion after the Big Bang. By employing the Subaru telescope and its prime focus camera (Suprime-Cam), the team was able to focus their attention four times on a small area named the Subaru Deep Field. In their imaging they caught 150,000 individual galaxies containing a total of 40 Type Ia supernova events. One of the most incredible parts of these findings is that these events happened about five times more frequently in the early Universe. But no worries… Even though the mechanics behind them are still poorly understood, they still serve as “cosmic distance markers”.

“As long as Type Ias explode in the same way, no matter what their origin, their intrinsic brightnesses should be the same, and the distance calibrations would remain unchanged.” says Alex Filippenko, UC Berkeley professor of astronomy.

Original Story Source: University of Berkeley News Release. For Further Reading: National Astronomical Observatory of Japan: Subaru News Release.

NASA’s Kepler Dishes Up A Triple Planet Treat

The top graphic shows the orbits of the three known planets orbiting Kepler-18 as compared to Mercury's orbit around the Sun. The bottom graphic shows the relative sizes of the Kepler-18 and its known planets to the Sun and Earth. Credit: Tim Jones/McDonald Obs./UT-Austin

[/caption]
What has a super-Earth and two Neptune-like planets? This tempting dessert belongs to the latest Kepler discovery found orbiting Kepler 18. Bill Cochran and a team of researchers have found the resonance they were looking for… and this very Sun-like star may have even more planets dancing around it.

Kepler 18 is a prime candidate for a solar system. The host star is approximately 97% the Sun’s mass and only about 10% physically larger. For now, the transit method has detected three planetary candidates named b, c and d which orbit within a zone smaller than Mercury’s. The “Super Earth” is about twice our size and its year only last three and a half days. At about six times and seven times our size, gaseous planets c and d have rough orbital periods of seven and half and fifteen days respectively.

While the two larger planets have similar transits, their times “are not staying exactly on that orbital period,” Cochran says. “One is slightly early when the other one is slightly late, [then] both are on time at the same time, and then vice-versa.”

Scientifically speaking, c and d are orbiting in a 2:1 resonance. “It means they’re interacting with each other,” Cochran explains. “When they are close to each other … they exchange energy, pull and tug on each other.”

By using the transit method, the Kepler mission is able to watch for periodic brightness changes that signal orbiting bodies. Imagine a bright flashlight moving steadily behind a picket fence in the dark and you’ll get the picture. If each board were a slightly different size, the times the flashlight would be seen would vary. Resonance occurs – very simply put – when there’s a pattern like two wide boards and then a small one. But there’s more that can pass in front of our flashlight than just boards. There could be a line-of-sight star with a binary companion… and it’s just variables like these that makes confirming Kepler’s findings crucial.

In a process called “validation”, Cochran and his team utilized the Palomar 5-meter (200-inch) Hale Telescope and its adaptive optics to take another look at Kepler 18 and its system. “We successively went through every possible type of object that could be there,” Cochran says. “There are limits on the sort of objects that can be there at different distances from the star.” The findings were negative. The planetary trio survived the next stage of identification.

“There’s a small possibility that [planet b] is due to a background object, but we’re very confident that it’s probably a planet,” Cochran says. With a seven hundred times probability factor that the Kepler findings signify a planetary signature, chances are good this trio is going down on the records as a validated system – with perhaps more yet to be discovered.

“We’re trying to prepare the astronomical community and the public for the concept of validation,” he says. “The goal of Kepler is to find an Earth-sized planet in the habitable zone, with a one-year orbit. Proving that such an object really is a planet is very difficult. When we find what looks to be a habitable Earth, we’ll have to use a validation process, rather than a confirmation process. We’re going to have to make statistical arguments.”

Original Story Source: McDonald Observatory News Release.

Titan’s Technicolor Terrain

Global mosaic of VIMS infrared images acquired during the nominal and equinox Cassini mission. Differences in composition translate into subtle differences of colours in this mosaic, revealing the diversity of terrains on Titan, such as the brownish equatorial dune fields or the bright elevated terrains. (Colour coding : Red=5 um, Green=2.0 um, Blue=1.27 um). Credits JPL/NASA/Univ. of Arizona/CNRS/LPGNantes

[/caption]

At the University of Nantes, a group of international scientists have been piecing together one of the most amazing jigsaw puzzles of all times… a color image of Saturn’s moon, Titan. For six years the Cassini mission has been busy gathering images and the resulting compilation was presented on October 4 by Stephane Le Mouelic at the 2011 EPSC-DPS Joint Meeting in Nantes, France. While it might not win the Cannes Film Festival, it’s certainly near and dear to an astronomer’s heart…

During the first seventy fly-bys of the famous Saturnian satellite, the Visual and Infrared Mapping Spectrometer (VIMS) gathered imaging records. But sewing together such a large quilt of information wasn’t an easy task. Not only does each image have to be adjusted for differences in lighting conditions, but a pixel-by-pixel match up has to occur to take atmospheric distortions into account. Titan’s methane rain and nitrogen atmosphere isn’t conducive to easy imaging and only a narrow band of infrared wavelengths allow us to take a closer look at the hidden, frozen surface. However, the results have been spectacular and little by little some very “terrestrial” features have come to light.

“As Cassini is orbiting Saturn and not Titan, we can observe Titan only once a month on average. The surface of Titan is therefore revealed year after year, as pieces of the puzzle are progressively put together.” says Le Mouelic. “Deriving a final map with no seams is challenging due to the effects of the atmosphere – clouds, mist etc. – and due to the changing geometries of observation between each flyby.”

Since 2004, Cassini has made 78 fly-bys of the exotic frozen world and another 48 are planned over the next five years. However, VIMS has had very few chances to image Titan with a high spatial resolution. While this still leaves many areas in the proverbial dark, all this can change in the future.

“We have created the maps using low resolution images as a background with the high resolution data on top. In the few opportunities where we have VIMS imagery from the closest approach, we can show details as low as 500 metres per pixel. An example of this is from the 47th flyby, which allowed the observation of the site where the Huygens descent module landed. This observation is a key one as it might help us to bridge the gap between the ground truth provided by Huygens, and ongoing global mapping from orbit, which will continue up to 2017.”

And what does the future hold? Along with updated spatial coverage, the team plans on documenting Titan’s changing seasons from both an atmospheric and surface viewpoint. Changes that are just now beginning to occur.

“Lakes in Titan’s northern hemisphere were first discovered by the RADAR instrument in 2006, appearing as completely smooth areas. However, we had to wait up to June 2010 to obtain the first infrared images of the northern lakes, emerging progressively from the northern winter darkness,” says Le Mouelic. “The infrared observations provide the additional opportunity to investigate the composition of the liquids within the lakes area. Liquid ethane has already been identified by this means.”

Fill ‘er up… We’ll be watching!

Original Story Source: Europlanet News Release. For an even more impressive look, check out the Animation of Titan Mosaic.

Looking Into The Eye Of A Monster – Active Galaxy Markarian 509

Active galaxy Markarian 509 as seen by the Hubble Space Telescope's WFPC2. Credits: NASA, ESA, J. Kriss (STScI) and J. de Plaa (SRON)

[/caption]

“The world is a vampire, sent to drain… Secret destroyers, hold you up to the flames…” Ah, yes. It’s the biggest vampire of all – the supermassive black hole. In this instance, it’s not any average, garden-variety black hole, but one that’s 300 million times the mass of the Sun and growing. Bullet with butterfly wings? No. This is more a case of butterfly wings with bullets.

An international team of astronomers using five different telescopes set their sites on 460 million light-year distant Markarian 509 to check out the action surrounding its huge black hole. The imaging team included ESA’s XMM-Newton, Integral, NASA/ESA Hubble Space Telescope, NASA’s Chandra and Swift satellites, and the ground-based telescopes WHT and PARITEL. For a hundred days they monitored Markarian 509. Why? Because it is known to have brightness variations which could mean turbulent inflow. In turn, the inner radiation then drives an outflow of gas – faster than a speeding bullet.

“XMM-Newton really led these observations because it has such a wide X-ray coverage, as well as an optical monitoring camera,” says Jelle Kaastra, SRON Netherlands Institute for Space Research, who coordinated an international team of 26 astronomers from 21 institutes on four continents to make these observations.

And the vampire reared its ugly head. Instead of the previously documented 25% changes, it jumped to 60%. The hot corona surrounding the black hole was spattering out cold gas “bullets” at speeds in excess of one million miles per hour. These projectiles are torn away from the dusty torus, but the real surprise is that they are coming from an area just 15 light years away from the center. This is a lot further than most astronomers speculate could happen.

“There has been a debate in astronomy for some time about the origin of the outflowing gas,” says Kaastra.

But there’s more than just bullets here. These new observations at multiple wavelengths are showing the coolest gas in the line of sight toward Markarian 509 has 14 different velocity components – all from different locations at the galaxy’s heart. What’s more, there’s indications the black hole accretion disc may have a shield of gas harboring temperatures ranging in the millions of degrees – the motivating force behind x-rays and gamma rays.

An artist's impression of the central engine of an active galaxy. A black hole is surrounded by matter waiting to fall in. Fearsome radiation from near the black hole drives an outflow of gas. Credits: NASA and M. Weiss (Chandra X-ray Center)

“The only way to explain this is by having gas hotter than that in the disc, a so-called ‘corona’, hovering above the disc,” Jelle Kaastra says. “This corona absorbs and reprocesses the ultraviolet light from the disc, energising it and converting it into X-ray light. It must have a temperature of a few million degrees. Using five space telescopes, which enabled us to observe the area in unprecedented detail, we actually discovered a very hot ‘corona’ of gas hovering above the disc. This discovery allows us to make sense of some of the observations of active galaxies that have been hard to explain so far.”

To make things even more entertaining, the study has also found the signature of interstellar gas which may have been the result of a one-time galaxy collision. Although the evidence may be hundreds of thousands of light years away from Mrk 509, it may have initially triggered this activity.

“The results underline how important long-term observations and monitoring campaigns are to gain a deeper understanding of variable astrophysical objects. XMM-Newton made all the necessary organisational changes to enable such observations, and now the effort is paying off,” says Norbert Schartel, ESA XMM-Newton Project Scientist.

Ah, Markarian 509… “Despite all my rage… I am still just a rat in cage.”

Original Story Source: ESA News. For Further Reading: Multiwavelength Campaign on Mrk 509 VI. HST/COS Observations of the Far-ultraviolet Spectrum.