Mercury Mapper Is Really Hot Stuff

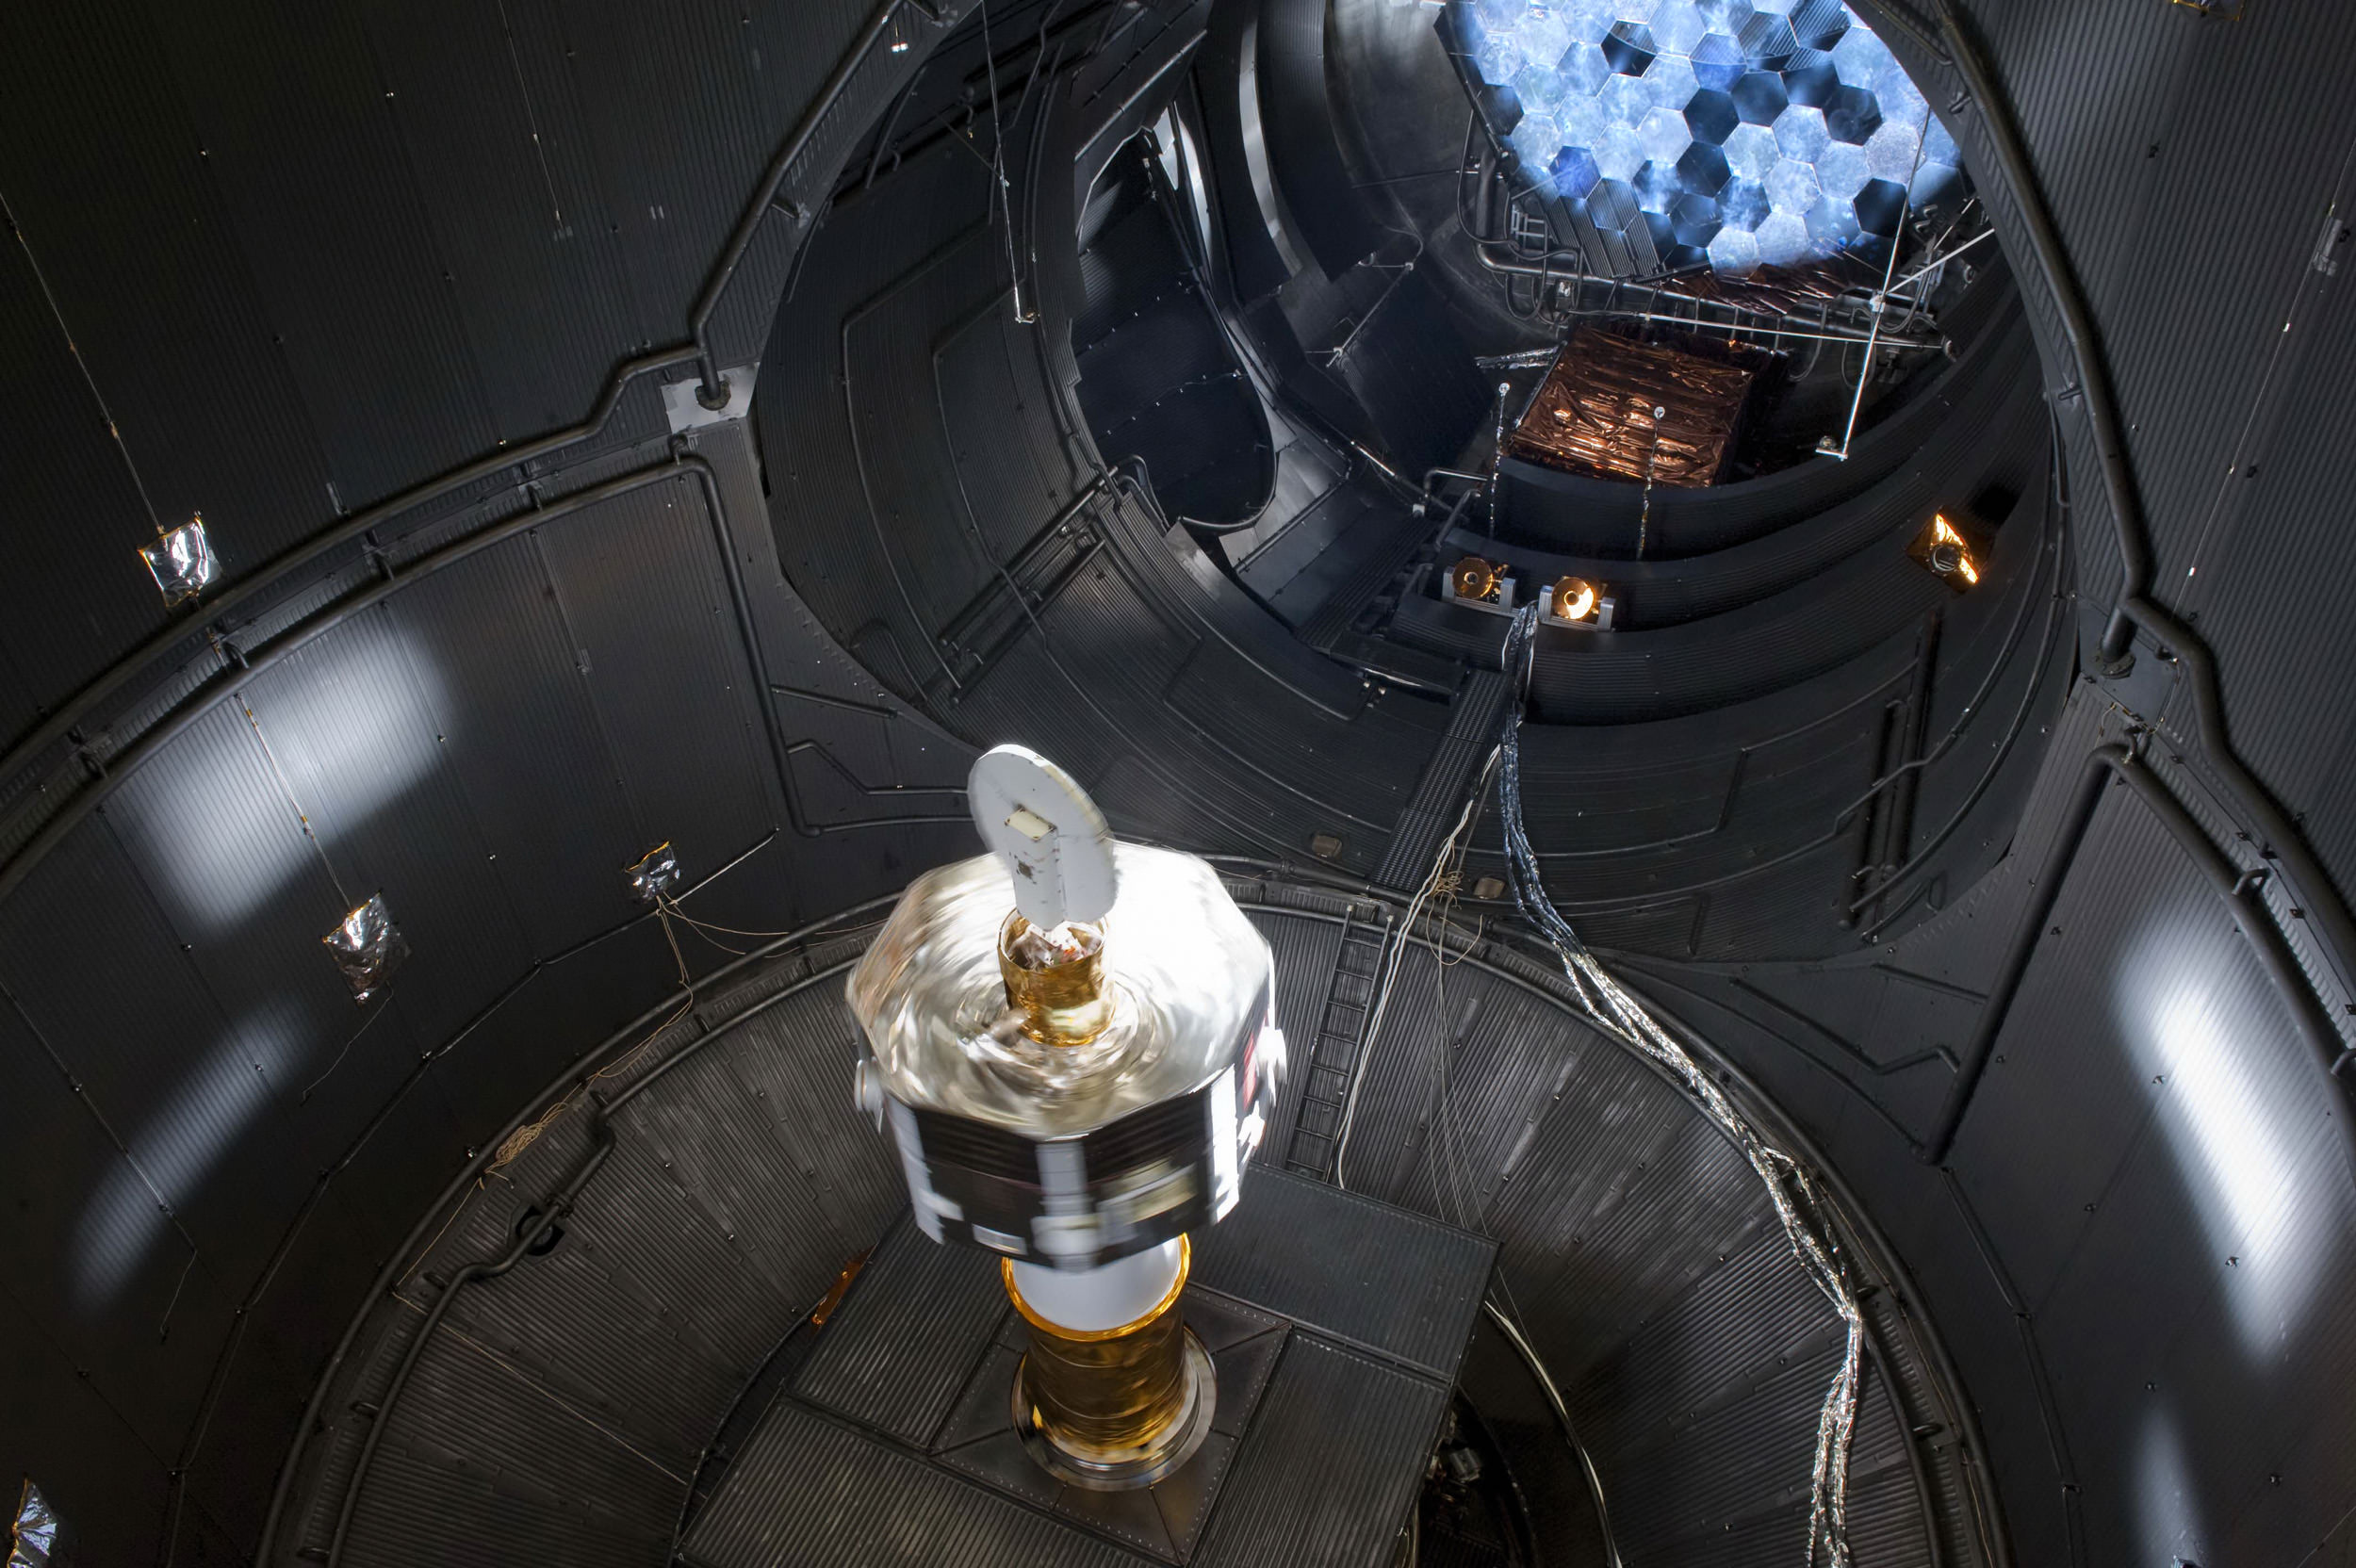
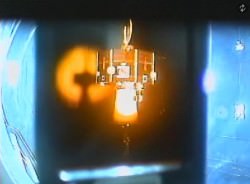
BepiColombo's Mercury Magnetospheric Orbiter (MMO) in the Large Space Simulator at ESTEC, The Netherlands. The octagonal spacecraft is Japan’s contribution to BepiColombo and will explore Mercury's magnetic field. Credits: ESA/JAXA

[/caption]

Most of us have heard the expression “hot enough to cook eggs on the sidewalk”, but have we really thought about what kind of technology it would take to send a probe to Mercury? Just what kind of tests would we need to do to ensure a spacecraft could endure the kind of temperatures present while in orbit of the inner planet? It’s going to take more than a microwave set on high to find out…

According to ESA’s press release, the key components of the ESA-led Mercury mapper BepiColombo have been tested in a specially upgraded European space simulator. ESA’s Large Space Simulator is now the most powerful in the world and the only facility capable of reproducing Mercury’s hellish environment for a full-scale spacecraft. The Mercury Magnetospheric Orbiter (MMO) has survived a simulated voyage to the innermost planet. The octagonal spacecraft, which is Japan’s contribution to BepiColombo, and its ESA sunshield withstood temperatures higher than 350 degrees C. Worse than a Ohio August day!

The Mercury Magnetospheric Orbiter (MMO) is tested inside ESA's Large Space Simulator. The octagonal spacecraft is Japan’s contribution to BepiColombo, and must survive temperatures of 350°C. Credits: ESA/JAXA
This is a taste of things to come for the spacecraft. BepiColombo will encounter fully ten times the radiation power received by a satellite in orbit around Earth and, to simulate this, the Large Space Simulator (LSS) at ESA’s ESTEC center in the Netherlands had to be specially adapted. Engineers talk about the power of the Sun in units called the solar constant. This is how much energy is received every second through a square meter of space at the distance of Earth’s orbit. “Previously, the LSS was capable of simulating a solar constant or two. Now it has been upgraded to produce ten solar constants,” says Jan van Casteren, ESA BepiColombo project manager.

The improvements have been achieved in two ways: the lamps from the simulators are being used at their maximum power and the mirrors that focus the beam have been adjusted. (Think magnifying glass focusing the Sun. We’ve all done it!) Instead of producing a parallel beam of light 6 m across, they now concentrate the light into a cone just 2.7 m in diameter when it reaches the spacecraft. This creates a beam so fierce that a new shroud with a larger cooling capacity had to be installed to ‘catch’ the light that missed the spacecraft and prevent the chamber walls from heating up. BepiColombo consists of separate modules. The MMO will investigate the magnetic environment of Mercury. It is kept cool during its six-year cruise to Mercury by the sunshield. These are the two modules that have now completed their thermal tests. “The sunshield test was successful. Its function to protect the MMO spacecraft during the cruise phase was demonstrated,” says Jan.

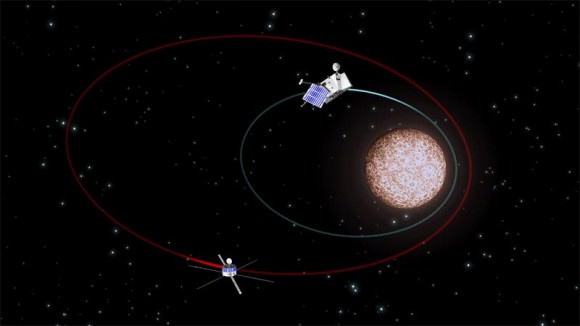
BepiColombo consists of two spacecraft that will orbit Mercury. The Mercury Magnetospheric Orbiter (MMO) follows a larger orbit and investigates the planet's magnetic field. The Mercury Planetary Orbiter (MPO) traces a lower orbit and is designed to study the planet itself. Credits: ESA, C. Carreau

Once at Mercury, most of the Sun’s fearsome heat will be prevented from entering BepiColombo by special thermal blankets. They consist of multiple layers including a white ceramic outer layer and several metallic layers to reflect as much heat as possible back into space. “The tests allowed us to measure the thermal blanket’s performance. The results allow us to prepare some adjustments for the tests of the Mercury Planetary Orbiter next year,” says Jan.

In addition to enduring temperatures of 350 degrees C, ESA’s Mercury Planetary Orbiter (MPO) will go where no spacecraft has gone before: down into a low elliptical orbit around Mercury, of between just 400 km and 1500 km above the planet’s scorching surface. At that proximity, Mercury is worse than a hot plate on a cooker, releasing floods of infrared radiation into space. So, the MPO will have to deal with this as well as the solar heat. The MPO begins its tests in the LSS in the summer.

Summer? What a perfect season to begin!

Sun Plays A Major Role In Climate Change

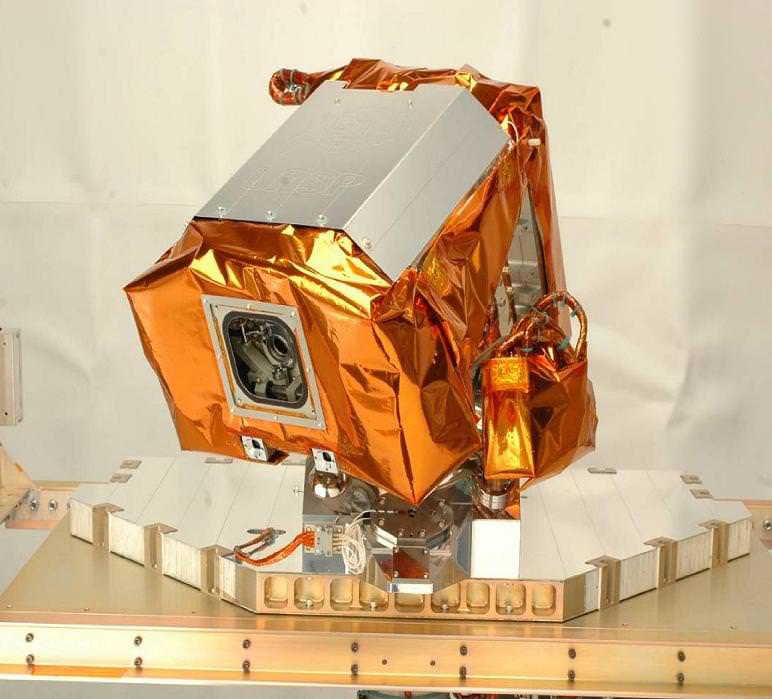
Total Irradiance Monitor (TIM)

[/caption]

It’s not often I voice my opinion on climate change without sounding like a tree-hugger or a total kook. However, in this circumstance I had an opportunity to read about some findings that hit home with my own personal thoughts and I figured you might like to know, too.

According to the latest American Astronomical Society Press Release, “Scientists have taken a major step toward accurately determining the amount of energy that the Sun provides to Earth, and how variations in that energy may contribute to climate change. In a new study of laboratory and satellite data, researchers report a lower value of that energy, known as total solar irradiance, than previously measured and demonstrate that the satellite instrument that made the measurement — which has a new optical design and was calibrated in a new way — has significantly improved the accuracy and consistency of such measurements. The new findings give confidence, the researchers say, that other, newer satellites expected to launch starting early this year will measure total solar irradiance with adequate repeatability — and with little enough uncertainty — to help resolve the long-standing question of how significant a contributor solar fluctuations are to the rising average global temperature of the planet.

“Improved accuracies and stabilities in the long-term total solar irradiance record mean improved estimates of the Sun’s influence on Earth’s climate,” said Greg Kopp of the Laboratory for Atmospheric and Space Physics (LASP) of the University of Colorado Boulder. Kopp, who led the study, and Judith Lean of the Naval Research Laboratory, in Washington, D.C., published their findings today in Geophysical Research Letters, a journal of the American Geophysical Union. The new work will help advance scientists’ ability to understand the contribution of natural versus anthropogenic causes of climate change, the scientists said. That’s because the research improves the accuracy of the continuous, 32-year record of total solar irradiance, or TSI. Energy from the Sun is the primary energy input driving Earth’s climate, which scientific consensus indicates has been warming since the Industrial Revolution.

Lean specializes in the effects of the Sun on climate and space weather. She said, “Scientists estimating Earth’s climate sensitivities need accurate and stable solar irradiance records to know exactly how much warming to attribute to changes in the Sun’s output, versus anthropogenic or other natural forcings.” The new, lower TSI value was measured by the LASP-built Total Irradiance Monitor (TIM) instrument on the NASA Solar Radiation and Climate Experiment (SORCE) spacecraft. Tests at a new calibration facility at LASP verify the lower TSI value. The ground- based calibration facility enables scientists to validate their instruments under on-orbit conditions against a reference standard calibrated by the National Institute of Standards and Technology (NIST). Before the development of the calibration facility, solar irradiance instruments would frequently return different measurements from each other, depending on their calibration. To maintain a long-term record of the Sun’s output through time, scientists had to rely on overlapping measurements that allowed them to intercalibrate among instruments.

Kopp said, “The calibration facility indicates that the TIM is producing the most accurate total solar irradiance results to date, providing a baseline value that allows us to make the entire 32-year record more accurate. This baseline value will also help ensure that we can maintain this important climate data record for years into the future, reducing the risks from a potential gap in spacecraft measurements.” Lean said, “We are eager to see how this lower irradiance value affects global climate models, which use various parameters to reproduce current climate: incoming solar radiation is a decisive factor. An improved and extended solar data record will make it easier for us to understand how fluctuations in the Sun’s energy output over time affect temperatures, and how Earth’s climate responds to radiative forcing.” Lean’s model, which is now adjusted to the new lower absolute TSI values, reproduces with high fidelity the TSI variations that TIM observes and indicates that solar irradiance levels during the recent prolonged solar minimum period were likely comparable to levels in past solar minima. Using this model, Lean estimates that solar variability produces about 0.1 degree Celsius (0.18 degree Fahrenheit) global warming during the 11-year solar cycle, but is likely not the main cause of global warming in the past three decades.”

I think the new findngs are awesome. For one, we really haven’t been studying our weather with any great accuracy or scientific instruments for that long – only about 5 decades. For those of us who enjoy viewing sunspots, you also might have noticed that when sunspot activity is high, it really does seem to affect our weather – especially cloud cover. Global warming is real, and there is no doubt that mankind has contributed to it. However, take solar findings very much to heart because my opinion is the Sun plays a more important role in our climate than we could have ever dreamed possible.

Original Source: American Geophysical Union – Image Courtesy of NASA

New Light On Galactic Pair – M81 and M82

A WISE Look At Messier 81 and Messier 82

[/caption]

Almost every amateur astronomer has viewed the ghostly glow of galactic pair, Messier 81 and Messier 82. They’re easily visible in small binoculars from a dark sky site and reveal wonderful details in a telescope as aperture increases. We’ve marveled over M81’s smooth, star-rich structure and the disturbed spindle-shaped structure of M82. We know the pair have interacted and the huge spiral has ingested stars from its companion – but today we know a whole lot more…

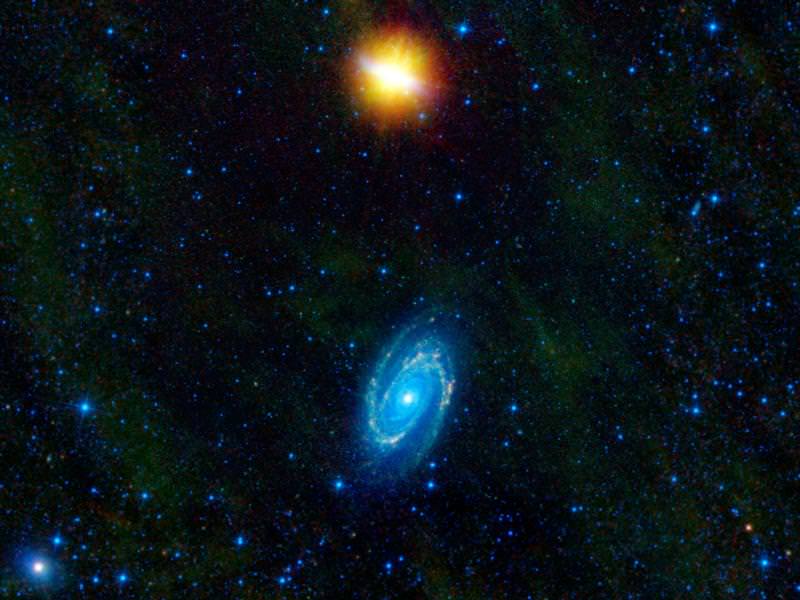
According to today’s press release from the American Astronomical Society, when the pair swept by each other, gravitational interactions triggered new bursts of star formation. In the case of Messier 82, also known as the Cigar Galaxy, the encounter has likely triggered a tremendous wave of new star birth at its core. Intense radiation from newborn massive stars is blowing copious amounts of gas and smoky dust out of the galaxy, as seen in the WISE image in yellow hues. The Cigar Galaxy is pictured above Messier 81. “What’s unique about the WISE view of this duo is that we can see both galaxies in one shot, and we can really see their differences,” said Ned Wright of UCLA, the principal investigator of WISE. “Because the Cigar Galaxy is bursting with star formation, it’s really bright in the infrared, and looks dramatically different from its less active companion.”

The WISE mission completed its main goal of mapping the sky in infrared light in October 2010, covering it one-and-one-half times before its frozen coolant ran out, as planned. During that time, it snapped pictures of hundreds of millions of objects, the first batch of which will be released to the astronomy community in April 2011. WISE is continuing its scan of the skies without coolant using two of its four infrared channels — the two shorter-wavelength channels not affected by the warmer temperatures. The mission’s ongoing survey is now focused primarily on asteroids and comets. Because WISE has imaged the entire sky, it excels at producing large mosaics like this new picture of Messier 81 and Messier 82, which covers a patch of sky equivalent to three-by-three full Moons, or 1.5 by 1.5 degrees.

It is likely these partner galaxies will continue to dance around each other, and eventually merge into a single entity. They are both spiral galaxies, but Messier 82 is seen from an edge-on perspective, and thus appears in visible light as a thin, cigar-like bar. (To me it has always looked like a child’s dirty kite string wrapped around a stick, eh?) When viewed in infrared light, Messier 82 is the brightest galaxy in the sky. It is what scientists refer to as a starburst galaxy because it is churning out large numbers of new stars. “The WISE picture really shows how spectacular Messier 82 shines in the infrared even though it is relatively puny in both size and mass compared to its big brother, Messier 81,” said Tom Jarrett, a member of the WISE team at the California Institute of Technology in Pasadena.

In this WISE view, infrared light has been color coded so that we can see it with our eyes. The shortest wavelengths (3.4 and 3.6 microns) are shown in blue and blue-green, or cyan, and the longer wavelengths (12 and 22 microns) are green and red. Messier 82 appears in yellow hues because its cocoon of dust gives off longer wavelengths of light (the yellow is a result of combining green and red). This dust is made primarily of polycyclic aromatic hydrocarbons, which are found on Earth as soot.

Messier 81, also known as Bode’s Galaxy, appears blue in the infrared image because it is not as dusty. The blue light is from stars in the galaxy. Knots of yellow seen dotting the spiral arms are dusty areas of recent star formation, most likely triggered by the galaxy’s encounter with its rowdy partner. “It’s striking how the same event stimulated a classic spiral galaxy in Messier 81, and a raging starburst in Messier 82,” said WISE Project Scientist Peter Eisenhardt of NASA’s Jet Propulsion Laboratory in Pasadena, Calif. “WISE is finding the most extreme starbursts across the whole sky, out to distances over a thousand times greater than Messier 82.”

Next time you view M81 and M82, perhaps you’ll see them in a new light?

Original Source: American Astronomical Society Press Release – WISE Image Credit: NASA
.

When A Standard Candle Flickers

Standard Candle In The Wind

[/caption]

Roll over, Edwin Hubble. For many decades astronomers have relied upon the “standard candle” to express the brightness of a Cepheid variable star, thereby establishing a distance. But not anymore… Now there’s evidence that Cepheid variables can shrink in mass and that bit of information changes the whole picture. The findings, made with NASA’s Spitzer Space Telescope, will help astronomers make even more precise measurements of the size, age and expansion rate of our Universe. Strap on your cosmic seat belt and read on…

According to today’s American Astronomical Society Press Release, standard candles are astronomical objects that make up the rungs of the so-called cosmic distance ladder, a tool for measuring the distances to farther and farther galaxies. The ladder’s first rung consists of pulsating stars called Cepheid variables, or Cepheids for short. Measurements of the distances to these stars from Earth are critical in making precise measurements of even more distant objects. Each rung on the ladder depends on the previous one, so without accurate Cepheid measurements, the whole cosmic distance ladder would come unhinged. Now, new observations from Spitzer show that keeping this ladder secure requires even more careful attention to Cepheids. The telescope’s infrared observations of one particular Cepheid provide the first direct evidence that these stars can lose mass—or essentially shrink. This could affect measurements of their distances.

“We have shown that these particular standard candles are slowly consumed by their wind,” said Massimo Marengo of Iowa State University, Ames, Iowa, lead author of a recent study on the discovery appearing in the Astronomical Journal. “When using Cepheids as standard candles, we must be extra careful because, much like actual candles, they are consumed as they burn.”

The star in the study is Delta Cephei, which is the namesake for the entire class of Cepheids. It was discovered in 1784 in the
constellation Cepheus, or the King. Intermediate-mass stars can become Cepheids when they are middle-aged, pulsing with a regular beat that is related to how bright they are. This unique trait allows astronomers to take the pulse of a Cepheid and figure out how bright it is intrinsically—or how bright it would be if you were right next to it. By measuring how bright the star appears in the sky, and comparing this to its intrinsic brightness, it can then be determined how far away it must be. This calculation was famously performed by astronomer Edwin Hubble in 1924, leading to the revelation that our galaxy is just one of many in a vast cosmic sea. Cepheids also helped in the discovery that our universe is expanding and galaxies are drifting apart.

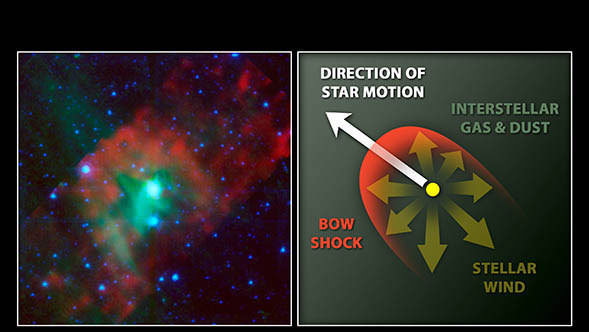
Cepheids have since become reliable rungs on the cosmic distance ladder, but mysteries about these standard candles remain. One question has been whether or not they lose mass. Winds from a Cepheid star could blow off significant amounts of gas and dust, forming a dusty cocoon around the star that would affect how bright it appears. This, in turn, would affect calculations of its distance. Previous research had hinted at such mass loss, but more direct evidence was needed. Marengo and his colleague used Spitzer’s infrared vision to study the dust around Delta Cephei. This particular star is racing along through space at high speeds, pushing interstellar gas and dust into a bow shock up ahead. Luckily for the scientists, a nearby companion star happens to be lighting the area, making the bow shock easier to see. By studying the size and structure of the shock, the team was able to show that a strong, massive wind from the star is pushing against the interstellar gas and dust. In addition, the team calculated that this wind is up to one million times stronger than the wind blown by our Sun. This proves that Delta Cephei is shrinking slightly.

Follow-up observations of other Cepheids conducted by the same team using Spitzer have shown that other Cepheids, up to 25 percent observed, are also losing mass. “Everything crumbles in cosmology studies if you don’t start up with the most precise measurements of Cepheids possible,” said Pauline Barmby of the University of Western Ontario, Canada, lead author of the follow-up Cepheid study published online Jan. 6 in the Astronomical Journal. “This discovery will allow us to better understand these stars, and use them as ever more precise distance indicators.”

Like Pluto, this means we will end up having to re-write our astronomy books… But it’s a “birth day” candle we’re ready to blow out!

Original Source: American Astronomical Society Press Release – Photo Credit: NASA

Treasure Hunting With Astrophotography

The Milky Way

[/caption]

Not very long ago we published a news release about the latest (and largest) deep sky survey image ever. The implications behind such a massive undertaking at such incredible resolution means you could spend hours studying just a few square millimeters of such a photo and find any amount of undiscovered information. Do professional astronomers have the time to search? Or can anyone have a look? That’s the topic of the latest of the latest American Astronomical Association press release – ESO: Hidden Treasures Brought to Light. Let’s find out…

According to the release ESO’s Hidden Treasures 2010 astrophotography competition attracted nearly 100 entries, and ESO is delighted to announce the winners. Hidden Treasures gave amateur astronomers the opportunity to search ESO’s vast archives of astronomical data for a well-hidden cosmic gem. Astronomy enthusiast Igor Chekalin from Russia won the first prize in this difficult but rewarding challenge — the trip of a lifetime to ESO’s Very Large Telescope at Paranal, Chile. The pictures of the Universe that can be seen in ESO’s releases are impressive. However, many hours of skillful work are required to assemble the raw gray-scale data captured by the telescopes into these colorful images, correcting them for distortions and unwanted signatures of the instrument, and enhancing them so as to bring out the details contained in the astronomical data. ESO has a team of professional image processors, but for the ESO’s Hidden Treasures 2010 competition, the experts decided to give astronomy and photography enthusiasts the opportunity to show the world what they could do with the mammoth amount of data contained in ESO’s archives.

With amateur astrophotography beginning to play a huge role in astronomical discoveries, just image what you could do with a mountain of data!

The release goes on to state the enthusiasts who responded to the call submitted nearly 100 entries in total — far exceeding initial expectations, given the difficult nature of the challenge. “We were completely taken aback both by the quantity and the quality of the images that were submitted. This was not a challenge for the faint-hearted, requiring both an advanced knowledge of data processing and an artistic eye. We are thrilled to have discovered so many talented people,” said Lars Lindberg Christensen, Head of ESO’s education and Public Outreach Department.

Digging through many terabytes of professional astronomical data, the entrants had to identify a series of gray-scale images of a celestial object that would reveal the hidden beauty of our Universe. The chance of a great reward for the lucky winner was enough to spur on the competitors; the first prize being a trip to ESO’s Very Large Telescope in Paranal, Chile, with guided tours and the opportunity to participate in a night’s observations. Runner-up prizes included an iPod, books and DVDs. Furthermore, the highest ranked images will be released for the world to see on www.eso.org as Photo Releases or Pictures of the Week, co-crediting the winners. The jury evaluated the entries based on the quality of the data processing, the originality of the image and the overall aesthetic feel. As several of the highest ranked images were submitted by the same people, the jury decided to make awards to the ten most talented participants, so as to give more people the opportunity to win a prize and reward their hard work and talent.

Kudos!

Original Source: American Astronomical Society Press Release – Image Credit: ESO

The Biggest Astrophoto… Ever!

This illustration shows the wealth of information on scales both small and large available in the SDSS-III’s new image. The picture in the top left shows the SDSS-III view of a small part of the sky, centered on the galaxy Messier 33 (M33). The middle top picture is a further zoom-in on M33, showing the spiral arms of this galaxy, including the blue knots of intense star formation known as “HII regions.” The top right-hand picture is a further zoom into M33 showing the object NGC 604, which is one of the largest HII regions in that galaxy. The figure at the bottom is a map of the whole sky derived from the SDSS-III image, divided into the northern and southern hemispheres of our galaxy. Visible in the map are the clusters and walls of galaxies that are the largest structures in the entire universe.

[/caption]

Today, the Sloan Digital Sky Survey-III (SDSS-III) is releasing the largest digital color image of the sky ever made, and it’s free to all. Just how big? Step inside and find out…

According to the American Astronomical Society press release, the image has been put together over the last decade from
millions of 2.8-megapixel images, thus creating a color image of more than a trillion pixels. Just how does that relate? Even a large format professional CCD camera will only produce about 11 million pixels and really big screen to view – but this terapixel image is so big and detailed that it would take 500,000 high-definition TVs to view it at its full resolution. Can you imagine?! “This image provides opportunities for many new scientific discoveries in the years to come,” exclaims Bob Nichol, a professor at the University of Portsmouth and Scientific Spokesperson for the SDSS-III collaboration.

Where did this huge astrophoto come from? The new image is at the heart of new data being released today by the SDSS-III collaboration at 217th American Astronomical Society meeting in Seattle. This new information, along with the previous data releases which it builds upon, gives astronomers the most comprehensive view of the night sky ever made. SDSS data have already been used to discover nearly half a billion astronomical objects, including asteroids, stars, galaxies and distant quasars. The latest, most precise positions, colors and shapes for all these objects are also being released today. (Time to update our software programs!) “This is one of the biggest bounties in the history of science,” says Professor Mike Blanton from New York University, who is leading the data archive work in SDSS-III. Blanton and many other scientists have been working for months preparing the release of all this data. “This data will be a legacy for the ages,” explains Blanton, “as previous ambitious sky surveys like the Palomar Sky Survey of the 1950s are still being used today.” And who among us hasn’t used the POSS program to confirm something we’ve seen or perhaps caught unexpectedly on an astrophotograph? “We expect the SDSS data to have that sort of shelf life,” comments Blanton.

So when did all of this begin? The image was started in 1998 using what was then the world’s largest digital camera: a 138-megapixel imaging detector on the back of a dedicated 2.5-meter telescope at the Apache Point Observatory in New Mexico, USA. Over the last decade, the Sloan Digital Sky Survey has scanned a third of the whole sky. Now, this imaging camera is being retired, and it will rightfully become a part of the permanent collection at the Smithsonian in recognition of its contributions to astronomy. “It’s been wonderful to see the science results that have come from this camera,” says Connie Rockosi, an astronomer from the University of California, Santa Cruz, who started working on the camera in the 1990s as an undergraduate student with Jim Gunn, Professor of Astronomy at Princeton University and SDSS-I/II Project Scientist. Rockosi’s entire career so far has paralleled the history of the SDSS camera. “It’s a bittersweet feeling to see this camera retired, because I’ve been working with it for nearly 20 years,” she says.

But what next? Thanks to such incredible resolution, the enormous image will form the cornerstone for new surveys of the Universe using the SDSS telescope. These surveys rely on other forms of data, such as spectra – an astronomical technique which employs specialized instruments to break the light from a star or galaxy into its component wavelengths. Spectra can be used to find the distances to distant galaxies, and the properties (such as temperature and chemical composition) of different
types of stars and galaxies. “We have upgraded the existing SDSS instruments, and we are using them to measure distances to over a million galaxies detected in this image,” explains David Schlegel, an astronomer from Lawrence Berkeley National Laboratory, and the Principal Investigator of the new SDSS-III Baryon Oscillation Spectroscopic Survey (BOSS). Schlegel
explains that measuring distances to galaxies is more time-consuming than simply taking their pictures, but in return, it provides a detailed three-dimensional map of the galaxies’ distribution in space. This is the type of accuracy we could only dream of five decades ago.

According to the press release, BOSS started taking data in 2009 and will continue until 2014, explains Schlegel. Once finished, BOSS will be the largest 3-D map of galaxies ever made, extending the original SDSS galaxy survey to a much larger volume of the Universe. The goal of BOSS is to precisely measure how so-called “Dark Energy” has changed over the recent history of the universe. These measurements will help astronomers understand the nature of this mysterious substance. “Dark energy is the biggest conundrum facing science today,” says Schlegel, “and the SDSS continues to lead the way in trying to figure out what the heck it is!” In addition to BOSS, the SDSS-III collaboration has been studying the properties and motions of hundreds of thousands of stars in the outer parts of our Milky Way Galaxy. The survey, known as the Sloan Extension for Galactic Understanding and Exploration or SEGUE started several years ago but has now been completed as part of the first year of SDSS-III.

Need more? In conjunction with the image being released today, astronomers from SEGUE are also releasing the largest map of the outer galaxy ever released. “This map has been used to study the distribution of stars in our galaxy,” says Rockosi, the Principal Investigator of SEGUE. “We have found many streams of stars that originally belonged to other galaxies that were torn apart by the gravity of our Milky Way. We’ve long thought that galaxies evolve by merging with others; the SEGUE observations confirm this basic picture.”

So what’s next? SDSS-III is also undertaking two other surveys of our galaxy through 2014. The first, called MARVELS, will use a new instrument to repeatedly measure spectra for approximately 8,500 nearby stars like our own Sun, looking for the telltale wobbles caused by large Jupiter-like planets orbiting them. MARVELS is predicted to discover around a hundred new giant planets, as well as potentially finding a similar number of “brown dwarfs” that are intermediate between the most massive planets and the smallest stars. The second survey is the APO Galactic Evolution Experiment (APOGEE), which is using one of the largest infrared spectrographs ever built to undertake the first systematic study of stars in all parts of our galaxy; even stars on the other side of our galaxy beyond the central bulge. Such stars are traditionally difficult to study as their visible light is obscured by large amounts of dust in the disk of our galaxy. However, by working at longer, infrared wavelengths, APOGEE can study them in great detail, thus revealing their properties and motions to explore how the different components of our galaxy were put together. “The SDSS-III is an amazingly diverse project built on the legacy of the original SDSS and SDSS-II surveys,” summarizes Nichol. “This image is the culmination of decades of work by hundreds of people, and has already produced many incredible discoveries. Astronomy has a rich tradition of making all such data freely available to the public, and
we hope everyone will enjoy it as much as we have.”

I do believe we will…

(The SDSS-III Data Release Eight (DR8) can be found at http://www.sdss3.org/dr8. All data published as part of DR8 is freely available to other astronomers, scientists, and the public. Technical journal papers describing DR8 and the SDSS-III project are on the arXiv e-Print server (http://arxiv.org).)

Credits: American Astronomical Society Press Release, M. Blanton and the SDSS-III.
Hubble Eyes Hanny’s Voorwerp

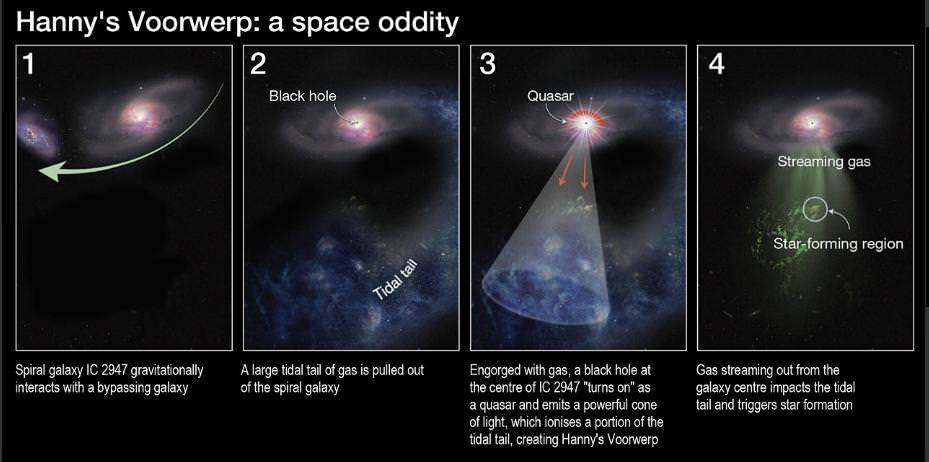
This diagram explains the formation of the strange green object known as Hanny’s Voorwerp. Astronomers believe that it is part of the long streamer of gas that extends from galaxy IC 2497, lit up brightly by the searchlight beam of a recently extinguished quasar.

[/caption]

Almost four years ago a group of astronomers known as the Galaxy Zoo made a very exciting discovery – one they named “Hanny’s Voorwerp”. Although the action occurred a hundred thousand years ago and somewhere in the neighborhood of 700 million light years away, a once upon a time quasar burned brighter than its neighboring galaxy. While the tidal pull of massive spiral IC 2497 shredded a gas rich dwarf galaxy, the incredible outpouring of ultraviolet and X-ray radiation combined with the quasar ignited the gases to light… but what exactly is it? The Hubble Space Telescope turned its eye in the direction of Leo Minor to find out…

According to the American Astronomical Society press release: “One of the strangest space objects ever seen is being scrutinized by the penetrating vision of the NASA/ESA Hubble Space Telescope. A mysterious, glowing green blob of gas is floating in space near a spiral galaxy. Hubble uncovered delicate filaments of gas and a pocket of young star clusters in the giant object, which is the size of the Milky Way. The Hubble revelations are the latest finds in an ongoing probe of Hannyrquote s Voorwerp (Hanny’s Object in Dutch). It is named after Hanny van Arkel, the Dutch schoolteacher who discovered the ghostly structure in 2007 while participating in the online Galaxy Zoo project. Galaxy Zoo enlists the public to help classify more than a million galaxies catalogued in the Sloan Digital Sky Survey. The project has expanded to include Galaxy Zoo: Hubble, in which the public is asked to assess tens of thousands of galaxies in deep imagery from the Hubble Space Telescope.” In the sharpest view yet of Hanny’s Voorwerp, Hubble’s Wide Field Camera 3 and Advanced Camera for Surveys have uncovered star birth in a region of the green object that faces the spiral galaxy IC 2497 — a bright, energetic object that is powered by a black hole.

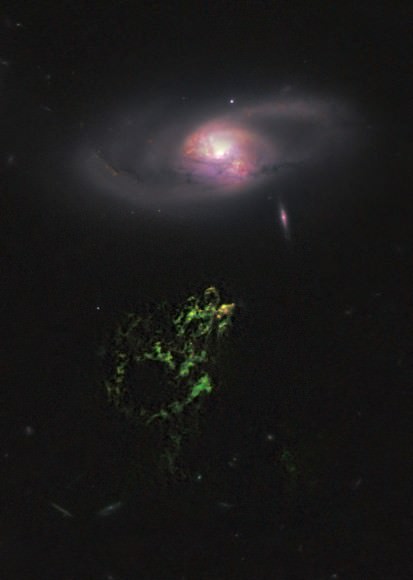
In this image by the NASA/ESA Hubble Space Telescope, an unusual, ghostly green blob of gas appears to float near a normal-looking spiral galaxy.

This Hubble view reveals new details in colorful clarity – such as a area of star clusters whose members are only a couple of million years old… and the chemically charged yellowish-orange area at the tip of Milky Way sized Hanny’s Voorwerp. The image was made by combining data from the Advanced Camera for Surveys (ACS) and the Wide Field Camera 3 (WFC3) onboard Hubble, with data from the WIYN telescope at Kitt Peak, Arizona, USA. The ACS exposures were taken 12 April 2010; the WFC3 data, 4 April 2010.

“The star clusters are localized, confined to an area that is over a few thousand light-years wide,” explains astronomer William Keel of the University of Alabama in Tuscaloosa, leader of the Hubble study. “The region may have been churning out stars for several million years. They are so dim that they have previously been lost in the brilliant light of the surrounding gas.”

The press release goes on to state that recent X-ray observations have revealed why Hanny’s Voorwerp caught the proverbial eye of astronomers. The galaxy’s rambunctious core produced a quasar, a powerful light beacon powered by a black hole. The quasar shot a broad beam of light in Hanny’s Voorwerp’s direction, illuminating the gas cloud and making it a space oddity. Its bright green color is from glowing oxygen. “We just missed catching the quasar, because it turned off no more than 200,000 years ago, so what we’re seeing is the afterglow from the quasar,” Keel says. “This implies that it might flicker on and off, which is typical of quasars, but we’ve never seen such a dramatic change happen so rapidly.”

The quasar’s outburst also may have cast a shadow on the blob. This feature gives the illusion of a gaping hole about 20,000 light-years wide in Hanny’s Voorwerp. Hubble reveals sharp edges around the apparent opening, suggesting that an object close to the quasar may have blocked some of the light and projected a shadow on Hanny’s Voorwerp. This phenomenon is similar to a fly on a movie projector lens casting a shadow on a movie screen. (Or your little brother Tom making a duck face with his hand while your Mom isn’t looking.) Radio studies have revealed that Hanny’s Voorwerp is not just an island gas cloud floating in space awaiting a three-hour tour. The glowing blob is part of a long, twisting rope of gas, or tidal tail, about 300,000 light-years long that wraps around the galaxy. The only optically visible part of the rope is Hanny’s Voorwerp. The illuminated object is so huge that it stretches from 44,000 light-years to 136,000 light-years from the galaxy’s core. The quasar, the outflow of gas that instigated the star birth, and the long, gaseous tidal tail point to a rough life for IC 2497.

“The evidence suggests that IC 2497 may have merged with another galaxy about a billion years ago,” Keel explains. “The Hubble images show in exquisite detail that the spiral arms are twisted, so the galaxy hasn’t completely settled down.” In Keel’s scenario, the merger expelled the long streamer of gas from the galaxy and funneled gas and stars into the center, which fed the black hole. The engorged black hole then powered the quasar, which launched two cones of light. One light beam illuminated part of the tidal tail, now called Hanny’s Voorwerp.” says Keel. “About a million years ago, shock waves produced glowing gas near the galaxy’s core and blasted it outward. The glowing gas is seen only in Hubble images and spectra. The outburst may have triggered star formation in Hanny’s Voorwerp. Less than 200,000 years ago, the quasar dropped in brightness by 100 times or more, leaving an ordinary-looking core.

New images of the galaxy’s dusty core from Hubble’s Space Telescope Imaging Spectrograph show an expanding bubble of gas blown out of one side of the core, perhaps evidence of the sputtering quasar’s final gasps. The expanding ring of gas is still too small for ground-based telescopes to detect. “This quasar may have been active for a few million years, which perhaps indicates that quasars blink on and off on timescales of millions of years, not the 100 million years that theory had suggested,” Keel says. He added that the quasar could light up again if more material is dumped around the black hole.

Fascinating evidence which confirms the team’s original explanation… Go Zoo!

Credits: NASA, ESA, William Keel -University of Alabama, Tuscaloosa, the Galaxy Zoo team and STScI Press releases.

Hide And Go Seek…. Supermassive Black Hole Peeks From Behind The Skirt Of A Dwarf Galaxy

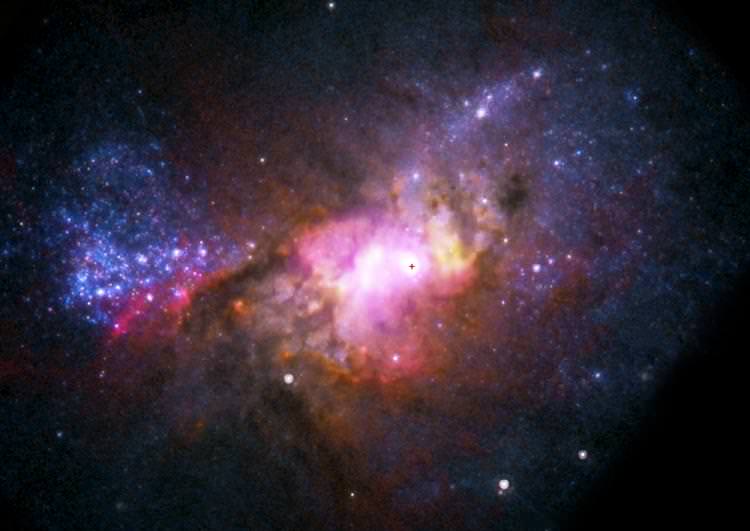
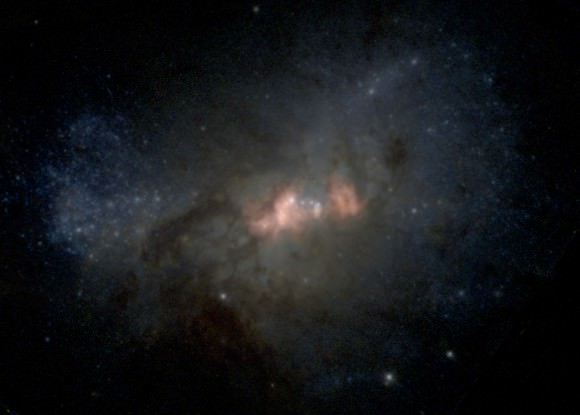
Composite image of the dwarf galaxy Henize 2-10. Hubble Space Telescope data is colored red, green and blue, Very Large Array data is yellow and the Chandra X-Ray Observatory data is purple. Cross marks presumed location of the supermassive black hole in the galaxy.

[/caption]

It’s a bird… It’s a plane… It’s a million times more massive than our Sun! Just how big do you have to be to hide something really big? Well, in the case of a supermassive black hole all you have to be is a small galaxy.

According to the American Astronomical Society Press Release the surprising discovery of a supermassive black hole in a small nearby galaxy has given astronomers a tantalizing look at how black holes and galaxies may have grown in the early history of the Universe. Finding a black hole a million times more massive than the Sun in a star-forming dwarf galaxy isn’t exactly child’s play – but it is a strong indication that supermassive black holes formed before the buildup of galaxies.

So what’s its name? The big little galaxy is called Henize 2-10. Located 30 million light-years from Earth, it’s not unknown to astonomers and is noted for rapid star formation. This irregular player is roughly 3% the size of the Milky Way and scientists think it may greatly resemble some of the first galaxies for form in the early Universe. “This galaxy gives us important clues about a very early phase of galaxy evolution that has not been observed before,” said Amy Reines, a Ph.D. candidate at the University of Virginia.

We’ve been aware for some time that supermassive black holes are present in the cores of all “full-sized” galaxies – however, we’re a bit more used to balancing the scale. In the nearby Universe, there is a direct relationship — a constant ratio — between the masses of the black holes and that of the central “bulges” of the galaxies, leading them to conclude that the black holes and bulges affected each others’ growth.

Two years ago, an international team of astronomers found that black holes in young galaxies in the early Universe were more massive than this ratio would indicate…

The dwarf galaxy Henize 2-10, seen in visible light by the Hubble Space Telescope. The central, light-pink region shows an area of radio emission, seen with the Very Large Array. This area indicates the presence of a supermassive black hole drawing in material from its surroundings.

“Now, we have found a dwarf galaxy with no bulge at all, yet it has a supermassive black hole. This greatly strengthens the case for the black holes developing first, before the galaxy’s bulge is formed,” Reines said. She, along with Gregory Sivakoff and Kelsey Johnson of the University of Virginia and the National Radio Astronomy Observatory (NRAO), and Crystal Brogan of the NRAO, observed Henize 2-10 with the National Science Foundation’s Very Large Array radio telescope and with the inquisitive eye of the Hubble Space Telescope. What did they find hiding behind the neighbor’s hedges? How about a region near the center of the galaxy that strongly emits radio waves with characteristics of those emitted by super-fast “jets” of material spewed outward from areas close to a black hole. A concept we’ve come quite familiar with in recent years!

Next up, they then searched images from the Chandra X-Ray Observatory that showed this same, radio-bright region to be strongly emitting energetic X-rays. This combination, they said, indicates an active, black-hole-powered, galactic nucleus. “Not many dwarf galaxies are known to have massive black holes,” Sivakoff said.

Of course, there are central black holes of roughly the same mass as the one in Henize 2-10 have been found in other galaxies, those galaxies all have much more regular shapes – the “normal” kids of the hood. Henize 2-10 differs not only in its irregular shape and small size but also in its furious star formation, concentrated in numerous, very dense super star clusters. “This galaxy probably resembles those in the very young Universe, when galaxies were just starting to form and were colliding frequently. All its properties, including the supermassive black hole, are giving us important new clues about how these black holes and galaxies formed at that time,” Johnson said.

Kids… Gotta’ love ’em!

CREDIT: Reines, et al., David Nidever, NRAO/AUI/NSF, NASA

2011 Quadrantid Meteor Shower… Tonight’s the Night!

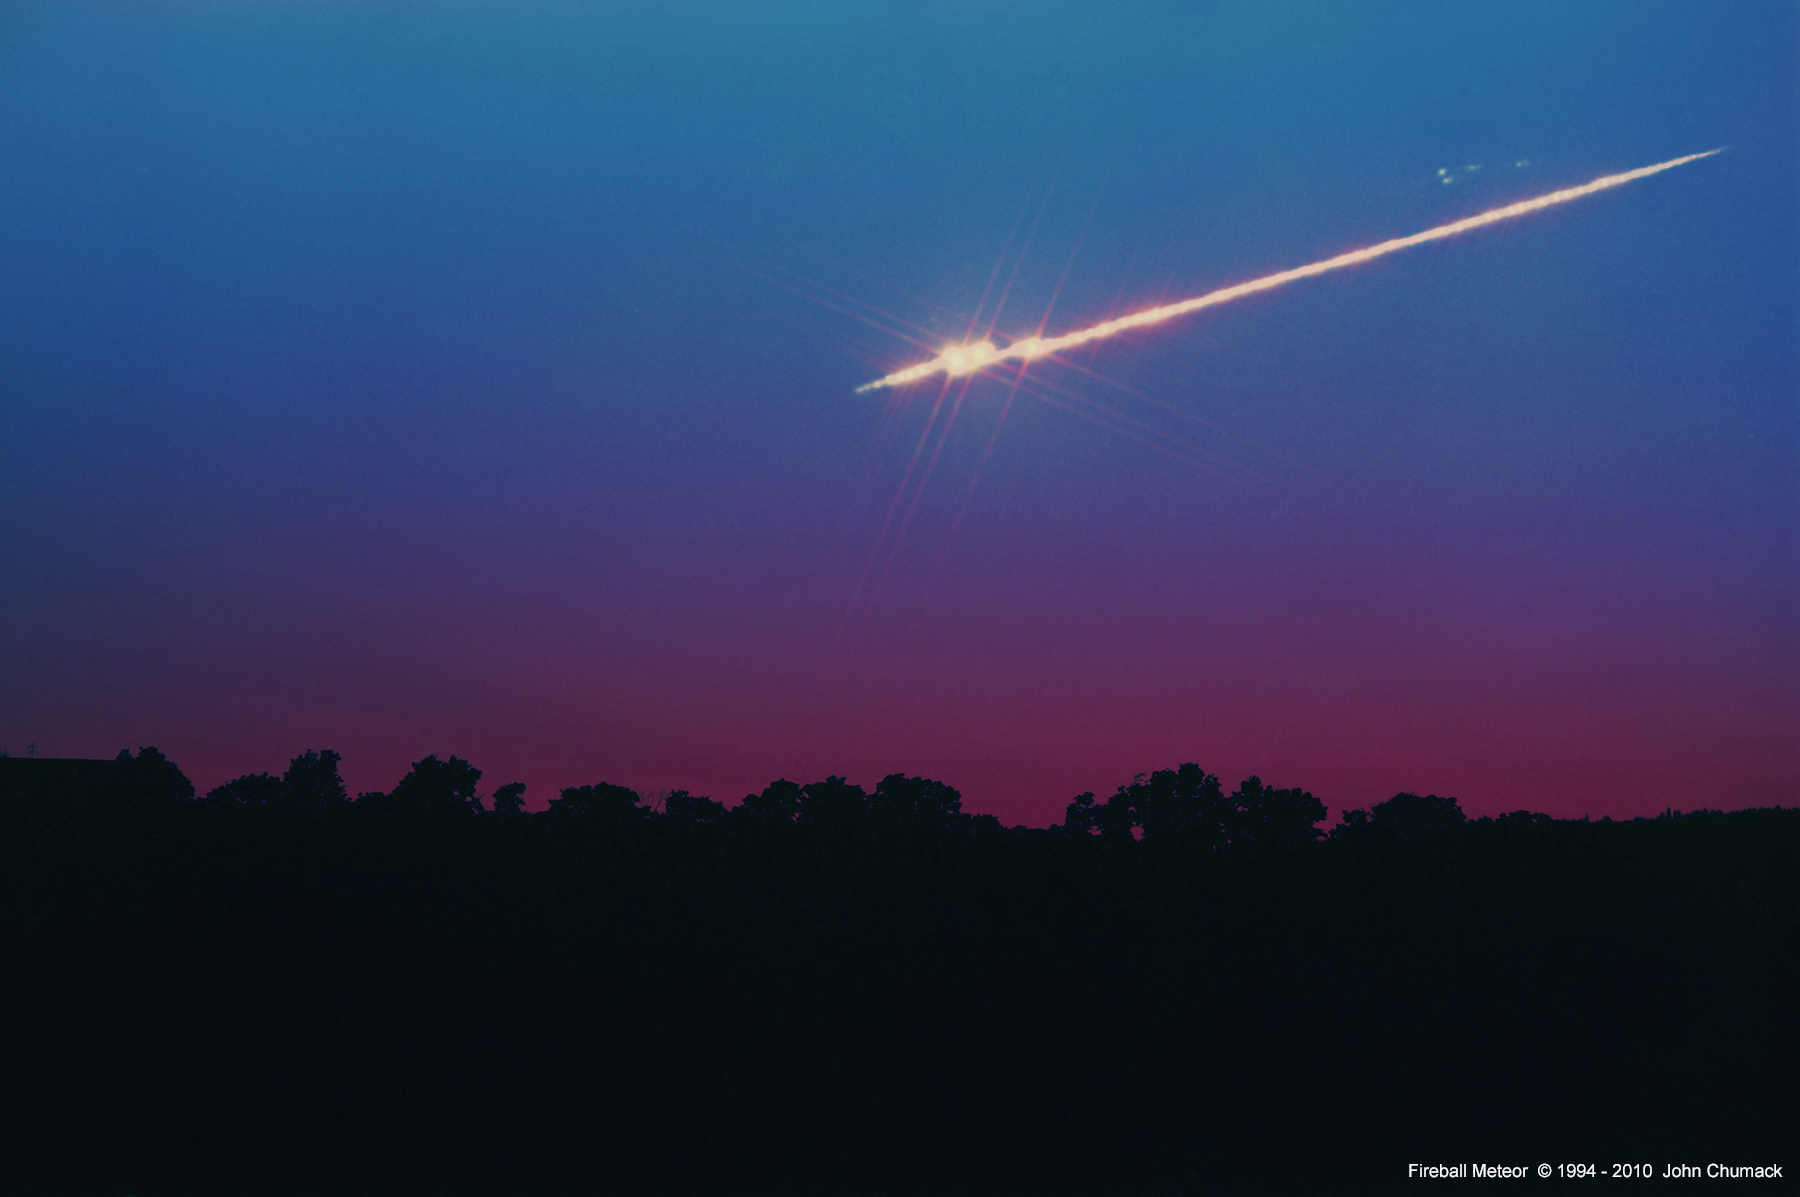
"Fireball Breakup" by John Chumack

[/caption]

In just a few hours the peak of the first meteor shower of 2011 will begin – the Quadrantids. Where did these mysterious meteors begin their life and how can you observe one yourself? Then step inside…

Beginning each New Year and lasting for nearly a week, the Quadrantid Meteor Shower sparkles across the night sky for nearly all viewers around the world. Its radiant belongs to an extinct constellation once known as Quadran Muralis, but any meteors will seem to come from the general direction of bright Arcturus and Bootes. This is a very narrow stream, which may have once belonged to a portion of the Aquarids, but recent scientific data points to a what may have been a cosmic collision. According the most recent data, the Quandrantid meteors may have been formed about five centuries ago when a near-Earth asteroid named 2003 EH1 and a comet smashed into one another. Historic records from ancient China put comet C/1490 Y1 in the path of probability.

As Jupiter‘s gravity continues to perturb the stream, another 400 years may mean this shower will become as extinct as the constellation for which it was once known, but we aren’t out of the running just yet. “Peaking in the wee morning hours of Tuesday, Jan. 4, the Quads have a maximum rate of about 100 per hour (varies between 60 and 200),” says Bill Cooke of NASA’s Meteoroid Environment Office. “What makes this year so special is that the Moon is New on the night of the peak, so there will be no interference from moonlight.”

As exciting as it may seem, there are a few problems associated with observing the Quadrantid meteor shower. The first is the weather, because this northern hemisphere show occurs during a notoriously cold season making observations uncomfortable at best. The second is the brevity of the activity itself. Because Earth intersects the debris orbit of 2003 EH1 at a perpendicular angle, we zip right through the trail. That’s why the shower activity is so fast and slightly unpredictable. A third consideration is the high probability of cloud cover – but take heart… NASA has you covered!

“Got clouds? No problem.” says SpaceWeather. “You can stay inside and listen to the Quadrantids. Tune into SpaceWeather Radio for a live audio stream from the Air Force Space Surveillance Radar. When a Quadrantid passes over the facility, you will hear a “ping” caused by the radar’s powerful transmitter echoing from the meteor’s ion trail. During the shower’s peak, the soundtrack is guaranteed to entertain.

So where and when to look? “You can start watching after 2:30am in the North to North East look between the handle of the Big Dipper -Ursa Major and the Constellation of Bootes or the Kite shaped constellation, this is the radiant location as the Meteors will appear to radiate from this general area.” says professional astrophotographer, John Chumack. “Or after 2:30am simply look between the North Star and bright star Arcturus in the East. The Quadrantid Meteors will appear to be coming from this general area of the sky. There is no moon present during this year’s shower, so you can watch all night if you like without moonlight interfering, but the best time will be after 2:30am. As the night goes on the Big Dipper, Bootes and Arcturus climb higher into the sky, so keep watching because the number of meteors usually picks up after 2:30am and gets better through 6:00am. as Earth rotates into the stream. Meteors can appear anywhere in the sky, so look in all directions of the sky as the Quadrantid radiant reaches straight over head. The Quadrantid Meteors are rather fast movers. They enter the atmosphere at about 90,000 to 120,000mph, and can have some impressive long trails.”

Will the Quadrantid Meteor Shower live up to its expectations? No one knows for sure… But we’ll be watching!

Many thanks to John Chumack of Galactic Images for his inspiring photo and to NASA for the locator chart. We thank you so much!

January 4, 2011 – Partial Solar Eclipse Reminder

Courtesy of NASA

[/caption]

This year we’re in for a real treat! The citizens of planet Earth will be treated to not one – but four – partial solar eclipses and the first will begin on January 4. Ready to find out where and when? Then step inside….

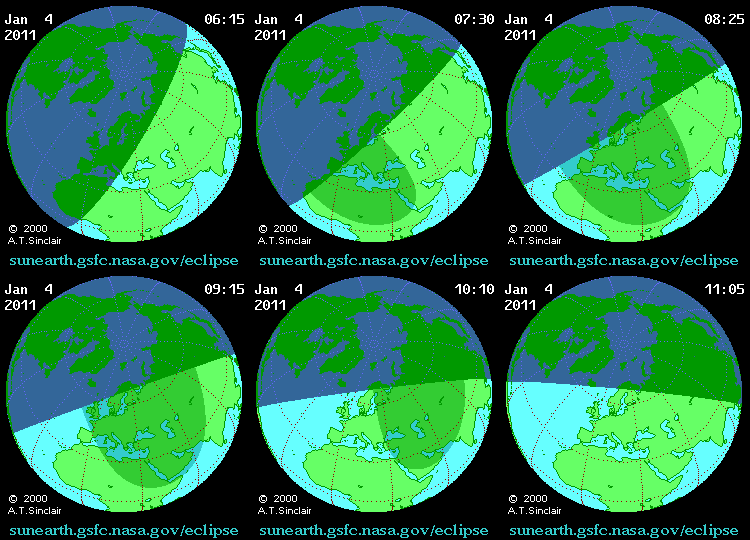
Courtesy of NASA (click to animate)
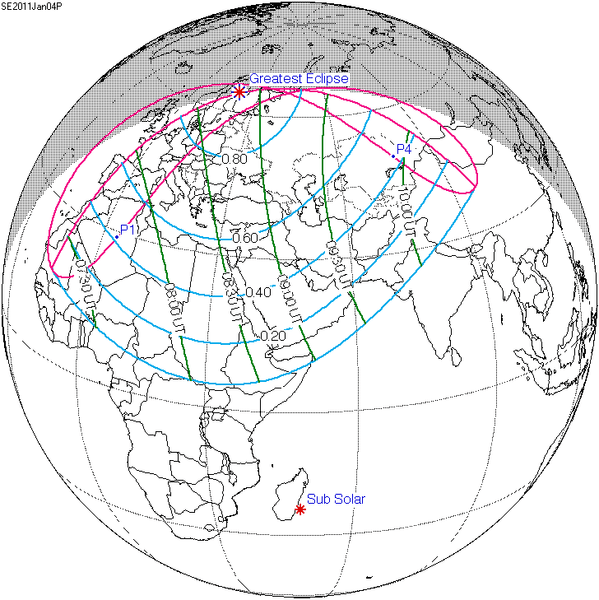
The first partial solar eclipse 2011 is scheduled for January 4th, 2011, and will be seen in Europe, Africa and Central Asia. This eclipse will begin at 06:40:11 UT (Universal Time)) and culminates at 11:00:54 UT. The greatest eclipse – the point of time when the distance between the Moon’s shadow axis and Earth’s center is the minimum – will happen at 08:50:35 UT over northern Sweden. If you live in northern Africa, the Middle East and Central Asia, you will be able to witness this eclipse.

If you’re planning on watching, remember eye safety and use a proper solar filter for telescopes and binoculars. If it’s too late to get a filter or your budget won’t allow, why not try building your own pinhole projector? Get two pieces of cardboard – one will need to be white or have white paper attached to it for the screen. Cut a small square in the other piece of cardboard, and tape aluminum foil over the square. Now make a pinhole in the middle of the foil. This is your “projector”. With the Sun behind you, hold the pinhole projector as far away from the screen as you can. The farther away you are from the screen, the bigger your image will be. You won’t be able to see fine details like sunspots, but you’ll easily see the changes as the Moon passes over the face of the Sun!

Don’t be upset if you don’t catch this eclipse. The next will happen on June 1, 2011 and be for the eastern region of Asia, northern region of North America and some islands of the North Atlantic. Again? How about July 1, 2011 and this time be over the Indian Ocean and the small islands in this ocean. Still not found you? Then how about November 25, 2011 and southern regions of Africa and Australia and whole of Antarctica!

Want to watch the eclipes live? Then join the cast and crew at Bareket Observatory and at AstronomyLive.com!