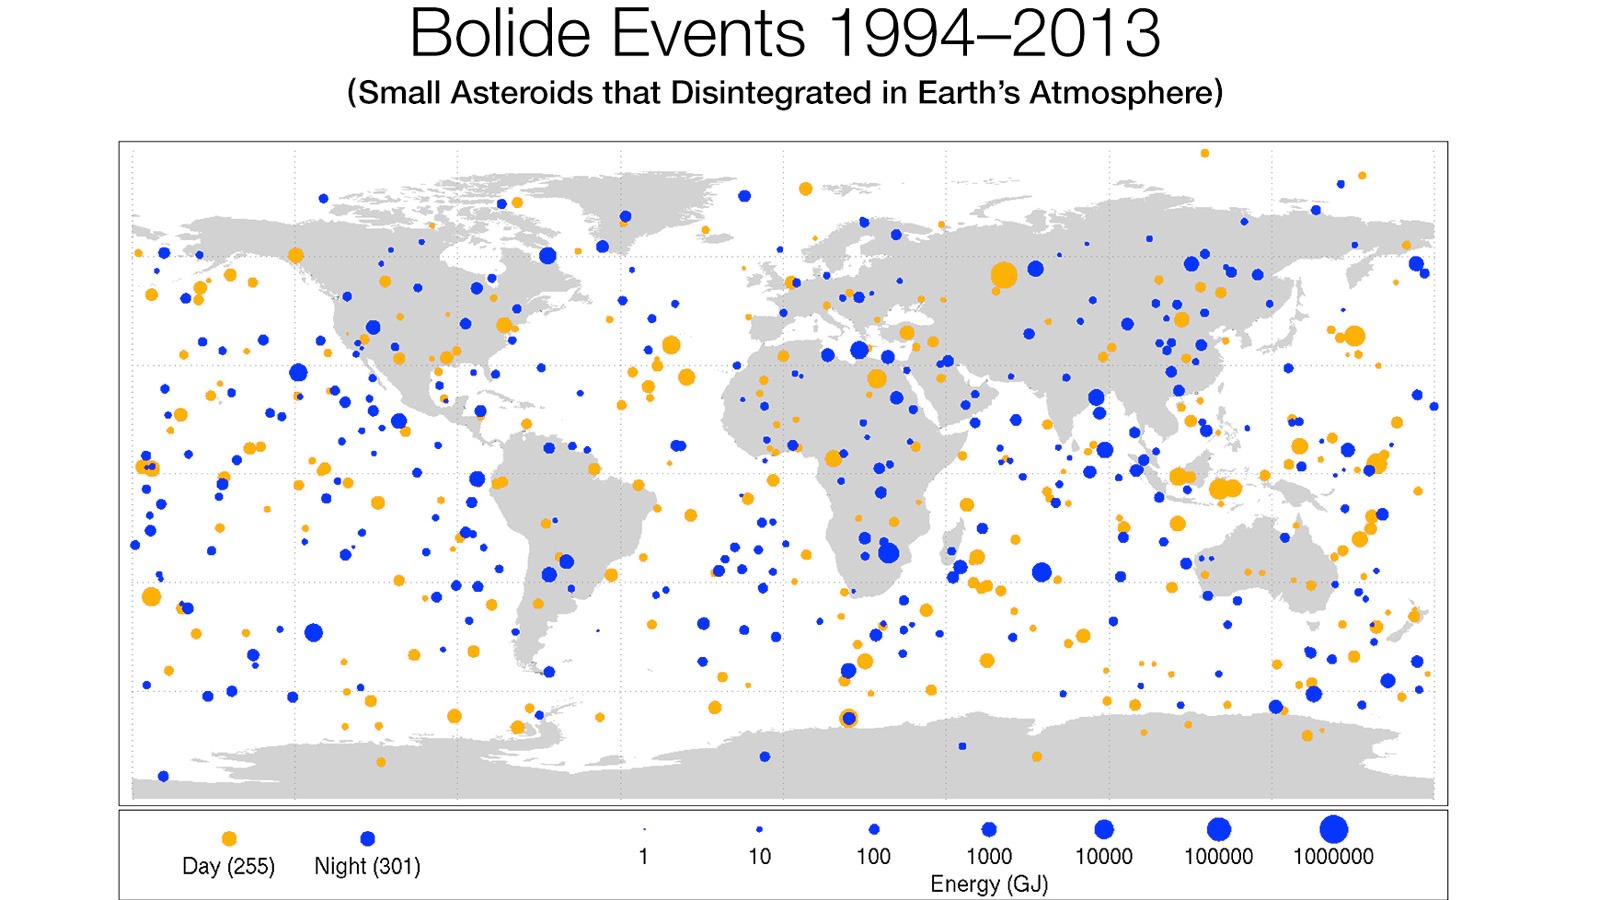
How hazardous are the thousands and millions of asteroids that surround the third rock from the Sun – Earth? Since an asteroid impact represents a real risk to life and property, this is a question that has been begging for answers for decades. But now, scientists at NASA’s Jet Propulsion Laboratory have received data from a variety of US Department of Defense assets and plotted a startling set of data spanning 20 years.
This latest compilation of data underscores how frequent some of these larger fireballs are, with the largest being the Chelyabinsk event on February 15, 2013 which injured thousands in Russia. The new data will improve our understanding of the frequency and presence of small and large asteroids that are hazards to populated areas anywhere on Earth.
The data from “government sensors” – meaning “early warning” satellites to monitor missile launches (from potential enemies) as well as infrasound ground monitors – shows the distribution of bolide (fireball) events. The data first shows how uniformly distributed the events are around the world. This data is now released to the public and researchers for more detailed analysis.
The newest data released by the US government shows both how frequent bolides are and also how effectively the Earth’s atmosphere protects the surface. A subset of this data had been analyzed and reported by Dr. Peter Brown from the University of Western Ontario, Canada and his team in 2013 but included only 58 events. This new data set holds 556 events.
The newly released data also shows how the Earth’s atmosphere is a superior barrier that prevents small asteroids’ penetration and impact onto the Earth’s surface. Even the 20 meter (65 ft) Chelyabinsk asteroid exploded mid-air, dissipating the power of a nuclear blast 29.7 km (18.4 miles, 97,400 feet) above the surface. Otherwise, this asteroid could have obliterated much of a modern city; Chelyabinsk was also saved due to sheer luck – the asteroid entered at a shallow angle leading to its demise; more steeply, and it would have exploded much closer to the surface. While many do explode in the upper atmosphere, a broad strewn field of small fragments often occurs. In historical times, towns and villages have reported being pelted by such sprays of stones from the sky.
NASA and JPL emphasized that investment in early detection of asteroids has increased 10 fold in the last 5 years. Researchers such as Dr. Jenniskens at the SETI Institute has developed a network of all-sky cameras that have determined the orbits of over 175,000 meteors that burned up in the atmosphere. And the B612 Foundation has been the strongest advocate of discovering of all hazardous asteroids. B612, led by former astronauts Ed Lu and Rusty Schweikert has designed a space telescope called Sentinel which would find hazardous asteroids and help safeguard Earth for centuries into the future.
Speed is everything. While Chelyabinsk had just 1/10th the mass of Nimitz-class super carrier, it traveled 1000 times faster. Its kinetic energy on account of its speed was 20 to 30 times that released by the nuclear weapons used to end the war against Japan – about 320 to 480 kilotons of TNT. Briefly, asteroids are considered to be any space rock larger than 1 meter and those smaller are called meteoroids.
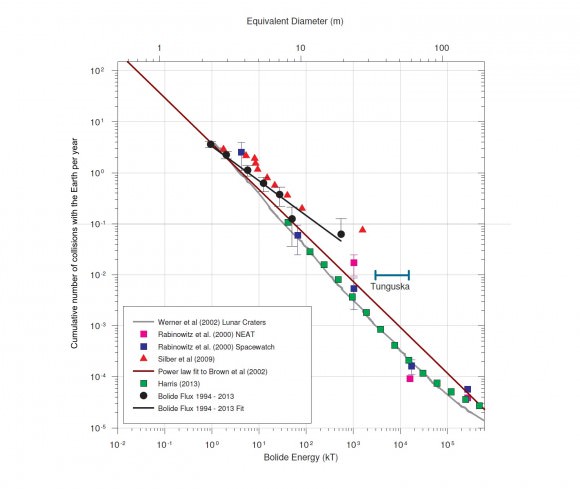
Two earlier surveys can be compared to this new data. One by Eugene Shoemaker in the 1960s and another by Dr. Brown. The initial work by Shoemaker using lunar crater counts and the more recent work of Dr. Brown’s group, utilizing sensors of the Department of Defense, determined estimates of the frequency of asteroid impacts (bolide) rates versus the size of the small bodies. Those two surveys differ by a factor of ten, that is, where Shoemaker’s shows frequencies on the order of 10s or 100s years, Brown’s is on the order of 100s and 1000s of years. The most recent data, which has adjusted Brown’s earlier work is now raising the frequency of hazardous events to that of the work of Shoemaker.
The work of Dr. Brown and co-investigators led to the following graph showing the frequency of collisions with the Earth of asteroids of various sizes. This plot from a Letter to Nature by P. Brown et al. used 58 bolides from data accumulated from 1994 to 2014 from government sensors. Brown and others will improve their analysis with this more detailed dataset. The plot shows that a Chelyabinsk type event can be expected approximately every 30 years though the uncertainty is high. The new data may reduce this uncertainty. Tungunska events which could destroy a metropolitan area the size of Washington DC occur less frequently – about once a century.
Asteroids come in all sizes. Smaller asteroids are much more common, larger ones less so. A common distribution seen in nature is represented by a bell curve or “normal” distribution. Fortunately the bigger asteroids number in the hundreds while the small “city busters” count in the 100s of thousands, if not millions. And fortunately, the Earth is small in proportion to the volume of space even just the space occupied by our Solar System. Additionally, 69% of the Earth’s surface is covered by Oceans. Humans huddle on only about 10% of the surface area of the Earth. This reduces the chances of any asteroid impact effecting a populated area by a factor of ten.
Altogether the risk from asteroids is very real as the Chelyabinsk event underscored. Since the time of Tugunska impact in Siberia in 1908, the human population has quadrupled. The number of cities of over 1 million has increased from 12 to 400. Realizing how many and how frequent these asteroid impacts occur plus the growth of the human population in the last one hundred years raises the urgency for a near-Earth asteroid discovery telescope such as B612’s Sentinel which could find all hazardous objects in less than 10 years whereas ground-based observations will take 100 years or more.
Reference:
New Map Shows Frequency of Small Asteroid Impacts, Provides Clues on Larger Asteroid Population
Full Caption of the included plot from LETTERS TO NATURE, The Chelyabinsk airburst : Implications for the Impact Hazard, P.G. Brown, et al.
The estimated cumulative flux of impactors at the Earth. The bolide impactor flux at Earth (Bolide flux 1994-2013 – black circles) based on ~20 years of global observations from US Government sensors and infrasound airwave data. Global coverage averages 80% among a total of 58 observed bolides with E > 1 kt and includes the Chelyabinsk Chelyabinsk bolide (far right black circle). This coverage correction is approximate and the bolide flux curve is likely a lower limit. The brown-coloured line represents an earlier powerlaw fit from a smaller dataset for bolides between 1 – 8 m in diameter15. Error bars represent counting statistics only. For comparison, we plot de-biased estimates of the near-Earth asteroid impact frequency based on all asteroid survey telescopic search data through mid- 2012 (green squares)8 and other earlier independently analysed telescopic datasets including NEAT discoveries (pink squares) and finally from the Spacewatch (blue squares) survey, where diameters are determined assuming an albedo of 0.1. Energy for telescopic data is computed assuming a mean bulk density of 3000 kgm-3 and average impact velocity of 20.3 kms-1. The intrinsic impact frequency for these telescopic data was found using an average probability of impact for NEAs as 2×10⁻⁹ per year for the entire population. Lunar crater counts converted to equivalent impactor flux and assuming a geometric albedo of 0.25 (grey solid line) are shown for comparison9, though we note that contamination by secondary craters and modern estimates of the NEA population which suggest lower albedos will tend to shift this curve to the right and down. Finally, we show estimated influx from global airwave measurements conducted from 1960-1974 which detected larger (5-20m) bolide impactors (upward red triangles) using an improved method for energy estimation compared to earlier interpretations of these same data.

