Chandra Observatory Checks to Make Sure Alpha Centauri is Safe, You Know, in Case We Decide to Visit

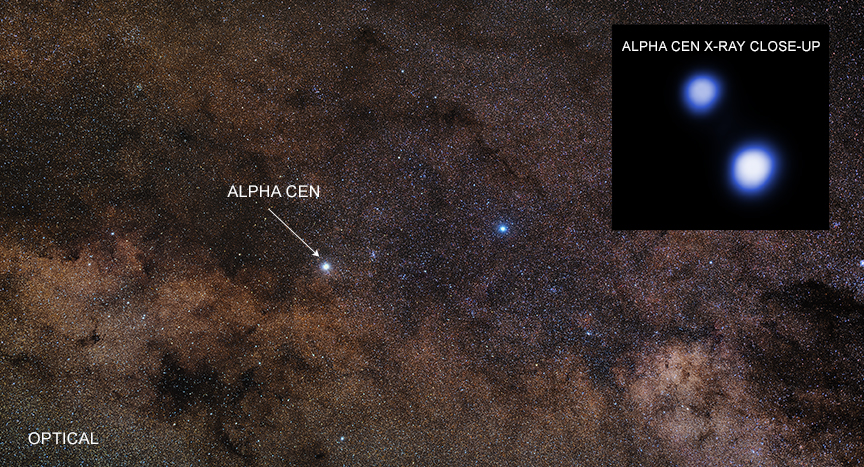
The Alpha Centauri system, shown in the optical and X-ray wavelenghts (using Chandra data). Credit: chandra.harvard.edu

At distance of just 4.367 light years, the triple star system of Alpha Centauri (Alpha Centauri A+B and Proxima Centauri) is the closest star system to our own. In 2016, researchers from the European Southern Observatory announced the discovery of Proxima b, a rocky planet located within the star’s habitable zone and the closest exoplanet to our Solar System. However, whether or not Alpha Centauri has any potentially habitable planets remains a mystery.

Between 2012 and 2015, three possible candidates were announced in this system, but follow-up studies cast doubt on their existence. Looking to resolve this mystery, Tom Ayres – a senior research associate and Fellow at the University of Colorado Boulder’s Center for Astrophysics and Space Astronomy – conducted a study of Alpha Centauri based on over a decade’s worth of observations, with encouraging results!

The results of this study were presented at the 232rd meeting of the American Astronomical Society, which took place in Denver, Colorado, from June 3rd to June 7th. The study was based on ten years worth of monitoring of Alpha Centauri, which was provided the Chandra X-ray Observatory. This data indicated that any planets that orbit Alpha Centauri A and B are not likely to be bombarded by large amounts of X-ray radiation.
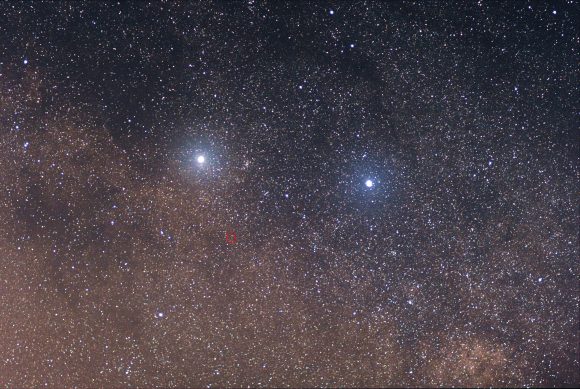
The two brightest stars of the Centaurus constellation – (left) Alpha Centauri and (right) Beta Centauri. The faint red star in the center of the red circle is Proxima Centauri. Credit: Wikipedia Commons/Skatebiker

This is good news as far as Alpha Centauri’s potential habitability goes since X-rays and related Space Weather effects are harmful to unprotected life. Not only can high doses of radiation be lethal to living creatures, they can also strip away planetary atmospheres. According to data provided by the Mars Atmosphere and Volatile EvolutioN (MAVEN) orbiter, this  is precisely what happened to Mars between 4.2 and 3.7 billion years ago.

As Tom Ayres explained in a recent Chandra press release:

“Because it is relatively close, the Alpha Centauri system is seen by many as the best candidate to explore for signs of life. The question is, will we find planets in an environment conducive to life as we know it?”

The stars in the Alpha Centauri system (A and B) are quite similar to our Sun and orbit relatively close to each other. Alpha Centauri A, a G2 V (yellow dwarf) star, is the most Sun-like of the two, being 1.1 times the mass and 1.519 times the luminosity of the Sun. Alpha Centauri B is somewhat smaller and cooler, at 0.907 times the Sun’s mass and 0.445 times its visual luminosity.

As such, the odds that the system could support an Earth-like planet are pretty good, especially around Alpha Centauri A. According to the Chandra data, the prospects for life (based on X-ray bombardment) are actually better for any planet orbiting Alpha Centauri A than for the Sun, and Alpha Centauri B is only slightly worse. This is certainly good news for those who are hoping that a potentially habitable exoplanet is found in close proximity to the Solar System.

The respective habitable zones around Alpha Centauri A and B. Credit: Planetary Habitability Laboratory

When the existence of Proxima b was first announced, there was naturally much excitement. Not only did this planet orbit within it’s star’s habitable zone, but it was the closest known exoplanet to Earth. Subsequent studies, however, revealed that Proxima Centauri is variable and unstable by nature, which makes it unlikely that Proxima b could maintain an atmosphere or life on its surface. As Ayers explained:

“This is very good news for Alpha Cen AB in terms of the ability of possible life on any of their planets to survive radiation bouts from the stars. Chandra shows us that life should have a fighting chance on planets around either of these stars.”

Meanwhile, astronomers continue to search for exoplanets around Alpha Centauri A and B, but without success. The problem with this system is the orbit of the pair, which has drawn the two bright stars close together in the sky over the past decade. To help determine if Alpha Centauri was hospitable to life, astronomers began conducting a long-term observation campaign with Chandra in 2005.

As the only X-ray observatory capable of resolving Alpha Centauri A and B during its current close orbital approach, Chandra observed these two main stars every six months for the past thirteen years. These long-term measurements captured a full cycle of increases and decreases in X-ray activity, in much the same way that the Sun has an 11-year sunspot cycle.

What these observations showed was that any planet orbiting within the habitable zone of A would receive (on average) a lower dose of X-rays compared to similar planets around the Sun. For planets orbiting withing the habitable zone of B, the X-ray dose they received would be about five times higher. Meanwhile, planets orbiting within Proxima Centauri’s habitable zone would get an average of 500 times more X-rays, and 50,000 times more during a big flare.

In addition to providing encouraging hints about Alpha Centauri’s possible habitability, the X-ray observations provided by Chandra could also go a long way towards informing astronomers about our Sun’s X-ray activity. Understanding this is key to learning more about space weather and the threat they can pose to human infrastructure, as well as other technologically-advanced civilizations.

In the meantime, astronomers continue to search for exoplanets around Alpha Centauri A and B. Knowing that they have a good chance of supporting life will certainly make any future exploration of this system (like Project Starshot) all the more lucrative!

Some of the study’s results also appeared in the January issue in the Research Notes of the American Astronomical Society, titled “Alpha Centauri Beyond the Crossroads“. And be sure to enjoy this video about Alpha Centauri’s potential habitability, courtesy of the Chandra X-ray Observatory:

Further Reading: Chandra X-ray Observatory

Breakthrough Starshot is Now Looking for the Companies to Build its Laser-Powered Solar Sails to Other Stars

Project Starshot, an initiative sponsored by the Breakthrough Foundation, is intended to be humanity's first interstellar voyage. Credit: breakthroughinitiatives.org

In 2015, Russian billionaire Yuri Milner established Breakthrough Initiatives, a non-profit organization dedicated to enhancing the search for extraterrestrial intelligence (SETI). In April of the following year, he and the organization be founded announced the creation of Breakthrough Starshot, a program to create a lightsail-driven “wafercraft” that would make the journey to the nearest star system – Proxima Centauri – within our lifetime.

In the latest development, on Wednesday May 23rd, Breakthrough Starshot held an “industry day” to outline their plans for developing the Starshot laser sail. During this event, the Starshot committee submitted a Request For Proposals (RFP) to potential bidders, outlining their specifications for the sail that will carry the wafercraft as it makes the journey to Proxima Centauri within our lifetimes.

As we have noted in several previous articles, Breakthrough Starshot calls for the creation of a gram-scale nanocraft being towed by a laser sail. This sail will be accelerated by an Earth-based laser array to a velocity of about 60,000 km/s (37,282 mps) – or 20% the speed of light (o.2 c). This concept builds upon the idea of a solar sail, a spacecraft that relies on solar wind to push itself through space.

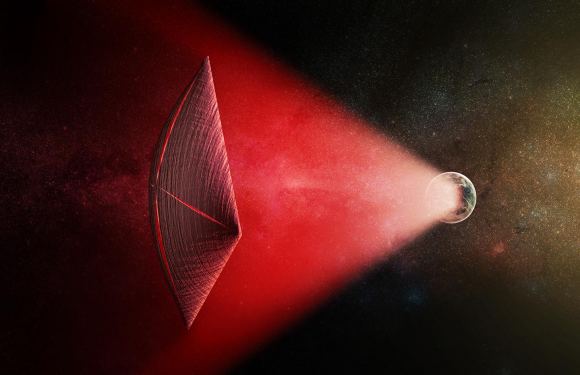
An artist’s illustration of a light-sail powered by a radio beam (red) generated on the surface of a planet. Credit: M. Weiss/CfA

At this speed, the nanocraft would be able to reach the closest star system to our own – Proxima Centauri, located 4.246 light-years away – in just 20 years time. Since its inception, the team behind Breakthrough Starshot has invested considerable time and energy addressing the conceptual and engineering challenges such a mission would entail. And with this latest briefing, they are now looking to move the project from concept to reality.

In addition to being the Frank B. Baird, Jr. Professor of Science at Harvard University, Abraham Loeb is also the Chair of the Breakthrough Starshot Advisory Committee. As he explained to Universe Today via email:

“Starshot is an initiative to send a probe to the nearest star system at a fifth of the speed of light so that it will get there within a human lifetime of a couple of decades. The goal is to obtain photos of exo-planets like Proxima b, which is in the habitable zone of the nearest star Proxima Centauri, four light years away. The technology adopted for fulfilling this challenge uses a powerful (100 Giga-watt) laser beam pushing on a lightweight (1 gram) sail to which a lightweight electronics chip is attached (with a camera, navigation and communication devices). The related technology development is currently funded at $100M by Yuri Milner through the Breakthrough Foundation.”

In addition to outlining BI’s many efforts to find ETI – which include Breakthrough Listen, Breakthrough Message and Breakthrough Watch – the RFP focused on Starshot’s Objectives. As was stated in the RFP:

“The scope of this RFP addresses the Technology Development phase – to explore LightSail concepts, materials, fabrication and measurement methods, with accompanying analysis and simulation that creates advances toward a viable path to a scalable and ultimately deployable LightSail.”

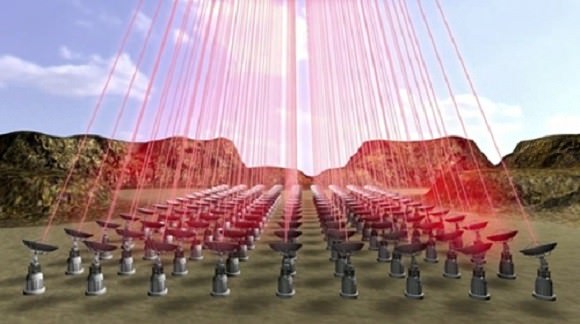
A phased laser array, perhaps in the high desert of Chile, propels sails on their journey. Credit: Breakthrough Initiatives

As Loeb indicated, this RFP comes not long after another “industry day” that was related to the development of the technology of the laser – termed the “Photon Engine”. In contrast, this particular RFP was dedicated to the design of the laser sail itself, which will carry the nanocraft to Proxima Centauri.

“The Industry Day was intended to inform potential partners about the project and request for proposals (RFP) associated with research on the sail materials and design,” added Loeb. “Within the next few years we hope to demonstrate the feasibility of the required sail and laser technologies. The project will allocate funds to experimental teams who will conduct the related research and development work. ”

The RFP also addressed Starshot’s long-term goals and its schedule for research and development in the coming years. These include the investment in $100 million over the next five years to determine the feasibility of the laser and sail, to invest the value of the European Extremely Large Telescope (EELT) from year 6 to year 11 and build a low-power prototype for space testing, and invest the value of the Large Hardon Collider (LHC) over a 20 year period to develop the final spacecraft.

“The European Extremely Large Telescope (EELT) will cost on order of a billion [dollars] and the Large Hadron Collider cost was ten times higher,’ said Loeb. “These projects were mentioned to calibrate the scale of the cost for the future phases in the Starshot project, where the second phase will involve producing a demo system and the final step will involve the complete launch system.”

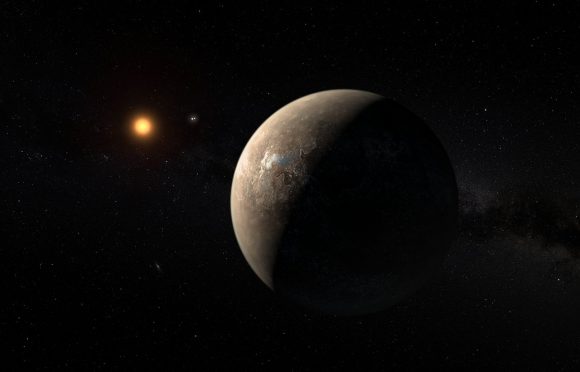
Artist’s impression of Proxima b, which was discovered using the Radial Velocity method. Credit: ESO/M. Kornmesser

The research and development schedule for the sail was also outlined, with three major phases identified over the next 5 years. Phase 1 (which was the subject of the RFP) would entail the development of concepts, models and subscale testing. Phase 2 would involve hardware validation in a laboratory setting, while Phase 3 would consist of field demonstrations.

With this latest “industry day” complete, Starshot is now open for submissions from industry partners looking to help them realize their vision. Step A proposals, which are to consist of a five-page summary, are due on June 22nd and will be assessed by Harry Atwater (the Chair of the Sail Subcommittee) as well as Kevin Parkin (head of Parkin Research), Jim Benford (muWave Sciences) and Pete Klupar (the Project Manager).

Step B proposals, which are to consist of a more detailed, fifteen-page summary, will be due on July 10th. From these, the finalists will be selected by Pete Worden, the Executive Director of Breakthrough Starshot. If all goes according to plan, the initiative hopes to launch the first lasersail-driven nanocraft in to Proxima Centauri in 30 years and see it arrive there in 50 years.

So if you’re an aerospace engineer, or someone who happens to run a private aerospace firm, be sure to get your proposals ready! To learn more about Starshot, the engineering challenges they are addressing, and their research, follow the links provided to the BI page. To see the slides and charts from the RFP, check out Starshot’s Solicitations page.

Further Reading: Centauri Dreams, Breakthrough Starshot

Astro Challenge: Spotting 4 Vesta at its Best for Decades

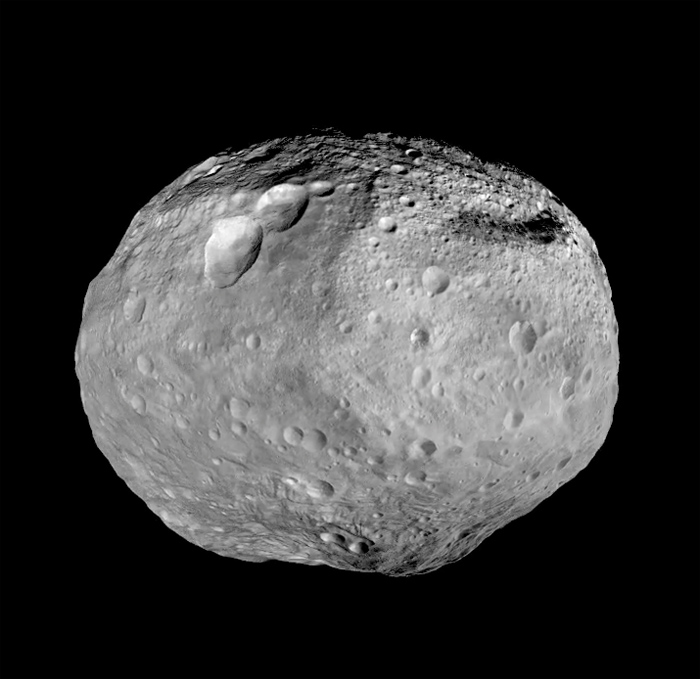
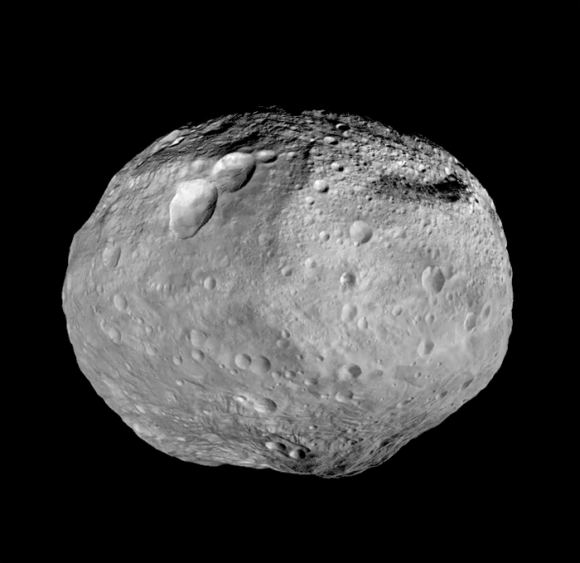
The asteroid Vesta, courtesy of NASA's Dawn spacecraft. Meteorites ejected from Vesta may have helped form Earth's water. Credit: NASA/JPL-Caltech/UCAL/MPS/DLR/IDA
Vesta
The brave new world of 4 Vesta, courtesy of NASA’s Dawn spacecraft. Credit: NASA/JPL-Caltech/UCAL/MPS/DLR/IDA

Up for a challenge? Planetary action is certainly heating up this summer: Jupiter passed opposition last month, Saturn does so in June, and Mars reaches favorable viewing next month. And with dazzling Venus in the west and Mercury to joining it starting in late June, we’ll soon have all of the naked eye classical planets in the evening sky.

Now, I want to turn your attention towards a potential naked eye object, one you’ve probably never seen: asteroid 4 Vesta.

Vesta
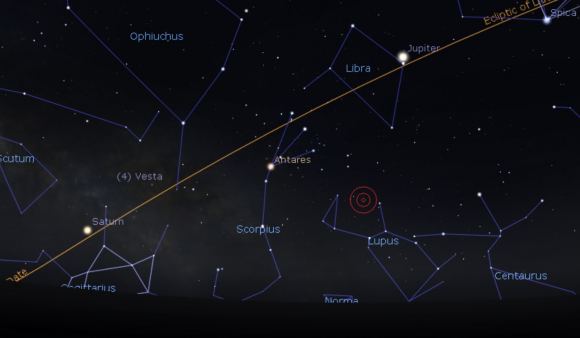
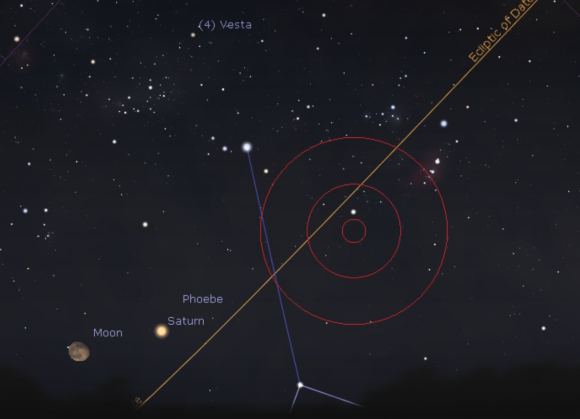
Vesta and the planet(s)… looking east in early June, about 45 minutes after sunset. Stellarium.

Vistas of Vesta

Vesta reaches opposition in 2018 on the night of June 19th. At 1.14 Astronomical Units (AU, 170.8 million kilometers) distant, this year’s opposition is slightly more favorable than any other since 1989. We won’t get another pass nearly as close until May 2036. Vesta orbits the Sun once every 3.6 years, ranging from a perihelion of 2.15 AU to an aphelion of 2.57 AU.

Although Vesta was the fourth asteroid discovered, it’s actually the brightest, and the only one visible with the naked eye—that is, if you have dark skies, and know exactly where to look for it. This summer, Vesta loiters in the star rich realm of the astronomical constellation Sagittarius, “in the weeds” for viewers up north, but high in the sky for southern viewers.

Vesta
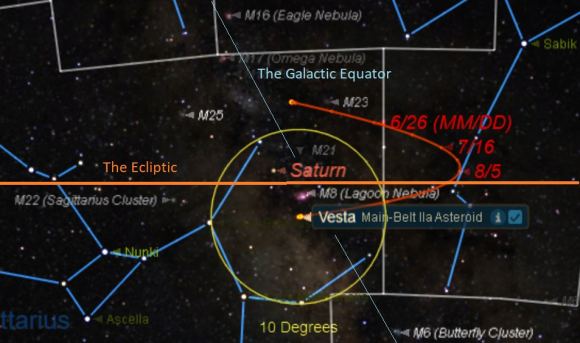
The path of 4 Vesta through mid-September. Credit: Starry Night Education software.

Early June finds Vesta about 5 degrees northwest of the +3.8 magnitude star Mu Sagittarii, threading between the deep sky objects Messier 24 and Messier 25. Vesta then loops westward through the constellation Ophiuchus the Serpent Bearer starting on July 1st, before heading back to Sagittarius on September 5th.

Vesta in 2018

Catching Vesta with the naked eye isn’t easy. You’ll need dark rural skies with a limiting magnitude down to about +5.5, and a good beforehand knowledge of the fixed stars in the region. Vesta also spends 2018 weaving around the star-dappled plane of the Milky Way galaxy, making it an especially challenging target.

Binoculars or a telescope can bring the challenge within reach of suburban and urban skies, making it a pleasure to trace the track of Vesta from night to night. Sketch the background star field and you just might tease out the presence of Vesta as it slowly moves about 30′ arcminutes per night (the diameter of a Full Moon) through June. Crank up the magnification a bit using a large (10 inches aperture or greater) light bucket telescope, and you just might see the faint hint of an oblong disk… 348 by 277 miles (560 by 446 kilometers) in size, Vesta’s apparent size is 0.7” arcseconds around opposition, 1/3 the size of Neptune at its best.

occultation vesta
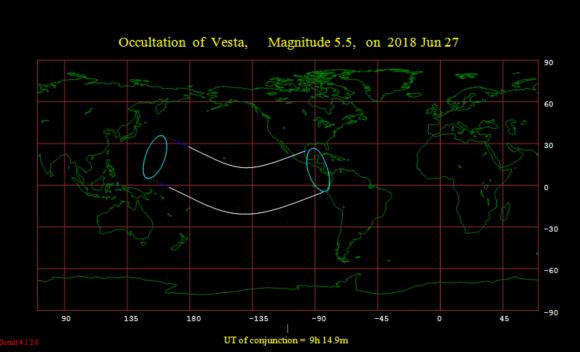
The occultation footprint for the June 27th event. Credit: Occult 4.2 software.

The 99% illuminated, waxing gibbous Moon will actually occult 4 Vesta for Hawaii, Central America and the Galapagos Islands just eight days after opposition on the night of June 27th.

ceres vesta
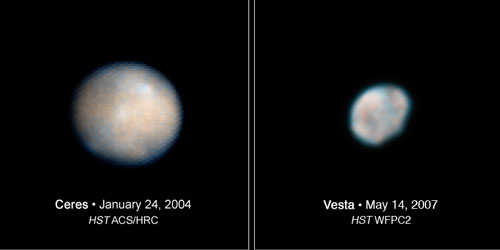
Ceres (left) and Vesta (right) imaged by the Hubble Space Telescope. Credit: NASA/HST/STl

Discovered on the night of March 29th, 1807 by prolific asteroid hunter Heinrich Olber, the Hubble Space Telescope gave us our first blurry images of 4 Vesta back in 2007. NASA’s Dawn spacecraft gave us our first good views of Vesta as a world starting in mid- 2011, orbiting the potato-shaped asteroid for just over a year before departing for 1 Ceres in late 2012.

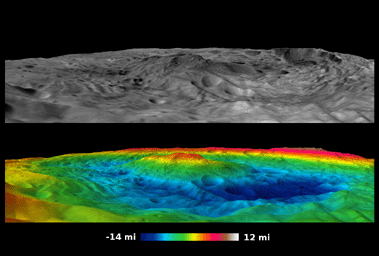
The south pole Rheasilvia impact basin. Based on images obtained by NASA’s Dawn spacecraft, the lower false color map shows the elevation scale scooped out by an ancient impact. Credit: NASA/JPL-Caltech/UCLA/MPS/DLR/IDA/PSI

Attack of the Vestoid(s)

And did you know: we actually have identified samples of Vesta to study, right here on Earth. Vesta sustained a massive impact about a billion years ago, raining debris through the inner solar system. Dawn chronicled the resulting Rheasilvia impact basin on Vesta’s south pole, and asteroids such as 1981 Midas match the spectral composition of Vesta and are collectively known as “Vestoids”.

Vesta Meteorites
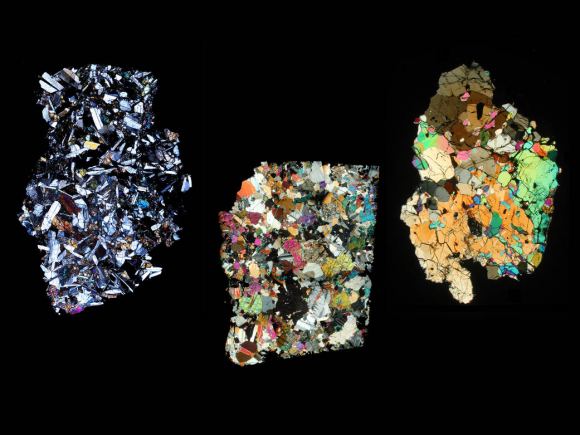
Meteorites recovered on Earth, courtesy of 4 Vesta. Credit: NASA/University of Tennessee.

On Earth, meteorites such as QUE 97053 found in Antarctica and the 1913 Moore County fall in North Carolina also match up in composition to Vesta, and make up a subgroup known as Howardite-Eucrite-Diogenite (HED) meteorites. Collectively, space rocks from this single impact on 4 Vesta contribute to an amazing 5% of all the meteorites recovered on Earth.

Fascinating thoughts to ponder, as we follow the brightest asteroid through the summer sky.

Globular Clusters Might not be as Old as Astronomers Thought. Like, Billions of Years Younger

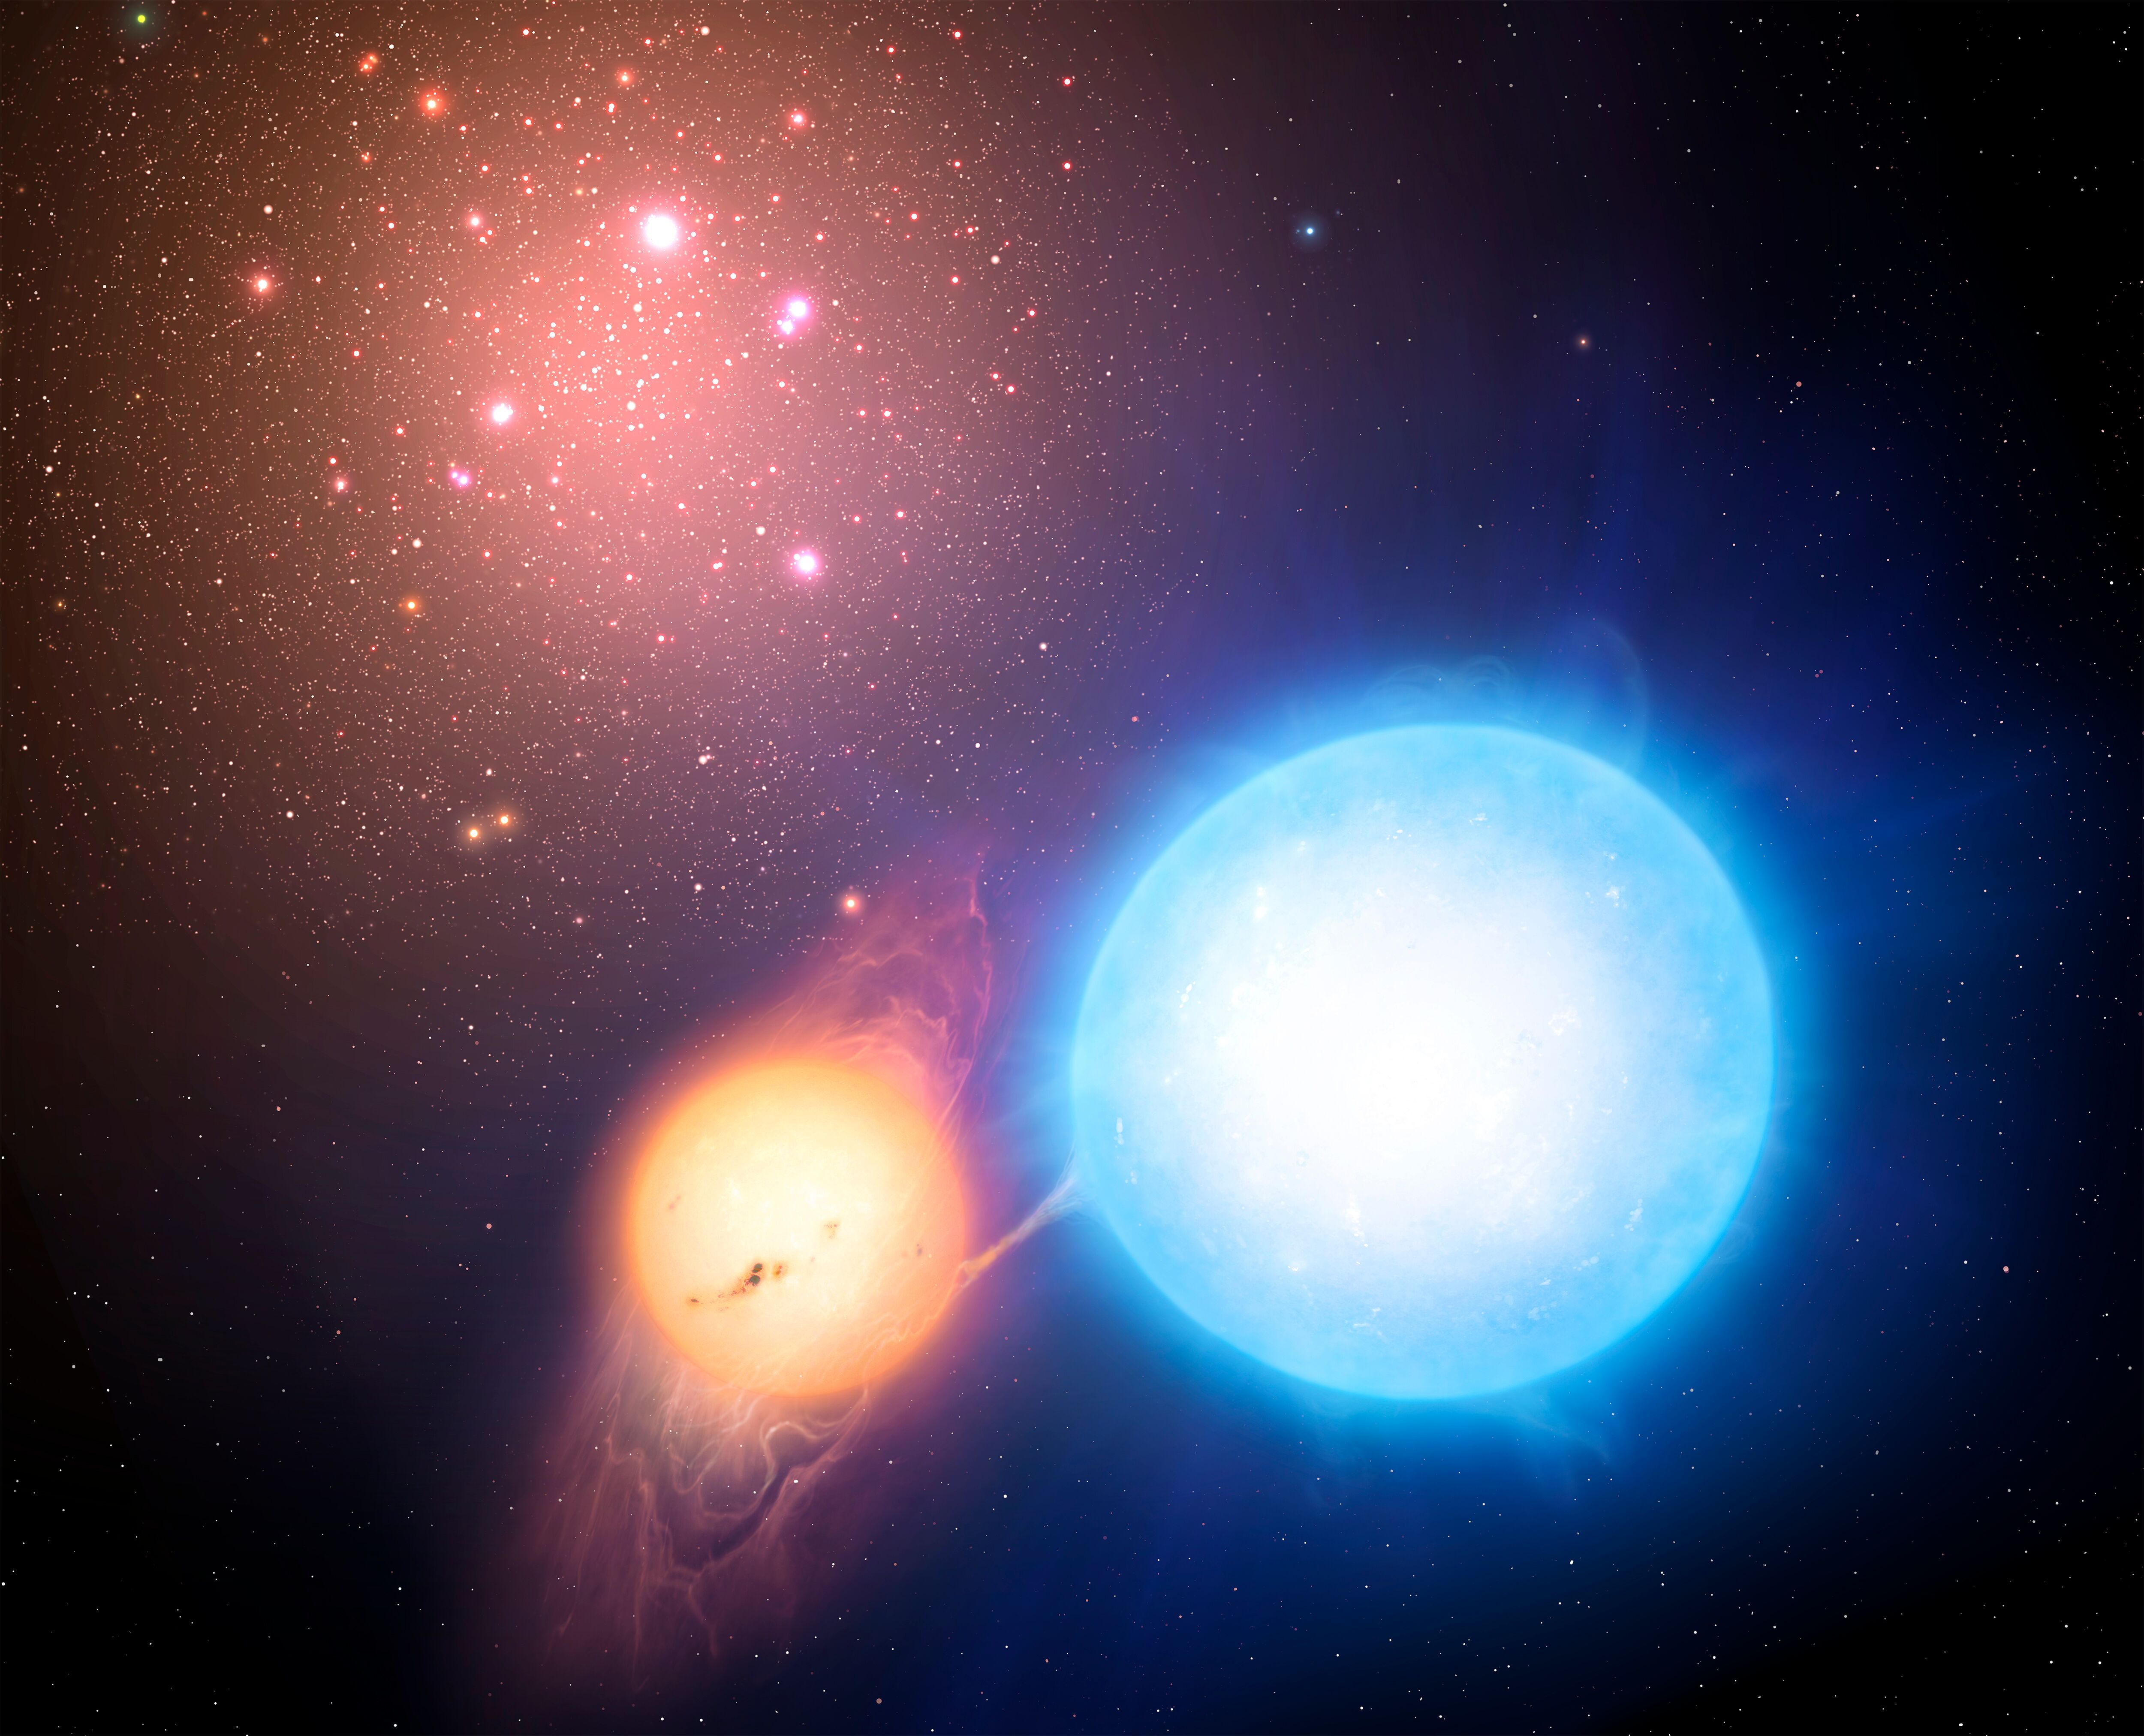
A binary star system in a globular cluster. Credit: University of Warwick

Globular clusters have been a source of fascination ever since astronomers first observed them in the 17th century. These spherical collections of stars are among the oldest known stars in the Universe, and can be found in the outer regions of most galaxies. Because of their age and the fact that almost all larger galaxies appear to have them, their role in galactic evolution has remained something of a mystery.

Previously, astronomers were of the opinion that globular clusters were some of the earliest stars to have formed in the Universe, roughly 13 billion years ago. However, new research has indicated that these clusters may actually be about 4 billion years younger, being roughly 9 billion years old. These findings may alter our understanding of how the Milky Way and other galaxies formed, and how the Universe itself came to be.

The study, titled “Reevaluating Old Stellar Populations“, recently appeared online and is being evaluated for publication in The Monthly Notices for the Royal Astronomical Society. The study was led by Dr. Elizabeth Stanway, an Associate Professor in the Astronomy group at the University of Warwick, UK, and was assisted by Dr. J.J. Eldridge, a Senior Lecturer at the University of Auckland, New Zealand.

Within larger galaxies, like the Milky Way, globular clusters are part of the galactic halo. Between 150 and 180 are estimated to be part of the Milky Way alone. Credit: ESO

For the sake of their study, Dr. Stanway and Dr. Eldridge developed a series of new research models designed to reconsider the evolution of stars. These models, known as Binary Population and Spectral Synthesis (BPASS) models, had previously proven effective in exploring the properties of young stellar populations within the Milky Way and throughout the Universe.

Using these same models, Dr. Stanway and Dr. Eldridge studied a sample of globular clusters in the Milky Way and nearby quiescent galaxies. They also took into account the details of binary star evolution within globular clusters and used them to explore the colors of light and spectra from old binary populations. In short, binary star system evolution consists of one star expanding into a giant while the gravitational force of the smaller star strips away the atmosphere of the giant.

What they found was that these binary systems were about 9 billion years old. Since these stars are thought to have formed at the same time as the globular clusters themselves, this demonstrated that globular clusters are not as old as other models have suggested. As Dr. Stanway said of the BPASS models she and Dr. Eldridge developed:

“Determining ages for stars has always depended on comparing observations to the models which encapsulate our understanding of how stars form and evolve. That understanding has changed over time, and we have been increasingly aware of the effects of stellar multiplicity – the interactions between stars and their binary and tertiary companions.

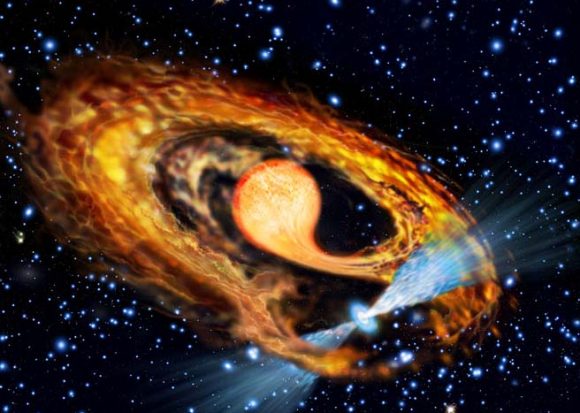
An artist’s impression of a millisecond pulsar and its companion. The presence of binaries in globular clusters is a good means of providing age estimates of those clusters. Credit: ESA & Francesco Ferraro (Bologna Astronomical Observatory)

If correct, this study could open up new pathways of research into how massive galaxies and their stars are formed. However, Dr. Stanway admits that much work still lies ahead, which includes looking at nearby star systems where individual stars can be resolved – rather than considering the integrated light of a cluster. Nevertheless, the study could have immense significant for our understanding of how and when galaxies in our Universe formed.

“If true, it changes our picture of the early stages of galaxy evolution and where the stars that have ended up in today’s massive galaxies, such as the Milky Way, may have formed,” she said. “We aim to follow up this research in the future, exploring both improvements in modelling and the observable predictions which arise from them.”

An integral part of cosmology is understanding when the Universe came to be the way it is, not just how. By determining how old globular clusters are, astronomers will have another crucial piece of the puzzle as to how and when the earliest galaxies formed. And these, combined with observations that look to the earliest epochs of the Universe, could just yield a complete model of cosmology.

Further Reading: University of Warwick, arXiv

Here’s the First Image From NOAA’s New Weather Satellite

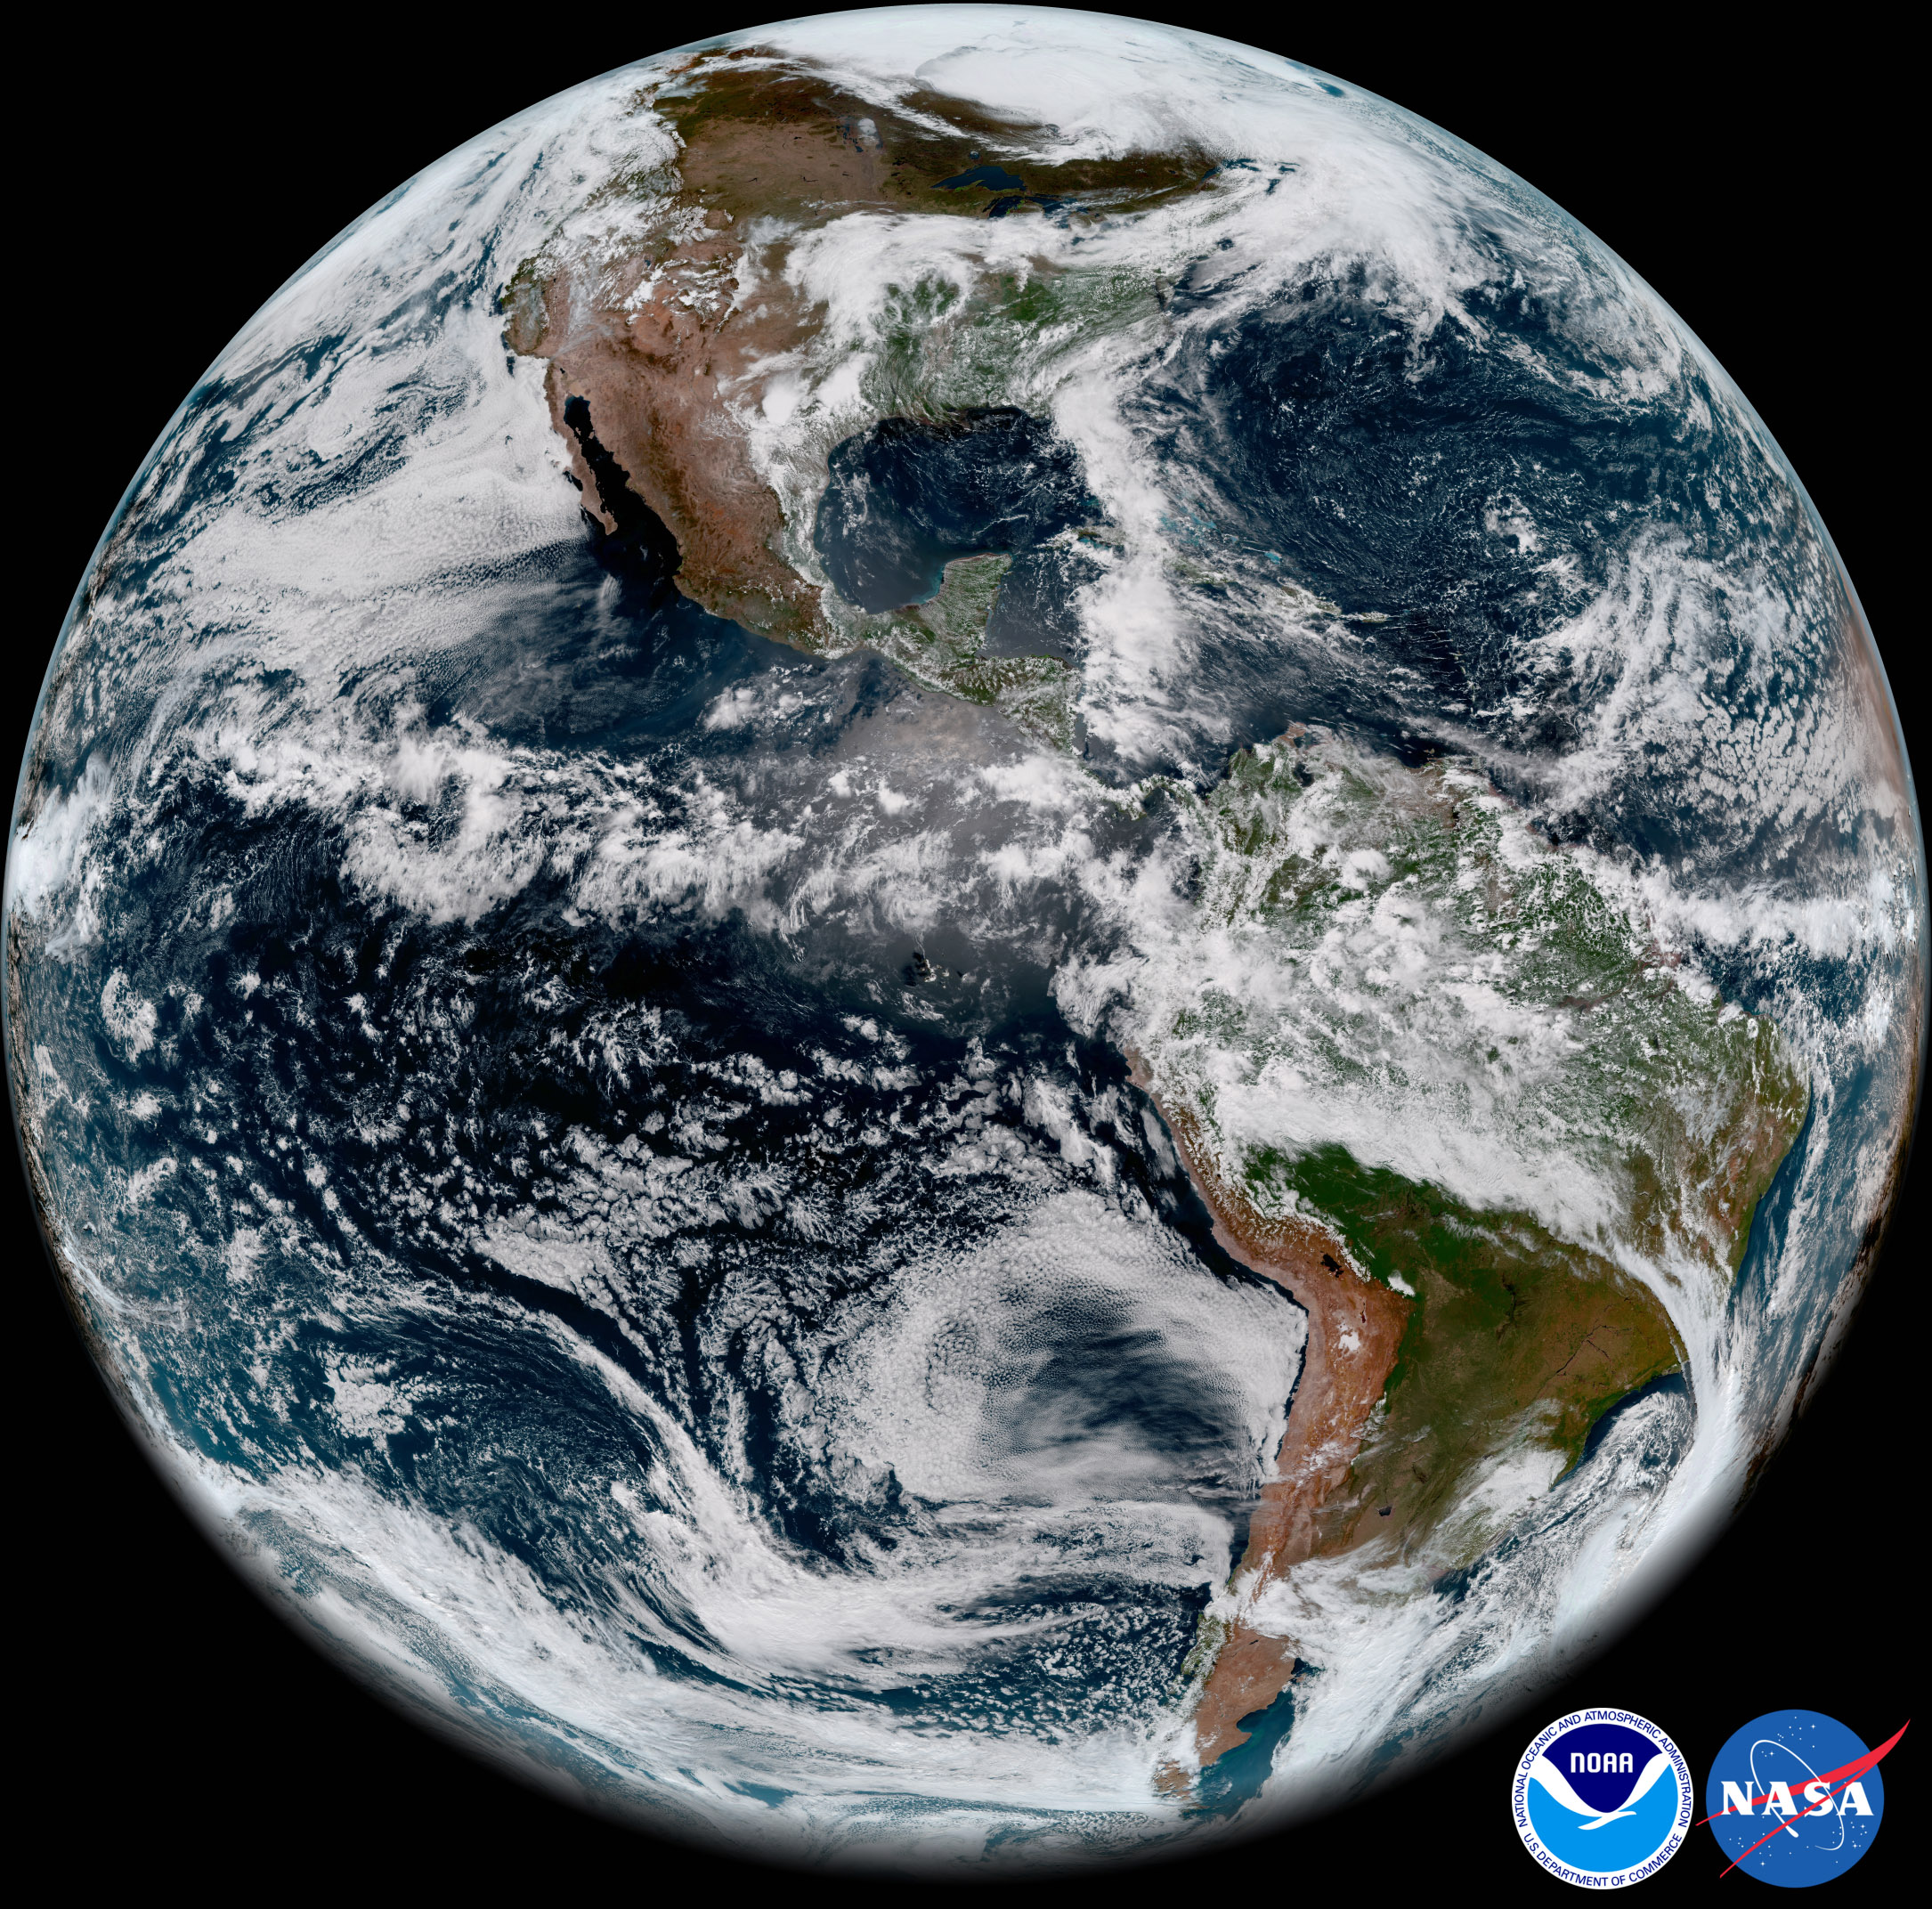
GOES-17 took this stunning, full-disk snapshot of Earth’s Western Hemisphere from its checkout position at 12:00 p.m. EDT on May 20, 2018, using the Advanced Baseline Imager (ABI) instrument. GOES-17 observes Earth from an equatorial vantage point approximately 22,300 miles above the surface. Credit: NOAA/NASA

On March 1st, 2018, the GOES-17 weather satellite launched from Cape Canaveral Air Force Station in Florida. As a second generation GOES satellite operated by the National Oceanic and Atmospheric Administration, this and other satellites will extend the Geostationary Operational Environmental Satellite system’s (GOES) weather forecasting and meteorological research until 2036.

The purpose of this new generation of satellites is to improve the forecasts of weather, oceans, the environment and space weather by providing faster and more detailed data, real-time images, and advanced monitoring. Recently, the satellite’s Advanced Baseline Imager (ABI) made its debut by releasing its “first light“, which just happened to be some beautiful and breathtaking images of Earth from space.

The image featured above was taken on May 20th, 2018, where GOES-17 captured the sunset over Earth’s Western Hemisphere. This image was taken when the satellite was at a distance of 35,405 km (22,000 miles) from Earth and was presented in “GeoColor”, which captures features of the Earth’s surface and atmosphere in vivid detail and colors that are familiar to the human eye.

Compared to previous GOES satellites, GOES-17 can collect three times more data at four times the image resolution, and scan the planet five times faster than previous probes. These abilities were put to the test as the ABI created its beautiful images of Earth using two visible bands (blue and red) and one near-infrared “vegetation” band, and one of the ABI’s “longwave” infrared bands.

When combined as a “GeoColor” image, these bands provide valuable information for monitoring dust, haze, smoke, fog, clouds and winds in the atmosphere – which allows meteorologists to monitor and forecast where severe weather events will take place. It also allows scientists to monitor vegetation patterns to see how weather conditions can lead to increased drought or the expansions of greenery.

It also results in pictures depicting Earth in vivid and colorful detail, as you can plainly see! The satellite is currently in its post-launch checkout testing phase, where controllers on Earth are busy calibrating its instruments and systems and validating them for use. The imagery acquired by the ABI is one such example, which served as a preliminary check to ensure that the imaging instrument will function properly.

Other images included the picture of a series of dynamic marine stratocumulus clouds (shown above), which was captured by the satellite’s ABI off the western coast of Chile in the the southeastern Pacific Ocean. Once again, the improved resolution and sensitivity of the GOES-17 allows it to monitor clouds in our atmosphere with amazing detail and clarity.

GOES-17 also captured a deck of low level stratus clouds covering the southern California coast (above) and smoke plumes created by wildfires in central and northern Saskatchewan, Canada (below). These two images were also acquired by the ABI on May 20th, 2018, and demonstrate how effective GOES-17 will be when it comes to monitoring weather patterns, events that can trigger fires (i.e. lighting), and the resulting fires themselves.

Alongside GOES-17, NOAA’s operational geostationary constellation also consists of GOES-16 (operating as GOES-East), GOES-15 (operating as GOES-West), and GOES-14 – operating as the on-orbit spare. This satellite constellation is currently in good working order and is monitoring weather across the US and the planet each day.

While this data is still preliminary and non-operational, it does provide a good preview of what the GOES-17 can do. In the coming years, it and its third and fourth-generation cousins – GOES-T and GOES-U – will allow Earth observers to monitor weather, climate change and natural disasters with far greater detail, allowing for better early warning and response efforts.

To see more full-resolution images from the GOES-17 ABI, go to the NOAA page.

Further Reading: NOAA

Okay, Last Year’s Kilonova Did Probably Create a Black Hole

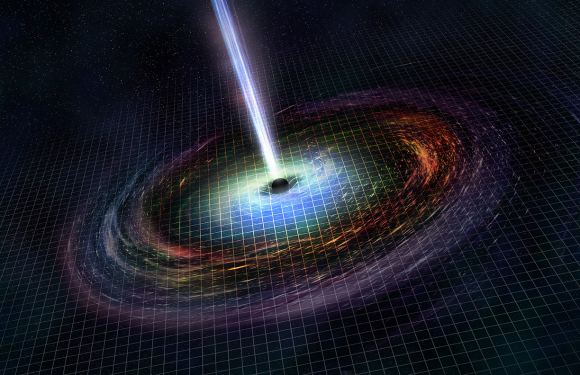
Artist's illustration of two merging neutron stars. The narrow beams represent the gamma-ray burst while the rippling spacetime grid indicates the isotropic gravitational waves that characterize the merger. Swirling clouds of material ejected from the merging stars are a possible source of the light that was seen at lower energies. Credit: National Science Foundation/LIGO/Sonoma State University/A. Simonnet

In August of 2017, another major breakthrough occurred when the Laser Interferometer Gravitational-Wave Observatory (LIGO) detected waves that were believed to be caused by a neutron star merger. Shortly thereafter, scientists at LIGO, Advanced Virgo, and the Fermi Gamma-ray Space Telescope were able to determine where in the sky this event (known as a kilonova) occurred.

This source, known as GW170817/GRB, has been the target of many follow-up surveys since it was believed that the merge could have led to the formation of a black hole. According to a new study by a team that analyzed data from NASA’s Chandra X-ray Observatory since the event, scientists can now say with greater confidence that the merger created a new black hole in our galaxy.
The study, titled “GW170817 Most Likely Made a Black Hole“, recently appeared in The Astrophysical Journal Letters. The study was led by David Pooley, an assistant professor in physics and astronomy at Trinity University, San Antonio, and included members from the University of Texas at Austin, the University of California, Berkeley, and Nazarbayev University’s Energetic Cosmos Laboratory in Kazakhstan.
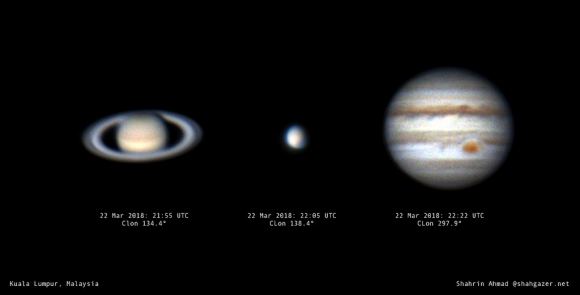
Illustration of the kilonova merger (top), and the resulting object (left and right) over time. Credit: NASA/CXC/Trinity University/D. Pooley et al. Illustration: NASA/CXC/M.Weiss

For the sake of their study, the team analyzed X-ray data from Chandra taken in the days, weeks, and months after the detection of gravitational waves by LIGO and gamma rays by NASA’s Fermi mission. While nearly every telescope in the world had observed the source, X-ray data was critical to understanding what happened after the two neutron stars collided.

While a Chandra observation two to three days after the event failed to detect an X-ray source, subsequent observations taken 9, 15, and 16 days after the event resulted in detections. The source disappeared for a time as GW170817 passed behind the Sun, but additional observations were made about 110 and 160 days after the event, both of which showed significant brightening.

While the LIGO data provided astronomers with a good estimate of the resulting object’s mass after the neutron stars merged (2.7 Solar Masses), this was not enough to determine what it had become. Essentially, this amount of mass meant that it was either the most massive neutron star ever found or the lowest-mass black hole ever found (the previous record holders being four or five Solar Masses). As Dave Pooley explained in a NASA/Chandra press release:

“While neutron stars and black holes are mysterious, we have studied many of them throughout the Universe using telescopes like Chandra. That means we have both data and theories on how we expect such objects to behave in X-rays.”

Illustration of the resulting black hole caused by GW170817. Credit: NASA/CXC/M.Weiss

If the neutron stars merged to form a heavier neutron star, then astronomers would expect it to spin rapidly and generate and very strong magnetic field. This would have also created an expanded bubble of high-energy particles that would result in bright X-ray emissions. However, the Chandra data revealed X-ray emissions that were several hundred times lower than expected from a massive, rapidly-spinning neutron star.

By comparing the Chandra observations with those by the NSF’s Karl G. Jansky Very Large Array (VLA), Pooley and his team were also able to deduce that the X-ray emission were due entirely to the shock wave caused by the merger smashing into surrounding gas. In short, there was no sign of X-rays resulting from a neutron star.

This strongly implies that the resulting object was in fact a black hole. If confirmed, these results would indicate that the formation process of a blackhole can sometimes be complicated. Essentially, GW170817 would have been the result of two stars undergoing a supernova explosion that left behind two neutron stars in a sufficiently tight orbit that they eventually came together. As Pawan Kumar explained:

“We may have answered one of the most basic questions about this dazzling event: what did it make? Astronomers have long suspected that neutron star mergers would form a black hole and produce bursts of radiation, but we lacked a strong case for it until now.”

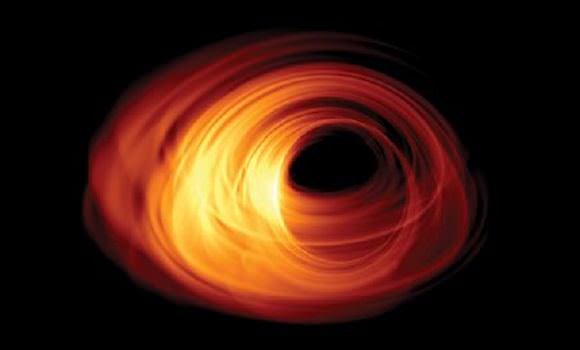
Simulated view of a black hole. Credit: Bronzwaer/Davelaar/Moscibrodzka/Falcke, Radboud University

Looking ahead, the claims put forward by Pooley and his colleagues could be tested by future X-ray and radio observations. Next-generation instruments – like the Square Kilometer Array (SKA) currently under construction in South Africa and Australia, and the ESA’s Advanced Telescope for High-ENergy Astrophysics (Athena+) – would be especially helpful in this regard.

If the remnant turns out to be a massive neutron star with a strong magnetic field after all, then the source should get much brighter in the X-ray and radio wavelengths in the coming years as the high-energy bubble catches up with the decelerating shock wave. As the shock wave weakens, astronomers expect that it will continue to become fainter than it was when recently observed.

Regardless, future observations of GW170817 are bound to provide a wealth of information, according to J. Craig Wheeler, a co-author on the study also from the University of Texas. “GW170817 is the astronomical event that keeps on giving,” he said. “We are learning so much about the astrophysics of the densest known objects from this one event.”

If these follow-up observations find that a heavy neutron star is what resulted from the merger, this discovery would challenge theories about the structure of neutron stars and how massive they can get. On the other hand, if they find that it formed a tiny black hole, then it will challenge astronomers notions about the lower mass limits of black holes. For astrophysicists, it’s basically a win-win scenario.

As co-author Bruce Grossan of the University of California at Berkeley added:

“At the beginning of my career, astronomers could only observe neutron stars and black holes in our own galaxy, and now we are observing these exotic stars across the cosmos. What an exciting time to be alive, to see instruments like LIGO and Chandra showing us so many thrilling things nature has to offer.”

Indeed, looking farther out into the cosmos and deeper back in time has revealed much about the Universe that was previously unknown. And with improved instruments being developed for the sole purpose of studying astronomical phenomena in greater detail and at even greater distances, there seems to be no limit to what we might learn. And be sure to check out this video of the GW170817 merger, courtesy of the Chandra X-ray Observatory:

Further Reading: Chandra, The Astrophysical Journal Letters

Pluto has “Sand Dunes”, but Instead of Sand, it’s Grains of Frozen Methane

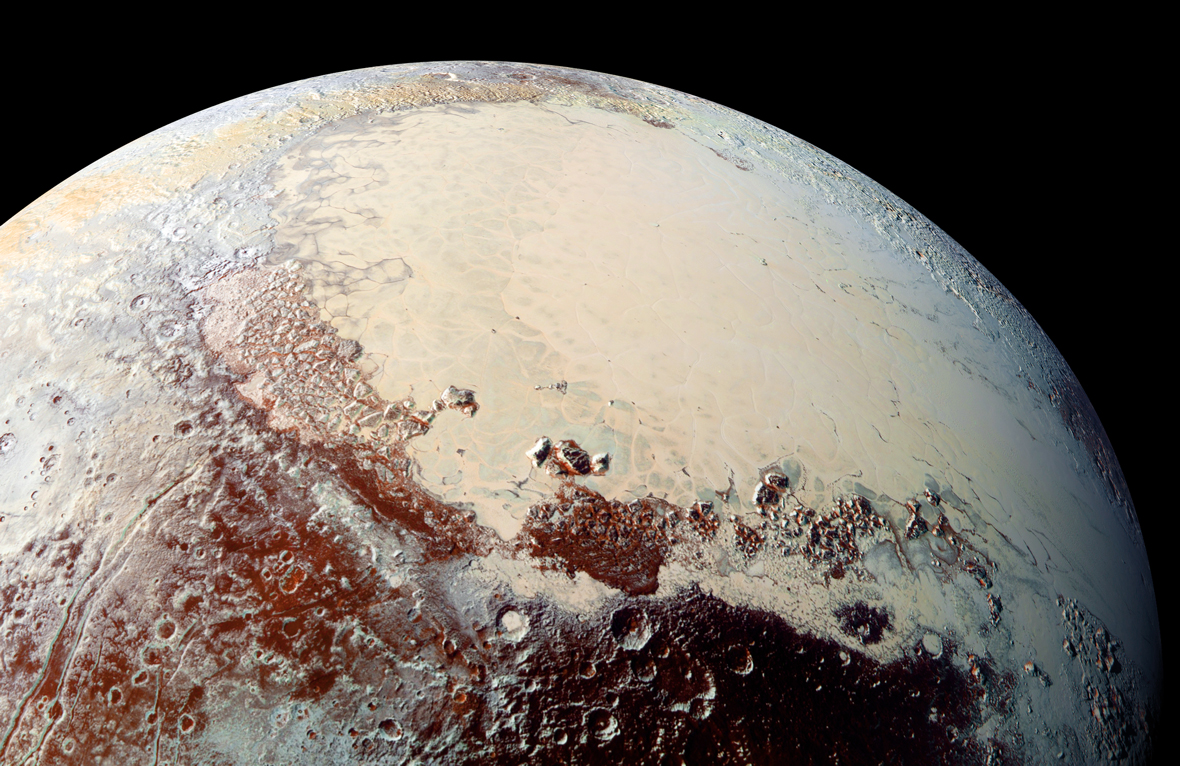
NASA's New Horizons spacecraft captured this image of Sputnik Planitia — a glacial expanse rich in nitrogen, carbon monoxide and methane ices — that forms the left lobe of a heart-shaped feature on Pluto’s surface. SwRI scientists studied the dwarf planet’s nitrogen and carbon monoxide composition to develop a new theory for its formation. Credit: NASA/Johns Hopkins University Applied Physics Laboratory/Southwest Research Institute

In July of 2015, the New Horizons mission made history when it conducted the first flyby in history of Pluto. In the course of conducting its flyby, the probe gathered volumes of data about Pluto’s surface, composition, atmosphere and system of moons. It also provided breathtaking images of Pluto’s “heart”, its frozen plains, mountain chains, and it’s mysterious “bladed terrain”.
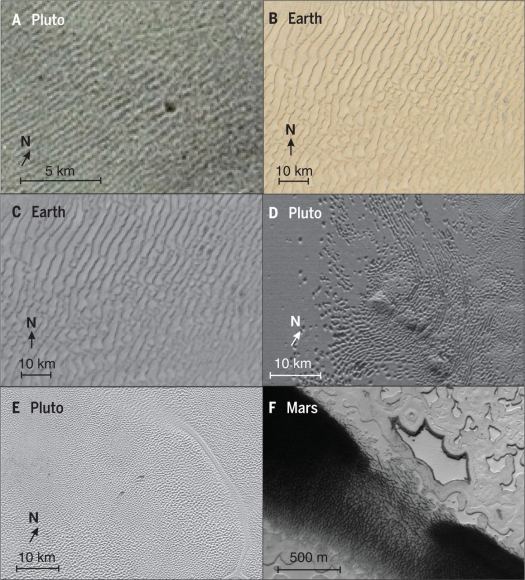
These strange features showed people for the first time how radically different the surface of Pluto is from Earth and the other planets of the inner Solar System. But strangely, they also showcased how this distant world is also quite similar to Earth. For instance, in a new study, a team of researchers working on the images from the New Horizons mission noticed “dunes” on the surface of Pluto that resemble sand dunes here on Earth.

The study, titled “Dunes on Pluto“, was recently published in the journal Science. The study was led by Matthew Telfer, a Lecturer in Physical Geography from the University of Plymouth, with significant contributions provided by Eric J. R. Parteli and Jani Radebaugh – geoscientists from the University of Cologne, and Brigham Young University, respectively.

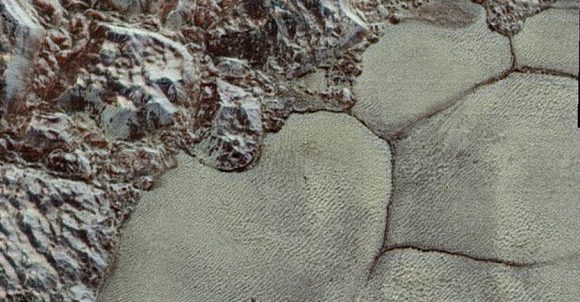
The fine smudges on Sputnik Planum have been identified as transverse dunes because of the way they run perpendicular to the dark “wind streaks”. Credit: NASA/JPL/New Horizons

They were joined by members from the Carl Sagan Center at the SETI Institute, NASA’s Ames Research Center, the Lowell Observatory, the Southwest Research Institute (SwRI), the National Optical Astronomy Observatory, the Massachusetts Institute of Technology (MIT), the Johns Hopkins University Applied Physics Laboratory (JHUAPL), and multiple universities.
On Earth, dunes are formed by wind-blown sand that create repeated ridges in the desert or along beaches. Similar patterns have been observed along river beds and alluvial plains, where water deposits sediment over time. In all cases, dune-like formations are the result of solid particles being transported by a moving medium (i.e. air or water). Beyond Earth, such patterns have been observed on Mars, Titan, and even on Comet 67P/Churyumov-Gerasimenko.

However, when consulting images from New Horizons probe, Telfer and his colleagues noted similar formations in the Sputnik Planitia region on Pluto. This region, which constitutes the western lobe of the heart-shaped Tombaugh Regio, is essentially a massive ice-covered basin. Already, researchers have noted that the surface appears to consist of irregular polygons bordered by troughs, which appear to be indications of convection cells.

As Dr. Telfer told Universe Today via email:

“We first saw some features looked kind of dune-like within the first few days, but as time passed, and new images came in, most of these seemed less and less convincing. But one area became more and more convincing with every pass. This is what we’re reporting on.”

Another interesting feature is the dark streams that are a few kilometers long and are all aligned in the same direction. But equally interesting were the features that Telfer and his team noticed, which looked like dunes that ran perpendicular to the wind streaks. This indicated that they were transverse dunes, the kinds that pile up due to prolonged wind activity in the desert.

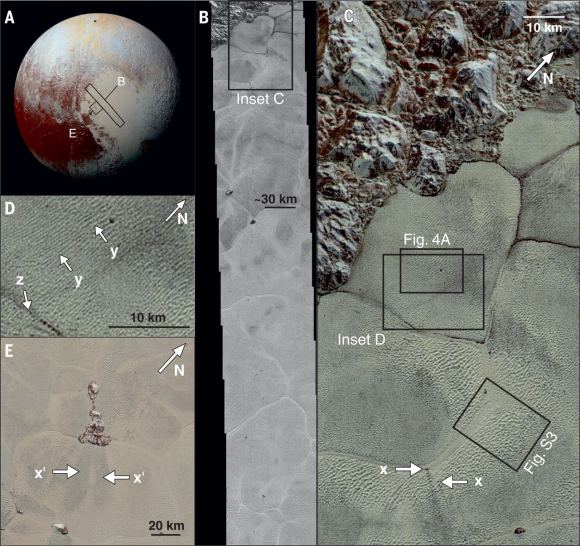
New Horizon images showing the patterns on Pluto’s surface that were hypothesized to be dunes. Credit: NASA/JPL/University of Arizona

To determine if this was a plausible hypothesis, the researchers constructed models that took into account what kind of particles would make up these dunes. They concluded that either methane or nitrogen ice would be able to form sand-sized grains that could be transported by typical winds. They then modeled the physics of Pluto’s winds, which would be strongest coming down the slopes of the mountains that border Sputnik Planum.

However, they also determined that Pluto’s winds would not be strong enough to push the particles around on their own. This is where sublimation played a key role, where surface ice goes from a solid phase directly to a gas when warmed by sunlight. This sublimation would provide the upward force necessary to lift the particles, at which point they would be caught by Pluto’s winds and blown around.

As Dr. Telfer explained, this conclusion was made possible thanks to the immense amount of support his team got, much of which came from the New Horizons Geology, Geophysics and Imaging Science Theme Team:

“Once we’d done the spatial analysis that made us really sure that these features made sense as dunes, we had the great opportunity to hook up with Eric Parteli at Cologne; he showed us through his modelling that the dunes should form, as long as the grains become airborne in the first place. The NASA New Horizons team really helped here, as they pointed out that mixed nitrogen/methane ices would preferentially fling methane ice grains upwards as the ices sublimated.”

Comparison of dune features on Pluto with those on Earth and Mars. Credit: NASA/JPL/University of Arizona

In addition to showing that Pluto, one of the most distant objects in the Solar System, has a few things in common with Earth, this study has also shown just how active Pluto’s surface is. “It shows us that not only is Pluto’s surface affecting its atmosphere, the converse is also true,” said Dr. Telfer. “We have a really dynamic world’s surface, so far out in the solar system.

On top of that, understanding how dunes can form under Pluto’s conditions will help scientists to interpret similar features found elsewhere in the Solar System. For example, NASA is planning on sending a mission to Titan in the coming decade to study its many interesting surface features, which include its dune formations. And many more missions are being sent to explore the Red Planet before a crewed mission takes place in the 2030s.

Knowing how such formations were created are key to understanding the dynamics of the planet, which will help answer some of the deeper questions about what is taking place on the surface.

Further Reading: ArsTechnica, Science

What are the Chances that the Next Generation LSST Could Find New Planets in the Solar System?

Artist's concept of the hypothetical "Planet Nine." Could it have moons? Credit: NASA/JPL-Caltech/Robert Hurt

In the past few decades, thanks to improvements in ground-based and space-based observatories, astronomers have discovered thousands of planets orbiting neighboring and distant stars (aka. extrasolar planets). Strangely enough, it is these same improvements, and during the same time period, that enabled the discovery of more astronomical bodies within the Solar System.

These include the “minor planets” of Eris, Sedna, Haumea, Makemake, and others, but also the hypothesized planetary-mass objects collectively known as Planet 9 (or Planet X). In a new study led by Northern Arizona University and the Lowell Observatory, a team of researchers hypothesize that the Large Synoptic Survey Telescope (LSST) – a next-generation telescope that will go online in 2022 – has a good chance of finding this mysterious planet.

Their study, titled “On the detectability of Planet X with LSST“, recently appeared online. The study was led by David E. Trilling, an astrophysicist from the Northern Arizona University and the Lowell Observatory, and included Eric C. Bellm from the University of Washington and Renu Malhotra of the Lunar and Planetary Laboratory at The University of Arizona.

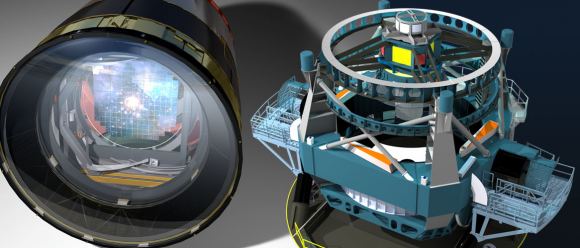
Artist’s impression of the Large Synoptic Survey Telescope (LSST). Credit: lsst.org

Located on the Cerro Pachón ridge in north-central Chile, the 8.4-meter LSST will conduct a 10-year survey of the sky that will deliver 200 petabytes worth of images and data that will address some of the most pressing questions about the structure and evolution of the Universe and the objects in it. In addition to surveying the early Universe in order to understand the nature of dark matter and dark energy, it will also conduct surveys of the remote areas of the Solar System.

Planet 9/X is one such object. In recent years, the existence of two planetary-mass bodies have been hypothesized to explain the orbital distribution of distant Kuiper Belt Objects. While neither planet is thought to be exceptionally faint, the sky locations of these planets are poorly constrained – making them difficult to pinpoint. As such, a wide area survey is needed to detect these possible planets.

In 2022, the LSST will carry out an unbiased, large and deep survey of the southern sky, which makes it an important tool when it comes to the search of these hypothesized planets. As they state in their study:

“The possibility of undiscovered planets in the solar system has long fascinated astronomers and the public alike. Recent studies of the orbital properties of very distant Kuiper belt objects (KBOs) have identified several anomalies that may be due to the gravitational influence of one or more undiscovered planetary mass objects orbiting the Sun at distances comparable to the distant KBOs.

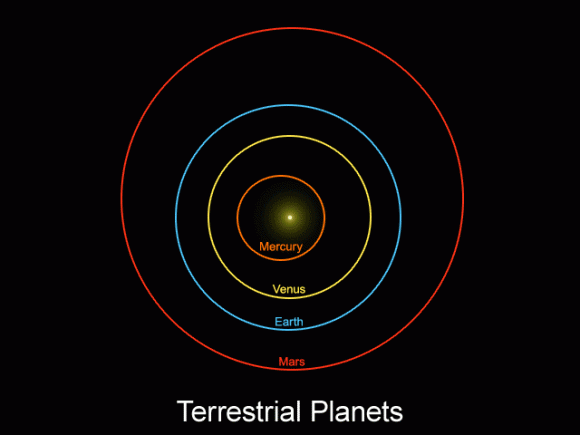
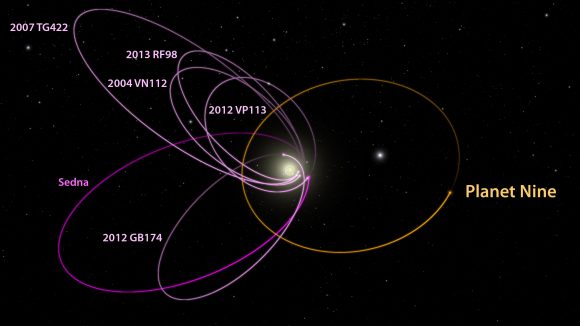
Animated diagram showing the spacing of the Solar Systems planet’s, the unusually closely spaced orbits of six of the most distant KBOs, and the possible “Planet 9” (aka. “Planet X”). Credit: Caltech/nagualdesign

These studies include Trujillo & Sheppard’s 2014 study where they noticed similarities in the orbits of distant Trans-Neptunian Objects (TNOs) and postulated that a massive object was likely influencing them. This was followed by a 2016 study by Sheppard & Trujillo where they suggested that the high perihelion objects Sedna and 2012 VP113 were being influence by an unknown massive planet.

This was followed in 2016 by Konstantin Batygin and Michael E. Brown of Caltech suggesting that an undiscovered planet was the culprit. Finally, Malhotra et al. (2016) noted that the most distant KBOs have near-integer period ratios, which was suggestive of a dynamical resonance with a massive object in the outer Solar System. Between these studies, various mass and distance estimates were formed that became the basis of the search for this planet.

Overall, these estimates indicated that Planet 9/X was a super-Earth with anywhere between 5 to 20 Earth masses, and orbited the Sun at a distance of between 150 – 600 AU. Concurrently, these studies have also attempted to narrow down where this Super-Earth’s orbit will take it throughout the outer Solar System, as evidenced by the perturbations it has on KBOs.

Unfortunately, the predicted locations and brightness of the object are not yet sufficiently constrained for astronomers to simply look in the right place at the right time and pick it out. In this respect, a large area sky survey must be carried out using moderately large telescopes with a very wide field of view. As Dr. Trilling told Universe Today via email:

“The predicted Planet X candidates are not particularly faint, but the possible locations on the sky are not very well constrained at all. Therefore, what you really need to find Planet X is a medium-depth telescope that covers a huge amount of sky. This is exactly LSST. LSST’s sensitivity will be sufficient to find Planet X in almost all its (their) predicted configurations, and LSST will cover around half of the known sky to this depth. Furthermore, the cadence is well-matched to finding moving objects, and the data processing systems are very advanced. If you were going to design a tool to find Planet X, LSST is what you would design.”
The orbits of several KBOs provide indications about the possible existence of Planet 9. Credit: Caltech/R. Hurt (IPAC)

However, the team also acknowledges that within certain parameters, Planet 9/X may not be detectable by the LSST. For example, it is possible that that there is a very narrow slice of predicted Planet 9/X parameters where it might be slightly too faint to be easily detected in LSST data. In addition, there is also a small possibility that irregularities in the Planet 9/X cadence might lead to it being missed.

There is the even the unlikely ways in which Planet 9/X could go undetected in LSST data, which would come down to a simple case of bad luck. However, as Dr. Trilling indicated, the team is prepared for these possibilities and is hopeful they will find Planet 9/X, assuming there’s anything to find:
“The more likely conclusion if planet X is not detected in LSST data is that planet X doesn’t exist – or at least not the kind of planet X that has been predicted. In this case, we’ve got to work harder to understand how the Universe created this pattern of orbits in the outer Solar System that I described above. This is a really fun part of science: make a prediction and test it, and find that the result is rarely what is predicted. So now we’ve got to work harder to understand the universe. Hopefully this new understanding makes new predictions that we then can test, and we repeat the cycle.”
The existence of Planet 9/X has been one of the more burning questions for astronomers in recent years. If its existence can be confirmed, astronomers may finally have a complete picture of the Solar System and its dynamics. If it’s existence can be ruled out, this will raise a whole new series of questions about what is going on in the Outer Solar System!

Further Reading: arXiv

This is What Happens When a Black Hole Gobbles up a Star

Close-up of star near a supermassive black hole (artist’s impression). Credit: ESA/Hubble, ESO, M. Kornmesser

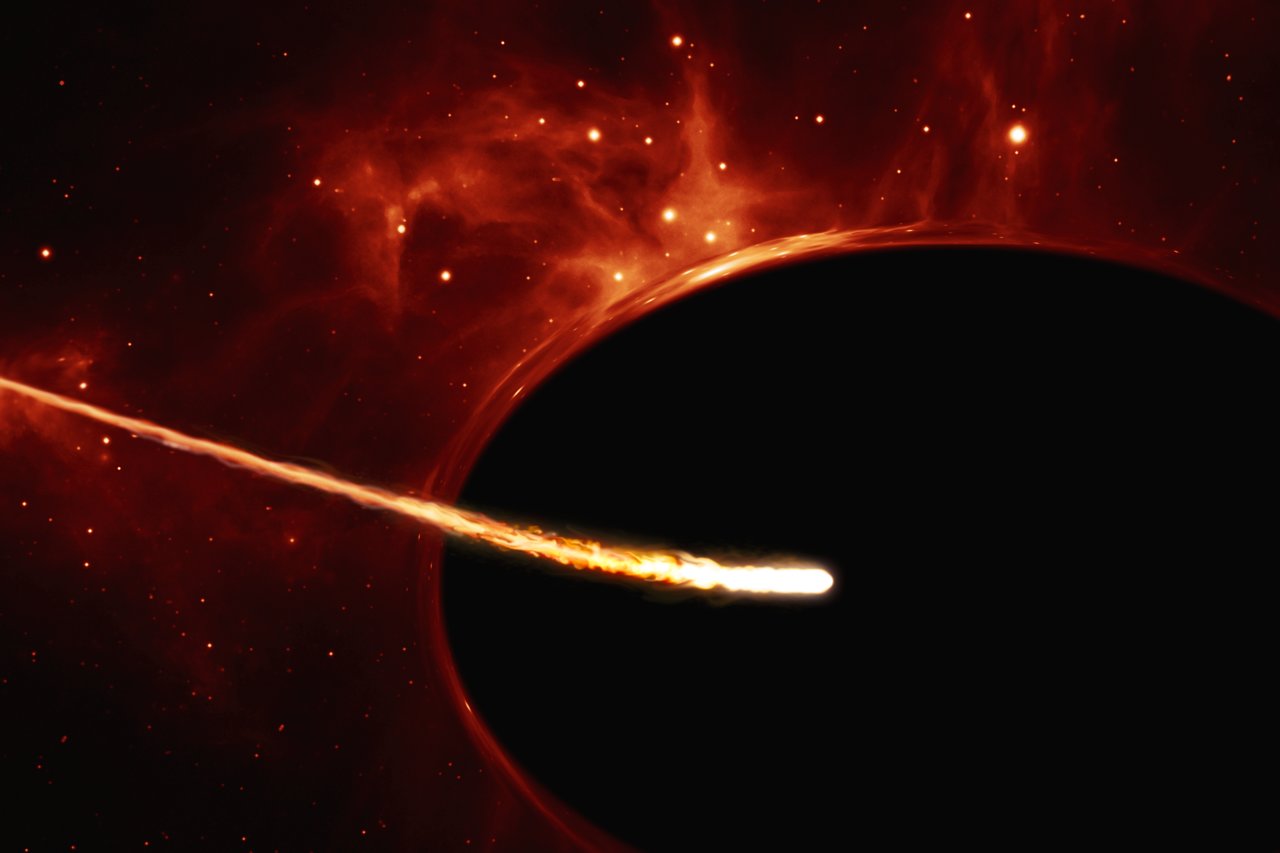
At the center of our galaxy resides a Supermassive Black Hole (SMBH) known as Sagittarius A. Based on ongoing observations, astronomers have determined that this SMBH measures 44 million km (27.34 million mi) in diameter and has an estimated mass of 4.31 million Solar Masses. On occasion, a star will wander too close to Sag A and be torn apart in a violent process known as a tidal disruption event (TDE).

These events cause the release of bright flares of radiation, which let astronomers know that a star has been consumed. Unfortunately, for decades, astronomers have been unable to distinguish these events from other galactic phenomena. But thanks to a new study from by an international team of astrophysicists, astronomers now have a unified model that explains recent observations of these extreme events.

The study – which recently appeared in the Astrophysical Journal Letters under the title “A Unified Model for Tidal Disruption Events” – was led by Dr. Jane Lixin Dai, a physicist with the Niels Bohr Institute’s Dark Cosmology Center. She was joined by members from University of Maryland’s Joint Space-Science Institute and the University of California Santa Cruz (UCSC).

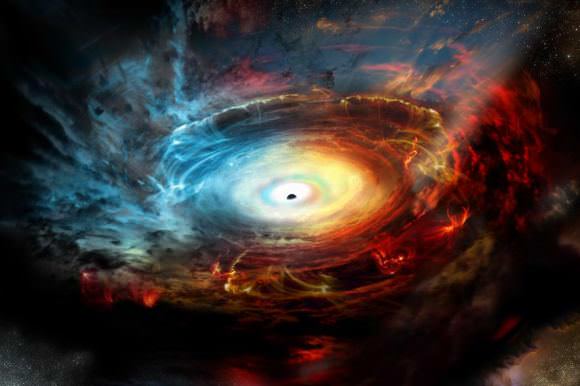
Illustration of the supermassive black hole at the center of the Milky Way. Credit: NRAO/AUI/NSF

As Enrico Ramirez-Ruiz – the professor and chair of astronomy and astrophysics at UC Santa Cruz, the Niels Bohr Professor at the University of Copenhagen, and a co-author on the paper – explained in a UCSC press release:

“Only in the last decade or so have we been able to distinguish TDEs from other galactic phenomena, and the new model will provide us with the basic framework for understanding these rare events.”

In most galaxies, SMBHs do not actively consume any material and therefore do not emit any light, which distinguishes them from galaxies that have Active Galactic Nuclei (AGNs). Tidal disruption events are therefore rare, occurring only once about every 10,000 years in a typical galaxy. However, when a star does get torn apart, it results in the release of an intense amount of radiation. As Dr. Dai explained:

“It is interesting to see how materials get their way into the black hole under such extreme conditions. As the black hole is eating the stellar gas, a vast amount of radiation is emitted. The radiation is what we can observe, and using it we can understand the physics and calculate the black hole properties. This makes it extremely interesting to go hunting for tidal disruption events.”

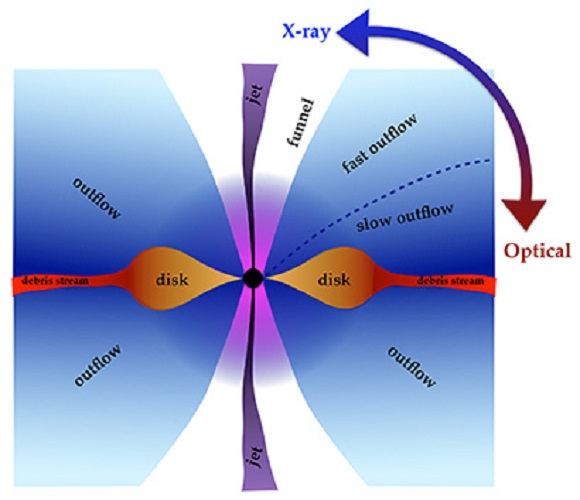
Illustration of emissions from a tidal disruption event shows in cross section what happens when the material from a disrupted star is devoured by a black hole. Credit: Jane Lixin Dai

In the past few years, a few dozen candidates for tidal disruption events (TDEs) have been detected using wide-field optical and UV transient surveys as well as X-ray telescopes. While the physics are expected to be the same for all TDEs, astronomers have noted that a few distinct classes of TDEs appear to exist. While some emit mostly x-rays, others emit mostly visible and ultraviolet light.

As a result, theorists have struggled to understand the diverse properties observed and create a coherent model that can explain them all. For the sake of their model, Dr. Dai and her colleagues combined elements from general relativity, magnetic fields, radiation, and gas hydrodynamics. The team also relied on state-of-the-art computational tools and some recently-acquired large computer clusters funded by the Villum Foundation for Jens Hjorth (head of DARK Cosmology Center), the U.S. National Science Foundation and NASA.

Using the model that resulted, the team concluded that it is the viewing angle of the observer that accounts for the differences in observation.  Essentially, different galaxies are oriented randomly with respect to observers on Earth, who see different aspects of TDEs depending on their orientation. As Ramirez-Ruiz explained:

“It is like there is a veil that covers part of a beast. From some angles we see an exposed beast, but from other angles we see a covered beast. The beast is the same, but our perceptions are different.”

Artist’s impression of the Large Synoptic Survey Telescope. Credit: lsst.org

In the coming years, a number of planned survey projects are expected to provide much more data on TDEs, which will help expand the field of research into this phenomena. These include the Young Supernova Experiment (YSE) transient survey, which will be led by the DARK Cosmology Center at the Niels Bohr Institute and UC Santa Cruz, and the Large Synoptic Survey Telescopes (LSST) being built in Chile.

According to Dr. Dai, this new model shows what astronomers can expect to see when viewing TDEs from different angles and will allow them to fit different events into a coherent framework. “We will observe hundreds to thousands of tidal disruption events in a few years,” she said. “This will give us a lot of ‘laboratories’ to test our model and use it to understand more about black holes.”

This improved understanding of how black holes occasionally consume stars will also provide additional tests for general relativity, gravitational wave research, and help astronomers to learn more about the evolution of galaxies.

Further Reading: UCSC, Astrophysical Journal Letters

Planets on Parade: Saturn at Opposition 2018

2018 planets
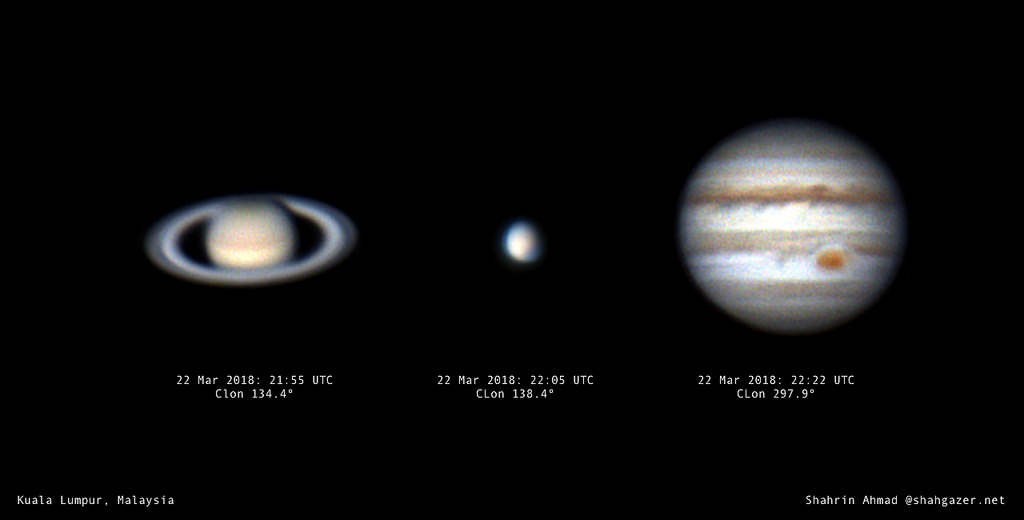
Saturn, Mars and Jupiter all beckon this summer. Image credit and copyright: Sharin Ahmad (@shahgazer)
2018 planets
Saturn, Mars and Jupiter all beckon this summer. Image credit and copyright: Sharin Ahmad (@shahgazer).

We’re in the midst of a parade of planets crossing the evening sky. Jupiter reached opposition on May 9th, and sits high to the east at dusk. Mars heads towards a fine opposition on July 27th, nearly as favorable as the historic opposition of 2003. And Venus rules the dusk sky in the west after the setting Sun for most of 2018.

June is Saturn’s turn, as the planet reaches opposition this year on June 27th, rising opposite to the setting Sun at dusk.

In classical times, right up until just over two short centuries ago, Saturn represented the very outer limit of the solar system, the border lands where the realm of the planets came to an end. Sir William Herschel extended this view, when he spied Uranus—the first planet discovered in the telescopic era—slowly moving through the constellation Gemini just across the border of Taurus the Bull using a 7-foot reflector (in the olden days, telescopes specs were often quoted referring to their focal length versus aperture) while observing from his backyard garden in Bath, England on the night of March 13th, 1781.

vesta
Looking east tonight at sunset… note Vesta to the upper left. Credit: Stellarium.

Orbiting the Sun once every 29.5 years, Saturn is the slowest moving of the naked eye planets, fitting for a planet named after Father Time. Saturn slowly loops from one astronomical constellation along the zodiac to the next eastward, moving through one about every two years.

path of saturn
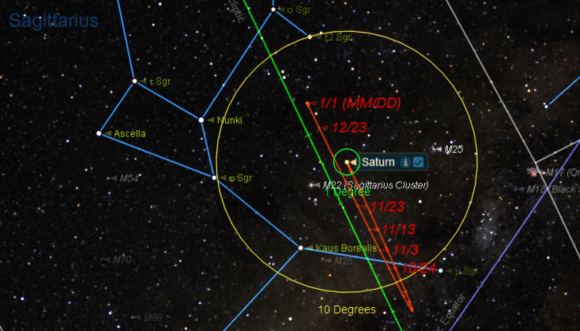
The path of Saturn through 2018. Image credit: Starry Night Education software.

2018 sees Saturn in the constellation Sagittarius the Archer, just above the ‘lid’ of the Teapot asterism, favoring the southern hemisphere for this apparition. Saturn won’t cross the celestial equator northward again until 2026. Not that that should discourage northern hemisphere viewers from going after this most glorious of planets. A low southerly declination also means that Saturn is also up in the evening in the summertime up north, a conducive time for observing. Taking 29-30 years to complete one lap around the ecliptic as seen from our Earthly vantage point, Saturn also makes a great timekeeper with respect to personal life milestones… where were you back in 1989, when Saturn occupied the same spot along the ecliptic?

Saturn also shows the least variation of all the planets in terms of brightness and size, owing to its immense distance 9.5 AU from the Sun, and consequently 8.5 to 10.5 AU from the Earth. Saturn actually just passed its most distant aphelion since 1959 on April 17th, 2018 at 10.066 AU from the Sun.

Saturn’s in 2018 Dates with Destiny

Saturn sits just 1.6 degrees south of the waning gibbous Moon tonight. The Moon will lap it again one lunation later on June 28th. Note that the brightest of the asteroids, +5.7 magnitude 4 Vesta is nearby in northern Sagittarius, also reaching opposition on June 19th. Can you spy Vesta with the naked eye from a dark sky site? 4 Vesta passes just 4 degrees from Saturn on September 23rd, and both flirt with the galactic plane and some famous deep sky targets, including the Trifid and Lagoon Nebulae.

Saturn reaches quadrature 90 degrees east of the Sun on September 25th, then ends its evening apparition when it reaches solar conjunction on New Year’s Day, 2019.

Saturn is well clear of the Moon’s path for most of this year, but stick around: starting on December 9th, 2018, the slow-moving planet will make a great target for the Moon, which will begin occulting it for every lunation through the end of 2019.

It’s ironic: Saturn mostly hides its beauty to unaided eye. Presenting a slight saffron color in appearance, it never strays much from magnitude -0.2 to +1.4 in brightness. One naked eye observation to watch for is a sudden spurt in brightness known as the opposition surge or Seeliger Effect. This is a retro reflector type effect, caused by all those tiny iceball moonlets in the rings reaching 100% illumination at once. Think of how the Full Moon is actually 3 to 4 times brighter than the 50% illuminated Quarter Moon… all those little peaks, ridges and crater rims no longer casting shadows do indeed add up.

Saturn
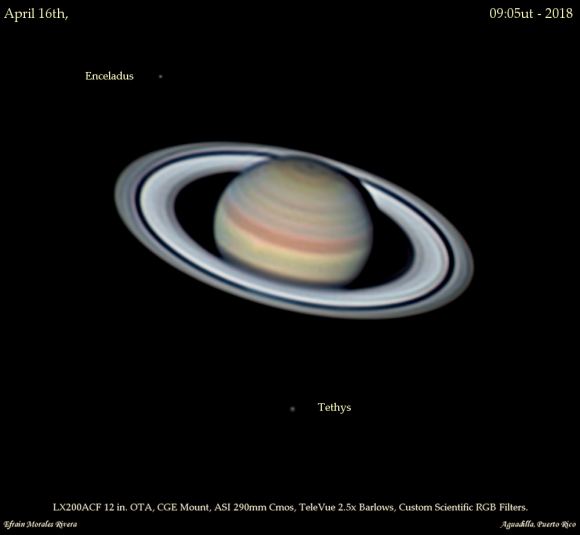
Saturn in all its glory (note the moons Enceladus and Tethys, too!). Image credit and copyright: Efrain Morales.

And this effect is more prominent in recent years for another reason: Saturn’s rings passed maximum tilt (26.7 degrees) with respect to our line of sight just last year, and are still relatively wide open in 2018. They’ll start slimming down again over the next few oppositions, reaching edge-on again in 2028.

Even using a pair of 7×50 hunting binoculars on Saturn, you can tell that something is amiss. You’re getting the same view that Galileo had through his spyglass, the pinnacle of early 17th century technology. He could tell that something about the planet was awry, and drew sketches showing an oblong world with coffee cup handles on the side. Crank up the magnification using even a small 60 mm refractor, and the rings easily jump into view. This is what makes Saturn a star party staple, an eye candy feast capable of drawing the aim of all the telescopes down the row.

If seeing and atmospheric conditions allow, crank up the magnification up to 150x or higher, and the dark groove of the Cassini division snaps into view. Can you see the shadow of the disk of Saturn, cast back onto the plane of the rings? The shadow of the planet hides behind it near opposition, then becomes most prominent towards quadrature, when we get to peek around its edge. Can you spy the limb of the planet itself, through the Cassini Gap?

Though the disk of Saturn is often featureless, tiny swirls of white storms do occasionally pop up. Astrophotographer Damian Peach noted just one such short-lived storm on the ringed planet this past April 2018.

Saturn’s retinue of moons are also interesting to follow in there own right. The first one you’ll note is +8.5 magnitude smog-shrouded Titan. Larger in diameter than Mercury, Titan would easily be a planet in its own right, were it liberated from its primary’s domain.

Though Saturn has 62 known moons, only six in addition to Titan are in range of a modest backyard telescope: Enceladus, Rhea, Dione, Mimas, Tethys and Iapetus. Two-faced Iapetus is especially interesting to follow, as it varies two full magnitudes in brightness during its 79 day orbit. Arthur C. Clarke originally placed the final monolith in 2001: A Space Odyssey on this moon, its artificial coating a beacon to astronomers. Today, we know from flybys carried out by NASA’s Cassini spacecraft that the leading hemisphere of Iapetus is coated with dark in-falling material, originating from the dark Phoebe ring around Saturn.

iapetus
Two-faced Iapetus as imaged by Cassini. Image credit: NASA/JPL/Space Science Institute.

Owners of large light bucket telescopes may also want to try from two fainter +15th magnitude moons: Hyperion and Phoebe.

Fun fact: Saturn’s moons can also cast shadows back on the planet itself, much like the Galilean moons do on Jupiter… the catch, however, is that these events only occur around equinox season in the years around when Saturn’s rings are edge-on. This next occurs starting in 2026.

Cassini finished up its thrilling 20 year mission just last year, with a dramatic plunge into Saturn itself. It will be a while before we return again, perhaps in the next decade if NASA selects a nuclear-powered helicopter to explore Titan. Until then, be sure to explore Saturn this summer, from your Earthbound backyard.

Love to observe the planets? Check out our new forthcoming book, The Universe Today Ultimate Guide to Viewing the Cosmos – out on October 23rd, now up for pre-order.