Einstein Was Right… Again! Successful Test of General Relativity Near a Supermassive Black Hole

Artist’s impression of the path of the star S2 as it passes very close to the supermassive black hole at the centre of the Milky Way. Credit: ESO/M. Kornmesser

In 1915, Albert Einstein published his famous Theory of General Relativity, which provided a unified description of gravity as a geometric property of space and time. This theory gave rise to the modern theory of gravitation and revolutionized our understanding of physics. Even though a century has passed since then, scientists are still conducting experiments that confirm his theory’s predictions.

Thanks to recent observations made by a team of international astronomers (known as the GRAVITY collaboration), the effects of General Relativity have been revealed using a Supermassive Black Hole (SMBH) for the very first time. These findings were the culmination of a 26-year campaign of observations of the SMBH at the center of the Milky Way (Sagittarius A*) using the European Southern Observatory‘s (ESO) instruments.

The study which describes the team’s findings recently appeared in the journal Astronomy and Astrophysics, titled “Detection of the gravitational redshift in the orbit of the star S2 near the Galactic centre massive black hole“. The study was led by Roberto Arbuto of the ESO and included members from the GRAVITY collaboration – which is led by Reinhard Genzel of the Max Planck Institute for Extraterrestrial Physics (MPE) and includes astronomers from multiple European universities and research institutes.

Annotated image of the path of the star S2 as it passes very close to the supermassive black hole at the center of the Milky Way. Credit: ESO/M. Kornmesser

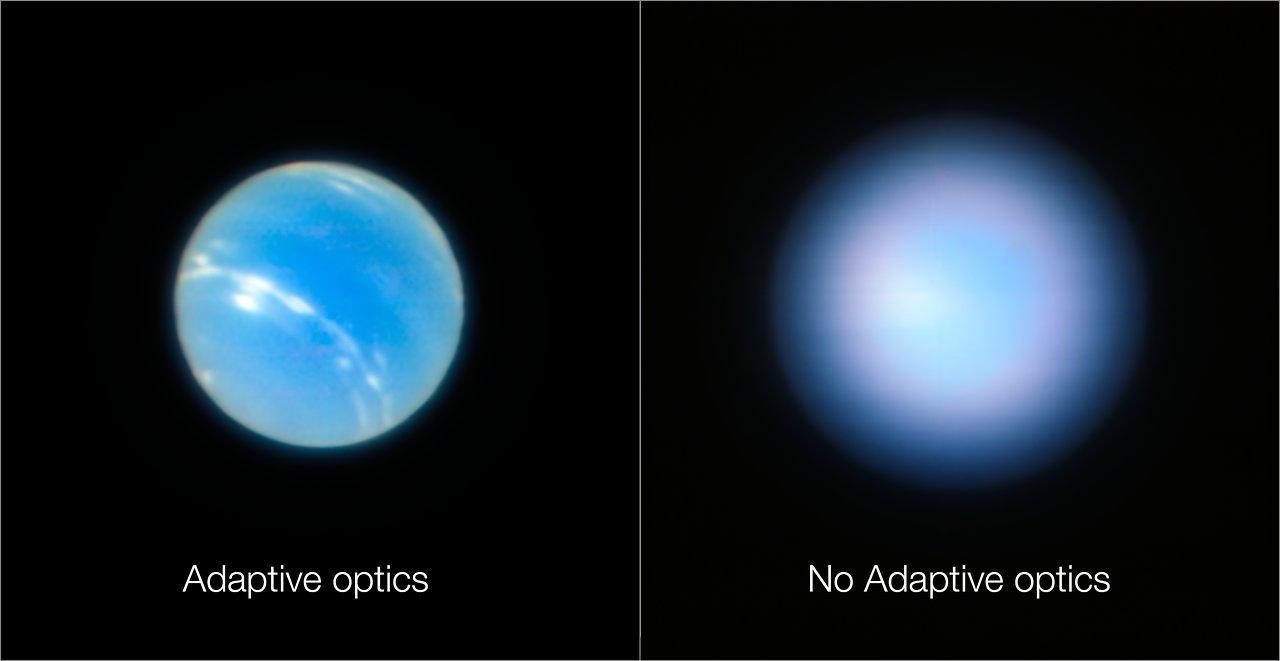
For the sake of their study, the team relied on data gathered by the VLT’s extremely sensitive and high-precision instruments. These included the GRAVITY astrometric and interferometry instrument, the Spectrograph for INtegral Field Observations in the Near Infrared (SINFONI) instrument, and the Nasmyth Adaptive Optics System (NAOS) – Near-Infrared Imager and Spectrograph (CONICA) instrument, which are together known as NACO.

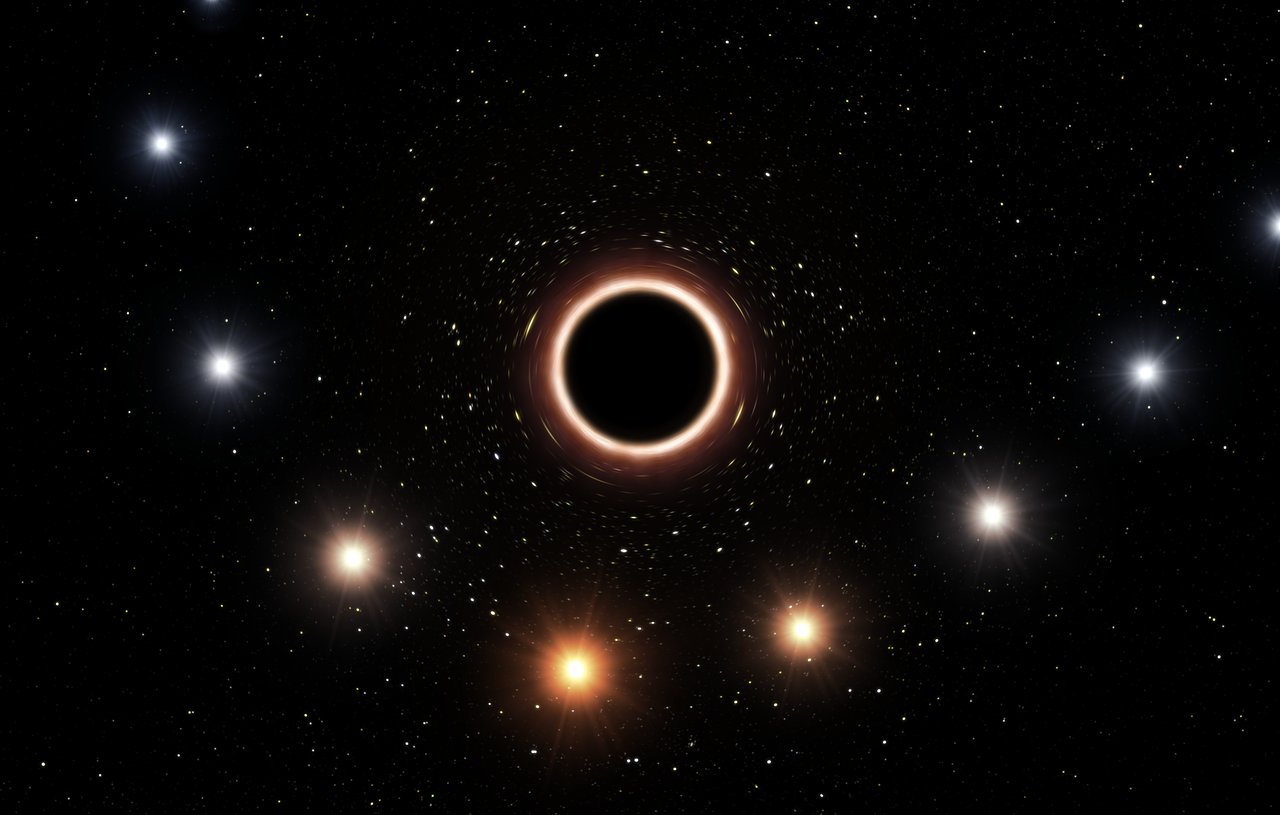
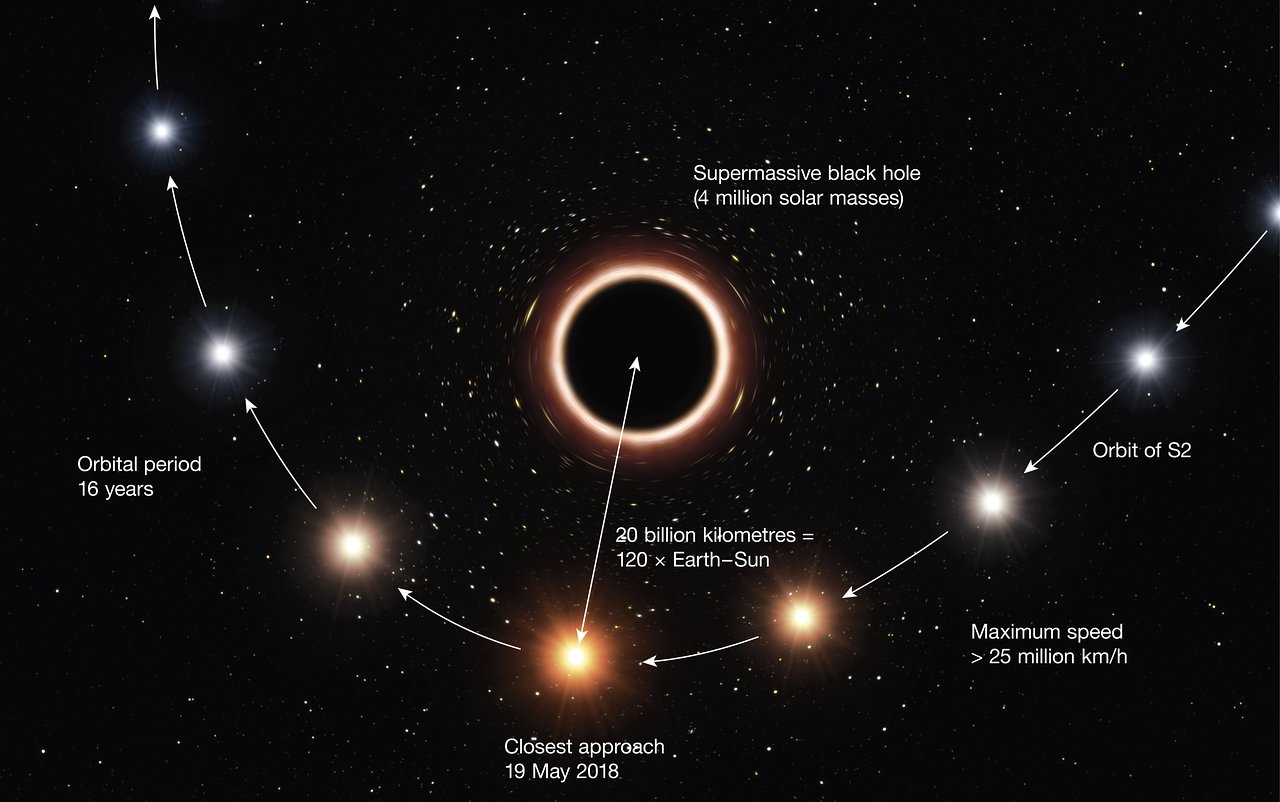
The new infrared observations collected by these instruments allowed the team to monitor one of the stars (S2) that orbits Sagittarius A* as it passed in front of the black hole – which took place in May of 2018. At the closest point in its orbit, the star was at a distance of less than 20 billion km (12.4 billion mi) from the black hole and was moving at a speed in excess of 25 million km/h (15 million mph) – almost three percent of the speed of light.

Whereas the SINFONI instrument was used to measure the velocity of S2 towards and away from Earth, the GRAVITY instrument in the VLT Interferometer (VLTI) made extraordinarily precise measurements of the changing position of S2 in order to define the shape of its orbit. The GRAVITY instrument then created the sharp images that revealed the motion of the star as it passed close to the black hole.

The team then compared the position and velocity measurements to previous observations of S2 using other instruments. They then compared these results with predictions made by Newton’s Law of Universal Gravitation, General Relativity, and other theories of gravity. As expected, the new results were consistent with the predictions made by Einstein over a century ago.

As Reinhard Genzel, who in addition to being the leader of the GRAVITY collaboration was a co-author on the paper, explained in a recent ESO press release:

“This is the second time that we have observed the close passage of S2 around the black hole in our galactic center. But this time, because of much improved instrumentation, we were able to observe the star with unprecedented resolution. We have been preparing intensely for this event over several years, as we wanted to make the most of this unique opportunity to observe general relativistic effects.”

When observed with the VLT’s new instruments, the team noted an effect called gravitational redshift, where the light coming from S2 changed color as it drew closer to the black hole. This was caused by the very strong gravitational field of the black hole, which stretched the wavelength of the star’s light, causing it to shift towards the red end of the spectrum.

The change in the wavelength of light from S2 agrees precisely with what Einstein’s field equation’s predicted. As Frank Eisenhauer – a researcher from the Max Planck Institute of Extraterrestrial Physics, the Principal Investigator of GRAVITY and the SINFONI spectrograph, and a co-author on the study – indicated:

Our first observations of S2 with GRAVITY, about two years ago, already showed that we would have the ideal black hole laboratory. During the close passage, we could even detect the faint glow around the black hole on most of the images, which allowed us to precisely follow the star on its orbit, ultimately leading to the detection of the gravitational redshift in the spectrum of S2.

Whereas other tests have been performed that have confirmed Einstein’s predictions, this is the first time that the effects of General Relativity have been observed in the motion of a star around a supermassive black hole. In this respect, Einstein has been proven right once again, using one the most extreme laboratory to date! What’s more, it confirmed that tests involving relativistic effects can provide consistent results over time and space.

“Here in the Solar System we can only test the laws of physics now and under certain circumstances,” said Françoise Delplancke, head of the System Engineering Department at ESO. “So it’s very important in astronomy to also check that those laws are still valid where the gravitational fields are very much stronger.”

In the near future, another relativistic test will be possible as S2 moves away from the black hole. This is known as a Schwarzschild precession, where the star is expected to experience a small rotation in its orbit. The GRAVITY Collaboration will be monitoring S2 to observe this effect as well, once again relying on the VLT’s very precise and sensitive instruments.

As Xavier Barcons (the ESO’s Director General) indicated, this accomplishment was made possible thanks to the spirit of international cooperation represented by the GRAVITY collaboration and the instruments they helped the ESO develop:

“ESO has worked with Reinhard Genzel and his team and collaborators in the ESO Member States for over a quarter of a century. It was a huge challenge to develop the uniquely powerful instruments needed to make these very delicate measurements and to deploy them at the VLT in Paranal. The discovery announced today is the very exciting result of a remarkable partnership.”

And be sure to check out this video of the GRAVITY Collaboration’s successful test, courtesy of the ESO:

Further Reading: ESO, Astronomy and Astrophysics

Catch Comet C/2017 S3 PanSTARRS in Outburst

Comet S3 PanSTARRS
Comet C/2017 S3 PanSTARRS from July 22nd. Image credit and copyright: hodorgabor
Comet S3 PanSTARRS
Comet C/2017 S3 PanSTARRS from July 22nd. Image credit and copyright: hodorgabor

Comets are one of those great question marks in observational astronomy. Though we can plot their orbits thanks to Newton and Kepler, just how bright they’ll be and whether or not they will fizzle or fade is always a big unknown, especially if they’re a dynamic newcomer from the Oort Cloud just visiting the inner solar system for the first time.

We had just such a surprise from a cosmic visitor over the past few weeks, as comet C/2017 S3 PanSTARRS erupted twice, brightening into binocular visibility. Discovered on December 23rd 2017 during the PanSTARRS survey based on Haleakala, Hawai’i, S3 PanSTARRS is on a long-period, hyperbolic orbit and is most likely a first time visitor to the inner solar system.

The orbital path of comet S3 PanSTARRS through the inner solar system. Credit NASA/JPL.

S3 PanSTARRS was not only rocked by two new outbursts in quick succession, but seems to have undergone a tail disconnection event just last week, leveling off its brightness at around +8 magnitude and holding. This puts it in the range of binoculars under dark skies, looking like a fuzzy globular that refuses to snap into focus as it currently glides through the constellation of Camelopardalis the Giraffe the dawn sky.

The path of comet S3 PanSTARRS through August. Credit: Starry Night.

As July closes out, the time to catch sight of Comet S3 PanSTARRS is now, before it’s lost in the Sun’s glare. From latitude 40 degrees north, the comet sits 20 degrees above the northeastern horizon, about an hour before sunrise. By August 7th however, it drops below 10 degrees altitude. From there, the comet begins to circle the Sun as seen from the Earth beginning to favor southern hemisphere observers at dawn, who may be able to track it straight through perihelion on August 16th, if its brightness holds up. From there, northern hemisphere viewers may get a second view at dawn in September, again, if its brightness holds.

The dawn path of the comet looking northeast at dawn from latitude 35 degrees north, from July 31st through the first week of August. Credit: Starry Night.

You never know when it comes to comets. Here’s a brief rundown of the celestial happenings for comet C/2017 S3 PanSTARRS:

August

3- Crosses into the constellation Gemini.

4- Passes near the bright star Castor.

5- Passes near the bright star Pollux.

7- Crosses into the constellation Cancer.

7- Passes closest to the Earth, at 0.758 Astronomical Units (AU) distant.

8- Crosses southward over the ecliptic plane.

9- Passes just 4 degrees from the Beehive cluster, M44.

11- Passes 2 degrees from the open cluster M67.

12- Passes 10.5 degrees from Sun (1st apparent close pass as seen from the Earth)

13- Crosses into the constellation Hydra.

15- Reaches maximum brightness: the comet may top +2nd magnitude in mid-August.

16- Reaches perihelion at 0.21 AU from the Sun.

18- Crosses into the constellation Sextans.

30-Crosses into the constellation Leo.

31-Crosses the ecliptic plane northward.

The projected light curve for comet S3 PanSTARRS. The black dots are actual observations. Credit Seiichi Yoshida.

September

3- passes 4 degrees from the Sun.

25- Crosses into the constellation Coma Berenices.

From there, Comet C/2017 S3 PanSTARRS drops back below 6th magnitude in September, then below 10th magnitude in October as it heads back off into the icy realms of the outer solar system.

Be sure to nab this icy interloper why you can. The quote comet hunter David Levy, “Comets are like cats… they have tails, and they do exactly what they want.”

New Photos of Saturn and Mars from Hubble

This image shows the recent observations of the planets Mars and Saturn made with the NASA/ESA Hubble Space Telescope. Credit: NASA, ESA, STScI, M. Mutchler (STScI), A. Simon (GSFC) and the OPAL Team, J. DePasquale (STScI)

During the summer of 2018, the planets of Mars and Saturn (one after the other) have been in opposition. In astronomical terms, opposition refers to when a planet is on the opposite side of the Earth relative to the Sun. This not only means that the planet is closer to Earth in its respective orbit, but that is also fully lit by the Sun (as seen from Earth) and much more visible.

As a result, astronomers are able to observe these planets in greater detail. The Hubble Space Telescope took advantage of this situation to do what it has done best for the past twenty-eight years – capture some breathtaking images of both planets! Hubble made its observations of Saturn in June and Mars in July, and showed both planets close to their opposition.

Continue reading “New Photos of Saturn and Mars from Hubble”

Titan Looks Cool in Infrared

Infrared images of Saturn's moon Titan, captured by Cassini's the Visual and Infrared Mapping Spectrometer (VIMS) instrument. Credit: NASA/JPL-Caltech/Stéphane Le Mouélic, University of Nantes, Virginia Pasek, University of Arizona

The Cassini spacecraft ended its mission on September 15th, 2017, when it crashed into Saturn’s atmosphere, thus preventing any possible contamination of the system’s moons. Nevertheless, the wealth of data the probe collected during the thirteen years it spent orbiting Saturn (of the gas giant, its rings, and its many moons) continues to be analyzed by scientists – with amazing results!

Case in point, the Cassini team recently released a series of colorful images that show what Titan looks like in infrared. The images were constructing using 13 years of data that was accumulated by the spacecraft’s Visual and Infrared Mapping Spectrometer (VIMS) instrument. These images represent some of the clearest, most seamless-looking global views of the icy moon’s surface produced so far.

Infrared images provide a unique opportunity when studying Titan, which is difficult to observe in the visible spectrum because of its dense and hazy atmosphere. This is primarily the result of small particles called aerosols in Titan’s upper atmosphere, which strongly scatter visible light. However, where the scattering and absorption of light is much weaker, this allows for infrared “windows” that make it possible to catch glimpses of Titan’s surface.

Comparison between how Titan appears in visible light (center), and in infrared. Credit: NASA/JPL-Caltech/Stéphane Le Mouélic, University of Nantes, Virginia Pasek, University of Arizona

It is because of this that the VIMS was so valuable, allowing scientists to provide clear images of Titan’s surface. This latest collection of images are especially unique because of the smoothness and clarity they offer. In previous infrared images captured by the Cassini spacecraft of Titan (see below), there were great variations in imaging resolution and lighting conditions, which resulted in obvious seams between different areas of the surface.

This is due to the fact that the VIMS obtained data over many different flybys with different observing geometries and atmospheric conditions. As a result, very prominent seams appear in mosaic images that are quite difficult to remove. But, through laborious and detailed analyses of the data, along with time consuming hand processing of the mosaics, Cassini’s imaging team was able to mostly remove the seams.

The process used to reduce the prominence of seams is known as the “band-ratio” technique. This process involves combining three color channels (red, green and blue), using a ratio between the brightness of Titan’s surface at two different wavelengths. The technique also emphasizes subtle spectral variations in the materials on Titan’s surface, as evidenced by the bright patches of brown, blue and purple (which may be evidence of different compositions).

The three mosaics shown here were composed with data from Cassini’s Visual and Infrared Mapping Spectrometer (VIMS) taken during the three flybys of Titan. Credit: NASA/JPL/University of Arizona

In addition to offering the clearest and most-seamless glimpse of Titan yet, these unique images also highlight the moon’s complex geography and composition. They also showcase the power of the VIMS instrument, which has paved the way for future infrared instruments that could capture images of Titan at much higher resolution and reveal features that Cassini was not able to see.

In the coming years, NASA hopes to send additional missions to Titan to explore its surface and methane lakes for signs of biosignatures. An infrared instrument, which can see through Titan’s dense atmosphere, provide high-resolution images of the surface and help determine its composition, will prove very useful in this regard!

Further Reading: NASA

Was There a Time When the Moon was Habitable?

Artist's concept of a terraformed moon. According to a new study, the Moon may have had periods of habitability in its past where it had an atmosphere and liquid water on its surface. Credit: Ittiz

To put it simply, the Earth’s Moon is a dry, airless place where nothing lives. Aside from concentrations of ice that exist in permanently-shaded craters in the polar regions, the only water on the moon is believed to exist beneath the surface. What little atmosphere there is consists of elements released from the interior (some of which are radioactive) and helium-4 and neon, which are contributed by solar wind.

However, astronomers have theorized that there may have been a time when the Moon might have been inhabitable. According to a new study by an astrophysicist and an Earth and planetary scientist, the Moon may have had two early “windows” for habitability in the past. These took place roughly 4 billion years ago (after the Moon formed) and during the peak in lunar volcanic activity (ca. 3.5 billion years ago).

Continue reading “Was There a Time When the Moon was Habitable?”

Andromeda Shredded and Consumed a Massive Galaxy About Two Billion Years Ago

Andromeda Galaxy. Credit: Wikipedia Commons/Adam Evans

Scientists have long understood that in the course of cosmic evolution, galaxies become larger by consuming smaller galaxies. The evidence of this can be seen by observing galactic halos, where the stars of cannibalized galaxies still remain. This is certainly true of the Andromeda Galaxy (aka. M31, Earth’s closest neighbor) which has a massive and nearly-invisible halo of stars that is larger than the galaxy itself.

For some time, scientists believed that this halo was the result of hundreds of smaller mergers. But thanks to a new study by a team of researchers at the University of Michigan, it now appears that Andromeda’s halo is the result of it cannibalizing a massive galaxy some two billion years ago. Studying the remains of this galaxy will help astronomers understand how disk galaxies (like the Milky Way) evolve and survive large mergers.

The study, titled “The Andromeda galaxy’s most important merger about 2 billion years ago as M32’s likely progenitor“, recently appeared in the scientific journal Nature. The study was conducted by Richard D’Souza, a postdoctoral researcher at the University of Michigan and the Vatican Observatory; and Eric F. Bell, the Arthur F. Thurnau Professor at the University of Michigan.

In this image, the Andromeda galaxy shreds the large galaxy M32p, which eventually resulted in M32 and a giant halo of stars. Credit: Richard D’Souza. Credit: AAS/IOP/Wei-Hao Wang

Using computer models, Richard D’Souza and Eric Bell were able to piece together how a once-massive galaxy (named M32p) disrupted and eventually came to merge with Andromeda. From their simulations, they determined that M32p was at least 20 times larger than any galaxy that has merged with the Milky Way over the course of its lifetime.

M32p would have therefore been the third-largest member of the Local Group of galaxies, after the Milky Way and Andromeda galaxies, and was therefore something of a “long-lost sibling”. However, their simulations also indicated that many smaller companion galaxies merged with Andromeda over time. But for the past, Andromeda’s halo is the result of a single massive merger. As D’Souza explained in a recent Michigan News press statement:

“It was a ‘eureka’ moment. We realized we could use this information of Andromeda’s outer stellar halo to infer the properties of the largest of these shredded galaxies. Astronomers have been studying the Local Group—the Milky Way, Andromeda and their companions—for so long. It was shocking to realize that the Milky Way had a large sibling, and we never knew about it.”

This study will not only help astronomers understand how galaxies like the Milky Way and Andromeda grew through mergers, it might also shed light on a long-standing mystery – which is how Andromeda’s satellite galaxy (M32) formed. According to their study, D’Souza and Bell believe that M32 is the surviving center of M32p, which is what remained after its spiral arms were stripped away.

Messier 31 (the Andromeda Galaxy), along with Messier 32 and Messier 110. Credit: Wikisky

“M32 is a weirdo,” said Bell. “While it looks like a compact example of an old, elliptical galaxy, it actually has lots of young stars. It’s one of the most compact galaxies in the universe. There isn’t another galaxy like it.” According to D’Souza and Bell, this study may also alter the traditional understanding of how galaxies evolve. In astronomy, conventional wisdom says that large interactions would destroy disk galaxies and form elliptical galaxies.

But if Andromeda did indeed survive an impact with a massive galaxy, it would indicate that this is not the case. The timing of the merger may also explain recent research findings which indicated that two billion years ago, the disk of the Andromeda galaxy thickened, leading to a burst in star formation. As Bell explained:

“The Andromeda Galaxy, with a spectacular burst of star formation, would have looked so different 2 billion years ago. When I was at graduate school, I was told that understanding how the Andromeda Galaxy and its satellite galaxy M32 formed would go a long way towards unraveling the mysteries of galaxy formation.”

In the end, this method could also be used to study other galaxies and determine which were the most massive mergers they underwent. This could allow scientists to better understand the complicated process that drives galaxy growth and how mergers affect galaxies. This knowledge will certainly come in handy when it comes to determining what will happen to our galaxy when it merges with Andromeda in a few billion years.

Further Reading: Michigan News

Mars Meets the MiniMoon During the Longest Total Lunar Eclipse of the Century

lunar eclipse
A blood red moon captured during the total lunar eclipse of January 31st, 2018. Image credit and copyright: Eliot Herman

lunar eclipse
A blood red moon captured during the total lunar eclipse of January 31st, 2018. Image credit and copyright: Eliot Herman

The Blood Moon cometh.

One of the top astronomy events of 2018 occurs on the evening of Friday, July 27th, when the Moon enters the shadow of the Earth for a total lunar eclipse. In the vernacular that is the modern internet, this is what’s becoming popularly known as a “Blood Moon,” a time when the Moon reddens due to the refracted sunlight from a thousand sunsets falling upon it. Standing on the surface of the Moon during a total lunar eclipse (which no human has yet to do) you would see a red “ring of fire” ’round the limb of the eclipsed Earth.

This is the second total lunar eclipse for 2018, and the middle of a unique eclipse season bracketed by two partial solar eclipses, one on July 13th, and another crossing the Arctic and Scandinavia on August 11th.

The path of the Moon through the Earth’s shadow Friday, along with visibility prospects worldwide. Credit: NASA/GSFC

The July 27th total lunar eclipse technically begins around 17:15 Universal Time (UT), when the Moon enters the bright penumbral edge of the Earth’s shadow. Expect the see a slight shading on the southwest edge of the Moon’s limb about 30 minutes later. The real action begins around 18:24 UT, when the Moon starts to enter the dark inner umbra and the partial phases of the eclipse begin. Totality runs from 19:30 UT to 21:13 UT, and the cycle reverses through partial and penumbral phases, until the eclipse ends at 23:29 UT.

Centered over the Indian Ocean region, Africa, Europe and western Asia get a good front row seat to the entire total lunar eclipse. Australia and eastern Asia see the eclipse in progress at moonset, and South America sees the eclipse in progress at moonrise just after sunset. Only North America sits this one out.

Now, this total lunar eclipse is special for a few reasons.

First off, we’ll have the planet Mars at opposition less than 15 hours prior to the eclipse. This means the Red Planet will shine at a brilliant magnitude -2.8, just eight degrees from the crimson Moon during the eclipse, a true treat and an easy crop to get both in frame. We fully expect to see some great images of Mars at opposition along with the eclipsed Moon.

Mars versus the eclipsed Moon on Friday. Credit: Stellarium

How close can the two get? Well, stick around until April 27th, 2078 and you can see the Moon occult (pass in front of) Mars during a penumbral lunar eclipse as seen from South America.

And speaking of occultations, the Moon occults some interesting stars during totality Friday, the brightest of which is the +5.9 magnitude double star Omicron Capricorni (SAO 163626) as seen from Madagascar and the southern tip of Africa. Omicron Capricorni has a wide separation of 22″.

The occultation path of Omicron Capricorni during Friday’s eclipse. Credit: Occult 4.2.

The second unique fact surrounding this eclipse is one you’ve most likely already heard: it is indeed the longest one for this century… barely. This occurs because the Moon reaches its descending node along the ecliptic on July 27th at 22:40 UT, just 21 minutes after leaving the umbral shadow of the Earth. This makes for a very central eclipse, nearly piercing the umbral shadow of the Earth right through its center.

Totality on Friday lasts for 1 hour, 42 minutes and 57 seconds. This was last beat on July 16th, 2000 with a duration of 1 hour, 46 minutes and 24 seconds (2001 is technically the first year of the 21st century). The duration for Friday’s eclipse won’t be topped until June 9th 2123 (1 hour 46 minutes six seconds), making it the longest for a 123 year span.

The longest total lunar eclipse over the span of 5,000 years from 2000 BC to 3000 AD was on May 31st, 318 AD at 106.6 minutes in duration.

A Minimoon Eclipse

Finally, a third factor is assisting this eclipse in its longevity is the onset of the MiniMoon: The Moon reaches apogee at July 27th, 5:22 UT, 14 hours and 37 minutes prior to Full and the central time of the eclipse. This is the most distant Full Moon of the year for 2018 (406,222 km at apogee) the 2nd most distant apogee for 2018. Apogee on January 15th, beats it out by only 237 kilometers. This not only gives the Moon a slightly smaller size visually at 29.3′, versus 34.1′ near perigee, less than half of the 76′ arcminute diameter of the Earth’s shadow. This also means that the Moon is moving slightly slower in its orbit, making a more stately pass through the Earth’s shadow.

Going, going… the stages of a lunar eclipse. Credit: Dave Dickinson.

What will the Moon look like during the eclipse? Not all total lunar eclipses are the same, but I’d expect a dark, brick red hue from such a deep eclipse. The color of the Moon during a eclipse is described as its Danjon number, ranging from a bright (4) to dark murky copper color (0) during totality.

Tales of the Saros

This particular eclipse is member 38 of the 71 lunar eclipses in saros series 129, running from June 10th, 1351 all the way out to the final eclipse in the series on July 24th, 2613 AD. If you caught the super-long July 16th, 2000 eclipse (the longest for the 20th century) then you saw the last one in the series, and the next one for the series occurs on August 7th, 2036. Collect all three, and you’ve completed a triple exeligmos series, a fine word in Scrabble to land on a triple word score.

Photographing the Moon

If you can shoot the Moon, you can shoot a total lunar eclipse, though a minimum focal length lens of around 200mm is needed to produce a Moon much larger that a dot. The key moment is the onset of totality, when you need to be ready to rapidly dial the exposure settings down from the 1/100th of a second range down to 1 second or longer. Be careful not to lose sight of the Moon in the viewfinder all together!

Are you watching the eclipse during moonrise or moonset? This is a great time to shoot the eclipsed Moon along with foreground objects… you can also make an interesting observation around this time, and nab the eclipsed Moon and the Sun above the local horizon at the same time in what’s termed a selenelion. This works mainly because the Earth’s shadow is larger than the apparent diameter of the Moon, allowing it to be cast slightly off to true center after sunrise or just before sunset. Gaining a bit of altitude and having a low, flat horizon helps, as the slight curve of the Earth also gives the Sun and Moon a tiny boost. For this eclipse, the U2-U3 umbral contact zone for a selenelion favors eastern Brazil, the UK and Scandinavia at moonrise, and eastern Australia, Japan and northeastern China at moonset.

Incidentally, a selenelion is the second visual proof you see during a lunar eclipse that the Earth is indeed round, the first being the curve of the planet’s shadow seen at all angles as it falls across the Moon.

Another interesting challenge would be to capture a transit of the International Space Station during the eclipse, either during the partial or total phases… to our knowledge, this has never been done during a lunar eclipse. This Friday, South America gets the best shots at a lunar eclipse transit of the ISS:

ISS transit paths (revised) during Friday’s eclipse, including times in UT and Moon phases. The northern and southern limits of the paths mark the point where the Moon is no longer visible. Created by the author using CalSky. (Thanks to PAHLES in comments below for pointing out the errors in the first map!)

Be sure to check CalSky for a transit near you.

Watch Friday’s eclipse live online. Credit: Gianluca Masi/Virtual Telescope Project.

Live on the wrong continent, or simply have cloudy skies? Gianluca Masi and the Virtual Telescope Project 2.0 have you covered, with a live webcast of the eclipse from the heart of Rome, Italy on July 27th starting at 18:30 UT.

Be sure to catch Friday’s total lunar eclipse, either in person or online… we won’t have another one until January 21st, 2019.

Learn about eclipses, occultations, the motion of the Moon and more in our new book: Universe Today’s Guide to the Cosmos: Everything You Need to Know to Become an Amateur Astronomer now available for pre-order.

Life on Europa Would be Protected by Just a Few Centimeters of Ice

Radiation from Jupiter can destroy molecules on Europa's surface. Material from Europa's ocean that ends up on the surface will be bombarded by radiation, possibly destroying any biosignatures, or chemical signs that could imply the presence of life. Credit: NASA/JPL-Caltech

Ever since the Galileo probe provided compelling evidence for the existence of a global ocean beneath the surface of Europa in the 1990s, scientists have wondered when we might be able to send another mission to this icy moon and search for possible signs of life. Most of these mission concepts call for an orbiter or lander than will study Europa’s surface, searching the icy sheet for signs of biosignatures turned up from the interior.

Unfortunately, Europa’s surface is constantly bombarded by radiation, which could alter or destroy material transported to the surface. Using data from the Galileo and Voyager 1 spacecraft, a team of scientists recently produced a map that shows how radiation varies across Europa’s surface. By following this map, future missions like NASA’s Europa Clipper will be able to find the spots where biosignatures are most likely to still exist.

As many missions have revealed by studying Europa’s surface, the moon experiences periodic exchanges between the interior and the surface. If there is life in its interior ocean, then biological material could theoretically be brought to the surface where it could be studied. Since radiation from Jupiter’s magnetic field would destroy this material, knowing where it is most intense, how deep it goes, and how it could affect the interior are all important questions.

Artist’s impression of water bubbling up from Europa’s interior ocean and breaching the surface ice. Credit: NASA/JPL-Caltech

As Tom Nordheim, a research scientist at NASA’s Jet Propulsion Laboratory, explained in a recent NASA press release:

“If we want to understand what’s going on at the surface of Europa and how that links to the ocean underneath, we need to understand the radiation. When we examine materials that have come up from the subsurface, what are we looking at? Does this tell us what is in the ocean, or is this what happened to the materials after they have been radiated?”

To address these question, Nordheim and his colleagues examined data from Galileo‘s flybys of Europa and electron measurements from NASA’s Voyager 1 spacecraft. After looking closely at the electrons blasting the moon’s surface, Nordheim and his team found that the radiation doses vary by location. The harshest radiation is concentrated in zones around the equator, and the radiation lessens closer to the poles.

The study which describes their findings recently appeared in the scientific journal Nature under the title “Preservation of potential biosignatures in the shallow subsurface of Europa“. The study was led by Nordheim and was co-authored by Kevin Hand (also with the JPL) and Chris Paranicas from the Johns Hopkins Applied Physics Laboratory in Laurel, Maryland.

Artist’s concept of a Europa Clipper mission. Credit: NASA/JPL

“This is the first prediction of radiation levels at each point on Europa’s surface and is important information for future Europa missions,” said Paranicas. Now that scientists know where to find regions least altered by radiation, they will be able to designate areas of study for the Europa Clipper, a JPL-led mission that is expected to launch as early as 2022.

For the sake of their study, Nordheim and his team went beyond a conventional two-dimensional map to build 3D models that examined how far below the surface the radiation penetrates. To test how deep organic material would have to be buried in order to survive, Nordheim and his team tested the effect of radiation on amino acids (the basic building blocks for proteins) to figure out how Europa’s exposure to radiation would affect potential biosignatures.

The results indicate how deep scientists will need to dig or drill during a potential future Europa lander mission in order to find any biosignatures that might be preserved. In the highest-radiation zones around the equator, the depth at which biosignatures could be found ranged from 10 to 20 cm (4 to 8 inches). At the middle- and high-latitudes, closer to the poles, the depths decrease to about 1 cm (0.4 inches). As Hand indicated:

“The radiation that bombards Europa’s surface leaves a fingerprint. If we know what that fingerprint looks like, we can better understand the nature of any organics and possible biosignatures that might be detected with future missions, be they spacecraft that fly by or land on Europa.”

Artist’s impression of a water vapor plume on Europa. Credit: NASA/ESA/K. Retherford/SwRI

When the Europa Clipper mission reaches the Jovian system, the spacecraft will orbit Jupiter and conducting about 45 close flybys of Europa. It’s advanced suite of scientific instruments will include cameras, spectrometers, plasma and radar instruments which will investigate the composition of the moon’s surface, its ocean, and material that has been ejected from the surface.

“Europa Clipper’s mission team is examining possible orbit paths, and proposed routes pass over many regions of Europa that experience lower levels of radiation,” Hand said. “That’s good news for looking at potentially fresh ocean material that has not been heavily modified by the fingerprint of radiation.”

With this new radiation map, the mission team will be able to narrow the range of possible research sites. This, in turn, will increase the likelihood that the orbiter mission will be able to settle the decades-old mystery of whether or not there is life in the Jovian system.

Further Reading: NASA, Nature

This is a Photo of Neptune, From the Ground! ESO’s New Adaptive Optics Makes Ground Telescopes Ignore the Earth’s Atmosphere

This image of the planet Neptune was obtained during the testing of the Narrow-Field adaptive optics mode of the MUSE/GALACSI instrument on ESO’s Very Large Telescope. The corrected image is sharper than a comparable image from the NASA/ESA Hubble Space Telescope. Credit: ESO/P. Weilbacher (AIP)

In 2007, the European Southern Observatory (ESO) completed work on the Very Large Telescope (VLT) at the Paranal Observatory in northern Chile. This ground-based telescope is the world’s most advanced optical instrument, consisting of four Unit Telescopes with main mirrors (measuring 8.2 meters in diameter) and four movable 1.8-meter diameter Auxiliary Telescopes.

Recently, the VLT was upgraded with a new instrument known as the Multi Unit Spectroscopic Explorer (MUSE), a panoramic integral-field spectrograph that works at visible wavelengths. Thanks to the new adaptive optics mode that this allows for (known as laser tomography) the VLT was able to recently acquire some images of Neptune, star clusters and other astronomical objects with impeccable clarity.

In astronomy, adaptive optics refers to a technique where instruments are able to compensate for the blurring effect caused by Earth’s atmosphere, which is a serious issue when it comes to ground-based telescopes. Basically, as light passes through our atmosphere, it becomes distorted and causes distant objects to become blurred (which is why stars appear to twinkle when seen with the naked eye).

Images of the planet Neptune obtained during the testing of the Narrow-Field adaptive optics mode of the MUSE/GALACSI instrument on ESO’s Very Large Telescope. Credit: ESO/P. Weilbacher (AIP

One solution to this problem is to deploy telescopes into space, where atmospheric disturbance is not an issue. Another is to rely on advanced technology that can artificially correct for the distortions, thus resulting in much clearer images. One such technology is the MUSE instrument, which works with an adaptive optics unit called a GALACSI – a subsystem of the Adaptive Optics Facility (AOF).

The instrument allows for two adaptive optics modes – the Wide Field Mode and the Narrow Field Mode. Whereas the former corrects for the effects of atmospheric turbulence up to one km above the telescope over a comparatively wide field of view, the Narrow Field mode uses laser tomography to correct for almost all of the atmospheric turbulence above the telescope to create much sharper images, but over a smaller region of the sky.

This consists of four lasers that are fixed to the fourth Unit Telescope (UT4) beaming intense orange light into the sky, simulating sodium atoms high in the atmosphere and creating artificial “Laser Guide Stars”. Light from these artificial stars is then used to determine the turbulence in the atmosphere and calculate corrections, which are then sent to the deformable secondary mirror of the UT4 to correct for the distorted light.

Using this Narrow Field Mode, the VLT was able to capture remarkably sharp test images of the planet Neptune, distant star clusters (such as the globular star cluster NGC 6388), and other objects. In so doing, the VLT demonstrated that its UT4 mirror is able to reach the theoretical limit of image sharpness and is no longer limited by the effects of atmospheric distortion.

The most powerful laser guide star system in the world sees first light at the Paranal Observatory. Credit: ESO

This essentially means that it is now possible for the VLT to capture images from the ground that are sharper than those taken by the Hubble Space Telescope. The results from UT4 will also help engineers to make similar adaptations to the ESO’s Extremely Large Telescope (ELT), which will also rely on laser tomography to conduct its surveys and accomplish its scientific goals.

These goals include the study of supermassive black holes (SMBHs) at the centers of distant galaxies, jets from young stars, globular clusters, supernovae, the planets and moons of the Solar System, and extra-solar planets. In short, the use of adaptive optics – as tested and confirmed by the VLT’s MUSE – will allow astronomers to use ground-based telescopes to study the properties of astronomical objects in much greater detail than ever before.

In addition, other adaptive optics systems will benefit from work with the Adaptive Optics Facility (AOF) in the coming years. These include the ESO’s GRAAL, a ground layer adaptive optics module that is already being used by  the Hawk-I infrared wide-field imager. In a few years, the powerful Enhanced Resolution Imager and Spectrograph (ERIS) instrument will also be added to the VLT.

Between these upgrades and the deployment of next-generation space telescopes in the coming years (like the James Webb Space Telescope, which will be deploying in 2021), astronomers expect to bringing a great deal more of the Universe “into focus”. And what they see is sure to help resolve some long-standing mysteries, and will probably create a whole lot more!

And be sure to enjoy these videos of the images obtained by the VLT of Neptune and NGC 6388, courtesy of the ESO:

Further Reading: ESO

This Stunning Photo Shows the Martian Dust Storm as it was Just Getting Going

True color image of a storm front located near Utopia Planitia, near the northern polar ice cap of Mars. Credit: Credits: ESA/DLR/FU Berlin

The weather patterns on Mars are rather fascinating, owing to their particular similarities and differences with those of Earth. For one, the Red Planet experiences dust storms that are not dissimilar to storms that happen regularly here on Earth. Due to the lower atmospheric pressure, these storms are much less powerful than hurricanes on Earth, but can grow so large that they cover half the planet.

Recently, the ESA’s Mars Express orbiter captured images of the towering cloud front of a dust storm located close to Mars’ northern polar region. This storm, which began in April 2018, took place in the region known as Utopia Planitia, close to the ice cap at the Martian North Pole. It is one of several that have been observed on Mars in recent months, one which is the most severe to take place in years.

The images (shown above and below) were created using data acquired by the Mars ExpressHigh Resolution Stereo Camera (HRSC). The camera system is operated by the German Aerospace Center (DLR), and managed to capture images of this storm front – which would prove to be the harbinger of the Martian storm season – on April 3rd, 2018, during its 18,039th orbit of Mars.

Anaglyph 3D image of the dust storm front forming above the subpolar plains in northern Mars. Credit: Credits: ESA/DLR/FU Berlin

This storm was one of several small-scale dust storms that have been observered in recent months on Mars. A much larger storm emerged further southwest in the Arabia Terra region, which began in May of 2018 and developed into a planet-wide dust storm within several weeks.

Dust storms occur on Mars when the southern hemisphere experiences summer, which coincides with the planet being closer to the Sun in its elliptical orbit. Due to increased temperatures, dust particles are lifted higher into the atmosphere, creating more wind. The resulting wind kicks up yet more dust, creating a feedback loop that NASA scientists are still trying to understand.

Since the southern polar region is pointed towards the Sun in the summer, carbon dioxide frozen in the polar cap evaporates. This has the effect of thickening the atmosphere and increases surface pressure, which enhances the storms by helping to suspend dust particles in the air. Though they are common and can begin suddenly, Martian dust storms typically stay localized and last only a few weeks.

While local and regional dust storms are frequent, only a few of them develop into global phenomena. These storms only occur every three to four Martian years (the equivalent of approximately 6 to 8 Earth years) and can persist for several months. Such storms have been viewed many times in the past by missions like Mariner 9 (1971), Viking I (1971) and the Mars Global Surveyor (2001).

This global map of Mars shows a growing dust storm as of June 6, 2018. The map was produced by the Mars Color Imager (MARCI) camera on NASA’s Mars Reconnaissance Orbiter spacecraft. The blue dot indicates the approximate location of Opportunity. Image Credit: NASA/JPL-Caltech/MSSS

In 2007, a large storm covered the planet and darkened the skies over where the Opportunity rover was stationed – which led to two weeks of minimal operations and no communications. The most recent storm, which began back in May, has been less intense, but managed to create a state of perpetual night over Opportunity’s location in Perseverance Valley.

As a result, the Opportunity team placed the rover into hibernation mode and shut down communications in June 2018. Meanwhile, NASA’s Curiosity rover continues to explore the surface of Mars, thanks to its radioisotope thermoelectric generator (RTG), which does not rely on solar panels. By autumn, scientists expect the dust storm will weaken significantly, and are confident Opportunity will survive.

According to NASA, the dust storm will also not affect the landing of the InSight Lander, which is scheduled to take place on November 26th, 2018. In the meantime, this storm is being monitored by all five active ESA and NASA spacecraft around Mars, which includes the 2001 Mars Odyssey, the Mars Reconnaissance Orbiter, the Mars Atmosphere and Volatile EvolutioN (MAVEN), the Mars Express, and the Exomars Trace Gas Orbiter.

Understanding how global storms form and evolve on Mars will be critical for future solar-powered missions. It will also come in handy when crewed missions are conducted to the planet, not to mention space tourism and colonization!

Further Reading: DLR