The Brightest Star in the Sky, Sirius, was Hiding a Cluster of Stars. Found by Gaia

Obscured Sirius reveals Gaia 1 cluster. Credit and Copyright: H. Kaiser/ESA

In December of 2013, the European Space Agency’s Gaia mission took to space. Since that time, this space observatory has been studying a billion astronomical objects – including stars, planets, comets, asteroids and galaxies – for the sake of creating the most precise 3D space catalog ever made. By the time the mission wraps up (later this year, barring extensions), it is expected to reveal some truly amazing things about our Universe.

In fact, with the first release of its data, the Gaia probe revealed something that has gone completely unnoticed until now. While viewing Sirius, the brightest star in the night sky, Gaia revealed a stellar cluster that had previously been obscured by Sirius’ bright light. This cluster – now known as the Gaia 1 Cluster – is now available to the public thanks to a picture that was taken by an amateur astronomer from Germany.

Given its brightness and the fact that it is visible from just about anywhere on the planet, Sirius has been known since antiquity, and was featured prominently in the astrological and astronomical traditions of many cultures. To the ancient Egyptians, the star was used to keep track of time and agriculture, since its return to the sky was linked to the annual flooding of the Nile.

Artist’s impression of a white dwarf star in orbit around Sirius (a main sequence white dwarf). Credit: NASA, ESA and G. Bacon (STScI)

In Ancient Greek mythology, Sirius represented the eye of the Canis Major constellation. Along with Canis Minor, it formed the Great Dog that diligently followed Orion, the Hunter. In Chinese astronomy, the star is known as the star of the “celestial wolf” and lies in the Mansion of Jing. And when Ptolemy created his influential astronomical tract in the 3rd century CE (the Almagest), he used Sirius as the location for the globe’s central meridian.

By the mid-19th century, astronomers determined that Sirius is actually a binary star system. Essentially, the star system consists of a main sequence white dwarf that is roughly two Solar masses and a white dwarf that is slightly more massive than our Sun. Sirius’ bright appearance means that astronomers have had plenty of light to study the star’s properties, but also causes it to outshine other celestial objects in its vicinity.

However, in the course of counting the stars around Sirius, Gaia’s sophisticated instruments managed to detect the Gaia 1 Cluster for the first time. News of both this cluster and another newly-discovered one (the Gaia 2 Cluster) became public after the first release of Gaia data, which took place in September 2016. News of this discovery sent ripples through the astronomical community and has led to much research into this cluster and its companion.

News of the discovery also prompted attempts to visually capture the cluster. Roughly a year ago, Harald Kaiser – an amateur astronomer from Karlsruhe, Germany – attended a public talk about the Gaia mission, where he learned about the Gaia 1 Cluster being spotted near Sirius. Kaiser then eagerly waited for the next clear night so he could find the cluster himself using his 30 cm telescope.

The ESA’s Gaia mission is currently on a five-year mission to map the stars of the Milky Way. Credit: ESA/ATG medialab; background: ESO/S. Brunier.

After snapping a picture of Sirius and correcting for its bright glare, he was able to capture some of the brightest stars in the cluster. As you can see from the image he took (at top), the cluster lies slightly to the left of Sirius and shows a smattering of some of its largest and brightest stars. In addition to revealing the location of this cluster, Kaiser’s efforts are also part of a larger effort to capitalize on the Gaia mission’s progress.

According to a study released in February of last year – led by Sergey Kopsov of Carnegie Melon University – Gaia 1 is a particularly massive cluster. In essence, it weighs in at an impressive 22,000 Solar Masses, is about 29 light-years (9 parsecs) in diameter, and is located 15,000 light years (4.6 kiloparsecs) from Earth. In addition to its size and the fact that it was previously undiscovered, it’s proximity also makes it an opportune target for future research.

The announcement of this cluster has also caused a fair degree of excitement in the scientific community since it validates the capabilities of Gaia and serves as an example of the kinds of things it is expected to reveal. Astronomers are now looking forward to Gaia’s second data release (planned for April 25th) which is expected to provide even more possibilities for new and exciting discoveries.

And be sure to check out this video about the Gaia mission, courtesy of the ESA:

Further Reading: ESA

The Most Detailed Map Ever Made of the Milky Way in Radio Waves

The FUGIN project used the 45 meter Nobeyama radio telescope in Japan to produce the most detailed radio wave map yet of the Milky Way. Image: NAOJ/NASA/JPL-Caltech
The FUGIN project used the 45 meter Nobeyama radio telescope in Japan to produce the most detailed radio wave map yet of the Milky Way. Top: Three color (false color) radio map of the Milky Way (l=10-50 deg) obtained by the FUGIN Project. Red, green, and blue represent the radio intensities of 12CO, 13CO, and C18O, respectively. Second Line: Infrared image of the same region obtained by the Spitzer Space Telescope. Red, green, and blue represent the intensities of 24?m, 8?m, and 5.8?m radio waves respectively. Top Zoom-In: Three color radio map of the Milky Way (l=12-22 deg) obtained by the FUGIN Project. The colors are the same as the top image. Lower-Left Zoom-In: Enlarged view of the W51 region. The colors are the same as the top image.Lower-Right Zoom-In: Enlarged view of the M17 region. The colors are the same as the top image. Image: NAOJ/NASA/JPL-Caltech

A Japanese telescope has produced our most detailed radio wave image yet of the Milky Way galaxy. Over a 3-year time period, the Nobeyama 45 meter telescope observed the Milky Way for 1100 hours to produce the map. The image is part of a project called FUGIN (FOREST Unbiased Galactic plane Imaging survey with the Nobeyama 45-m telescope.) The multi-institutional research group behind FUGIN explained the project in the Publications of the Astronomical Society of Japan and at arXiv.

The Nobeyama 45 meter telescope is located at the Nobeyama Radio Observatory, near Minamimaki, Japan. The telescope has been in operation there since 1982, and has made many contributions to millimeter-wave radio astronomy in its life. This map was made using the new FOREST receiver installed on the telescope.

When we look up at the Milky Way, an abundance of stars and gas and dust is visible. But there are also dark spots, which look like voids. But they’re not voids; they’re cold clouds of molecular gas that don’t emit visible light. To see what’s happening in these dark clouds requires radio telescopes like the Nobeyama.

The Nobeyama 45m radio telescope at the Nobeyama Radio Observatory in Japan. Image:NAOJ

The Nobeyama was the largest millimeter-wave radio telescope in the world when it began operation, and it has always had great resolution. But the new FOREST receiver has improved the telescope’s spatial resolution ten-fold. The increased power of the new receiver allowed astronomers to create this new map.

The new map covers an area of the night sky as wide as 520 full Moons. The detail of this new map will allow astronomers to study both large-scale and small-scale structures in new detail. FUGIN will provide new data on large structures like the spiral arms—and even the entire Milky Way itself—down to smaller structures like individual molecular cloud cores.

FUGIN is one of the legacy projects for the Nobeyama. These projects are designed to collect fundamental data for next-generation studies. To collect this data, FUGIN observed an area covering 130 square degrees, which is over 80% of the area between galactic latitudes -1 and +1 degrees and galactic longitudes from 10 to 50 degrees and from 198 to 236 degrees. Basically, the map tried to cover the 1st and 3rd quadrants of the galaxy, to capture the spiral arms, bar structure, and the molecular gas ring.

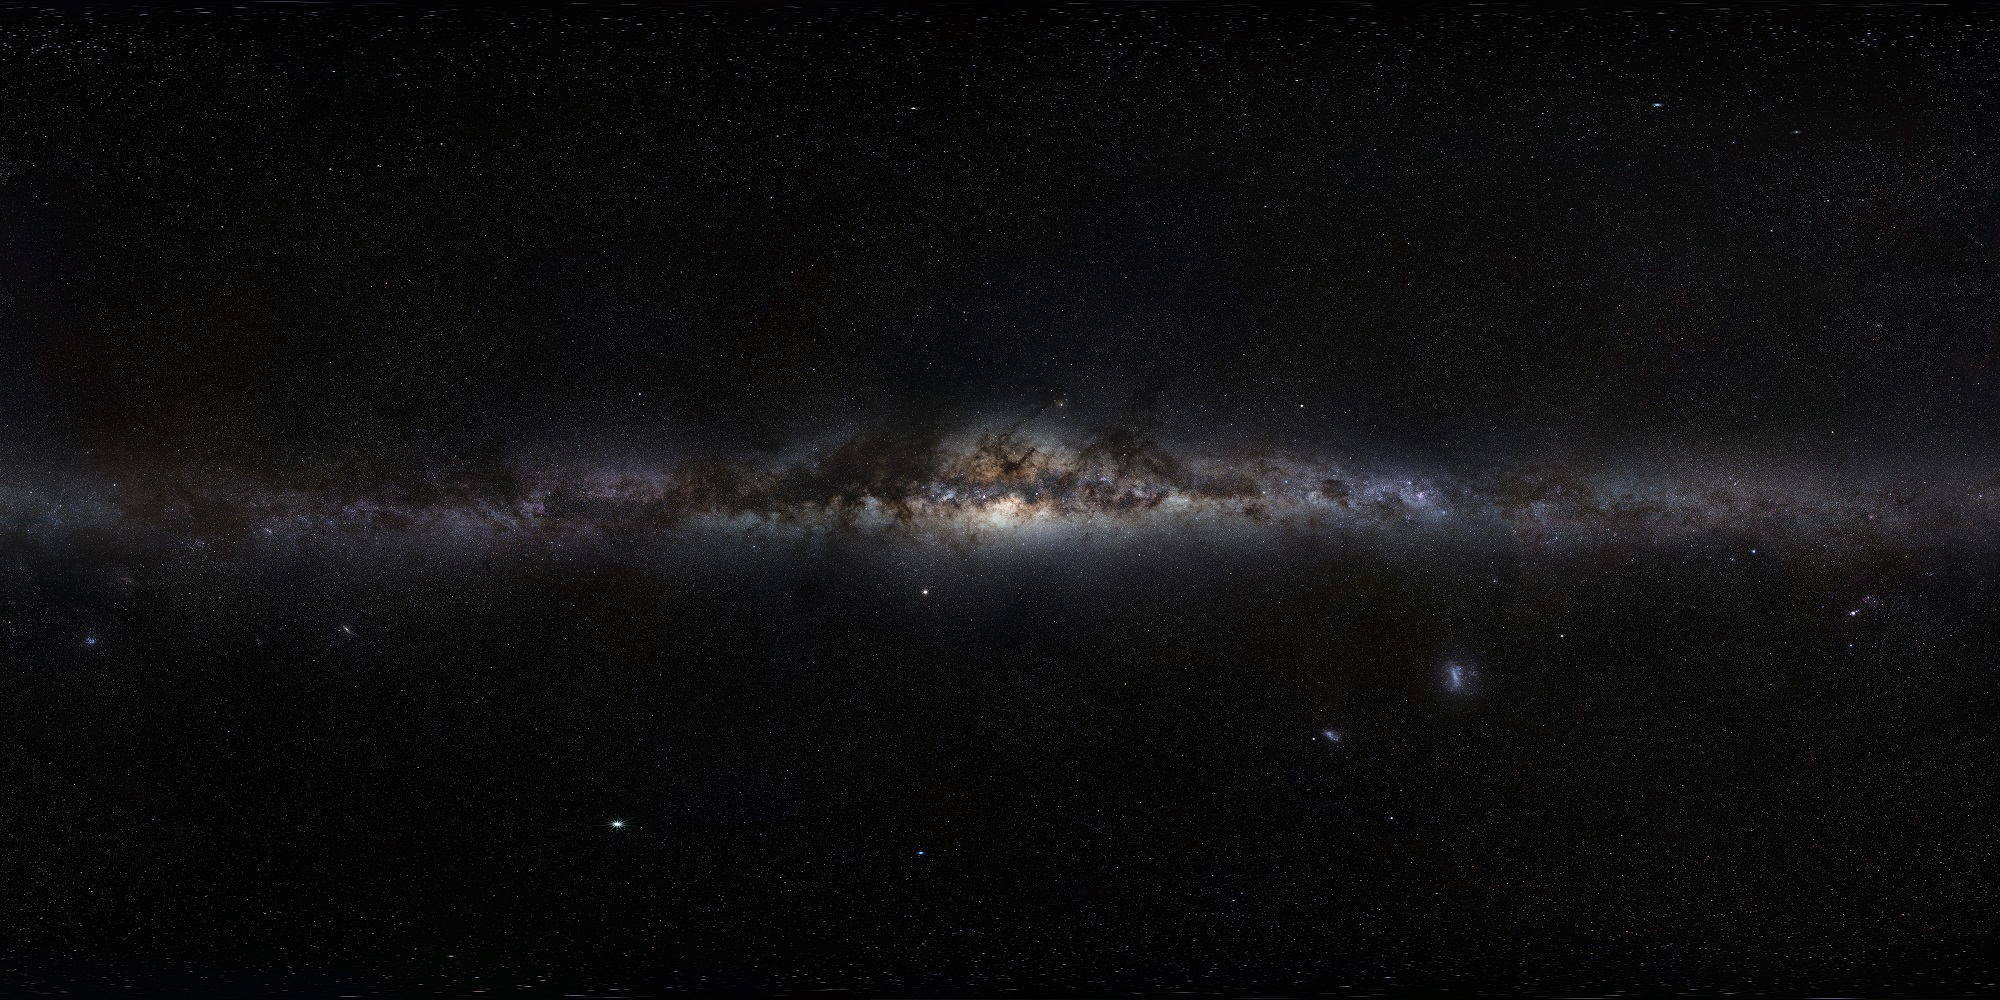
Starscape photograph taken at Nobeyama Radio Observatory by Norikazu Okabe. The FUGIN observation region (l=10-50 deg) is marked. Credit: National Astronomical Observatory of Japan

The aim of FUGIN is to investigate physical properties of diffuse and dense molecular gas in the galaxy. It does this by simultaneously gathering data on three carbon dioxide isotopes: 2CO, 13CO, and 18CO. Researchers were able to study the distribution and the motion of the gas, and also the physical characteristics like temperature and density. And the studying has already paid off.

FUGIN has already revealed things previously hidden. They include entangled filaments that weren’t obvious in previous surveys, as well as both wide-field and detailed structures of molecular clouds. Large scale kinematics of molecular gas such as spiral arms were also observed.

An artist’s image showing the major features of the Milky Way galaxy. Credit: NASA/JPL-Caltech, ESO, J. Hurt

But the main purpose is to provide a rich data-set for future work by other telescopes. These include other radio telescopes like ALMA, but also telescopes operating in the infrared and other wavelengths. This will begin once the FUGIN data is released in June, 2018.

Millimeter wave radio astronomy is powerful because it can “see” things in space that other telescopes can’t. It’s especially useful for studying the large, cold gas clouds where stars form. These clouds are as cold as -262C (-440F.) At temperatures that low, optical scopes can’t see them, unless a bright star is shining behind them.

Even at these extremely low temperatures, there are chemical reactions occurring. This produces molecules like carbon monoxide, which was a focus of the FUGIN project, but also others like formaldehyde, ethyl alcohol, and methyl alcohol. These molecules emit radio waves in the millimeter range, which radio telescopes like the Nobeyama can detect.

The top-level purpose of the FUGIN project, according to the team behind the project, is to “provide crucial information about the transition from atomic gas to molecular gas, formation of molecular clouds and dense gas, interaction between star-forming regions and interstellar gas, and so on. We will also investigate the variation of physical properties and internal structures of molecular clouds in various environments, such as arm/interarm and bar, and evolutionary stage, for example, measured by star-forming activity.”

This new map from the Nobeyama holds a lot of promise. A rich data-set like this will be an important piece of the galactic puzzle for years to come. The details revealed in the map will help astronomers tease out more detail on the structures of gas clouds, how they interact with other structures, and how stars form from these clouds.

Get Set For a “Super Blue Blood Moon Total Lunar Eclipse”

total lunar eclipse
Totality! The "Winter Solstice Total Lunar Eclipse" of December, 2010. Dave Dickinson
total lunar eclipse
Totality! Not a “Super Blue Blood Moon Total Lunar Eclipse,” but the “Winter Solstice Total Lunar Eclipse” of December, 2010. Dave Dickinson

Can you feel the tremor in the Force? Early next Wednesday morning internet astro-memes collide, in one of the big ticket sky events of the year, with a total lunar eclipse dubbed as — get ready — a Super Blue Blood Moon total lunar eclipse.

Specifics on the eclipse: That’s a mouthful, for sure. This is the first eclipse of 2018, and only one of two featuring totality, lunar or solar. Wednesday morning’s eclipse favors the region centered on the Pacific Rim, with regions of Asia and Australia seeing the evening eclipse at moonrise, while most of North America will see totality early Wednesday morning at moonset. Only the regions of the Canadian Maritimes and the United States east of the Mississippi misses out on the spectacle’s climax, catching a partially eclipsed Moon setting in the west at sunrise.

eclipse
The path of the Moon through the Earth’s shadow and the circumstances for the January 31st, super blue blood Moon total lunar eclipse. NASA

2018 features four eclipses overall, two lunar and two solar. Paired with this eclipse is a partial solar eclipse on February 15th favoring the very southern tip of South America, followed by another total lunar eclipse this summer on July 27th. The final eclipse for 2018 is a partial solar eclipse on August 11th, favoring northern Europe and northeastern Asia.

What’s all the fuss about? Let’s dissect the eclipse, meme by meme:

Why it’s Super: Totality for this eclipse lasts 1 hour, 16 minutes and 4 seconds, the longest since April 15th, 2014. Full Moon (and maximum duration for this eclipse) occurs at 13:30 Universal Time (UT), just 27 hours after the Moon reaches perigee the day prior on January 30th at 9:55 UT . Note that this isn’t quite the closest perigee of the year in space and time: the January 1st Full Moon perigee beat it out for that title by 2,429 km (1509 miles) and 23 hours.

super blue blood moon
Worldwide circumstances for Wednesday’s super blue blood moon total lunar eclipse. NASA

Why it’s Blue: This is the second Full Moon of the month, making this month’s Moon “Blue” in the modern sense of the term. This definition comes down to us thanks to a misinterpretation in the July 1943 issue of Sky & Telescope. The Maine Farmer’s Almanac once used an even more convoluted definition of a Blue Moon as “the third Full Moon in an astronomical season with four,” and legend has it, used blue ink in the almanac printing to denote that extra spurious Moon… anyone have any old Maine Farmer’s Almanacs in the attic to verify the tale?

Note that Blue Moons aren’t all that rare… the month of March 2018 also hosts two Full Moons, while truncated February 2018 contains none, sometimes referred to as a “Black Moon”.

Why All the Blood: The cone of the Earth’s umbra or dark inner shadow isn’t completely devoid of light. Instead, you’re seeing sunlight from all the Earth’s sunrises and sunsets around its limb, filtered into the shadow of the the planet onto the nearside of the Moon. Standing on the Earthward facing side of the Moon, you would witness a solar eclipse as the Earth passed between the Moon and the Sun. Unlike the neat near fit for solar eclipses on the Earth, however, solar eclipses on the Moon can last over an hour, as the Earth appears about three times larger than the disk of the Sun. And although astronauts have witnessed eclipses from space, no human has yet stood on the Moon and witnessed the ring of fire surrounding the Earth during a solar eclipse.

Tales of the Saros: For saros buffs, this eclipse is member 49 of 74 lunar eclipses for lunar saros cycle 124, stretching all the way back to August 17th, 1152. If you caught the total lunar eclipse on January 21st, 2000, you saw the last eclipse in this cycle. Stick around until April 18th, 2144 AD and you can watch the final total lunar eclipse for saros 124.

Unlike total solar eclipses, lunar eclipses are leisurely affairs. The entire penumbral phase of the eclipse lasts for over 5 hours, though you probably won’t notice the subtle shading on the limb of the Moon until its about halfway immersed in the Earth’s penumbral shadow.

Not all total lunar eclipses are the same. Depending on how deep the Moon passes through the Earth’s shadow and the murkiness of the Earth’s atmosphere, the Moon can appear anywhere from a sickly orange, to a deep brick red during totality… for example, the Moon almost disappeared entirely during a total lunar eclipse shortly after the eruption of Mount Pinatubo in the early 1990s!

The color of the Moon during totality is known as its Danjon Number, with 4 being bright with a bluish cast on the outer limb of the Moon, and 0 appearing dark and deep red.

This is also one of the only times you can see that the Earth is indeed round with your own eyes as the curve of the shadow cast by our homeworld falls back across the Moon. This curve is the same, regardless of the angle, and whether the Moon is high above near the zenith, or close to the horizon.

Don’t miss the first eclipse of 2018 and the (deep breath) super blue blood Moon total lunar eclipse!

-Clouded out, or on the wrong side of the planet? Watch the January 31st eclipse live courtesy of the Virtual Telescope Project.

The New Earth-Sized Planet Hunting Telescope ExTrA is Now Online

The ExTrA telescopes are sited at ESO’s La Silla Observatory in Chile. They will be used to search for and study Earth-sized planets orbiting nearby red dwarf stars. Credit: ESO/Emmanuela Rimbaud

Ever since the Kepler space telescope began discovering thousands of exoplanets in our galaxy, astronomers have been eagerly awaiting the day when next-generation missions are deployed. These include the much-anticipated James Webb Space Telescope, which is scheduled to take to space in 2019, but also the many ground-based observatories that are currently being constructed.

One of these is the Exoplanets in Transits and their Atmospheres (ExTrA) project, which is the latest addition to the ESO’s La Silla Observatory in Chile. Using the Transit Method, this facility will rely on three 60-centimeter (23.6 in) telescopes to search for Earth-sized exoplanets around M-type (red dwarf) stars in the Milky Way Galaxy. This week, the facility began by collecting its first light.

The Transit Method (aka. Transit Photometry) consists of monitoring stars for periodic dips in brightness. These dips are caused by planets passing in front of the star (aka. transiting) relative to the observer. In the past, detecting planets around M-type stars using this method has been challenging since red dwarfs are the smallest and dimmest class of star in the known Universe and emit the majority of their light in the near-infrared band.

Artist’s impression of rocky exoplanets orbiting Gliese 832, a red dwarf star just 16 light-years from Earth. Credit: ESO/M. Kornmesser/N. Risinger (skysurvey.org).

However, these stars have also proven to be treasure trove when it comes to rocky, Earth-like exoplanets. In recent years, rocky planets have been discovered around star’s like Proxima Centauri and Ross 128, while TRAPPIST-1 had a system of seven rocky planets. In addition, there have been studies that have indicated that potentially-habitable, rocky planets could be very common around red dwarf stars.

Unlike other facilities, the ExTrA project is well-suited to conduct surveys for planets around red dwrfs because of its location on the outskirts of the Atacama Desert in Chile. As Xavier Bonfils, the project’s lead researcher, explained:

La Silla was selected as the home of the telescopes because of the site’s excellent atmospheric conditions. The kind of light we are observing – near-infrared – is very easily absorbed by Earth’s atmosphere, so we required the driest and darkest conditions possible. La Silla is a perfect match to our specifications.

In addition, the ExTrA facility will rely on a novel approach that involves combining optical photometry with spectroscopic information. This consists of its three telescopes collecting light from a target star and four companion stars for comparison. This light is then fed through optical fibers into a multi-object spectrograph in order to analyze it in many different wavelengths.

The ExTrA telescopes are sited at ESO’s La Silla Observatory in Chile. Credit: ESO/Petr Horálek

This approach increases the level of achievable precision and helps mitigate the disruptive effect of Earth’s atmosphere, as well as the potential for error introduced by instruments and detectors. Beyond the goal of simply finding planets transiting in front of their red dwarf stars, the ExTrA telescopes will also study the planets it finds in order to determine their compositions and their atmospheres.

In short, it will help determine whether or not these planets could truly be habitable. As Jose-Manuel Almenara, a member of the ExTrA team, explained:

With ExTrA, we can also address some fundamental questions about planets in our galaxy. We hope to explore how common these planets are, the behaviour of multi-planet systems, and the sorts of environments that lead to their formation,

The potential to search for extra-solar planets around red dwarf stars is an immense opportunity for astronomers. Not only are they the most common star in the Universe, accounting for 70% of stars in our galaxy alone, they are also very long-lived. Whereas stars like our Sun have a lifespan of about 10 billion years, red dwarfs are capable of remaining in their main sequence phase for up to 10 trillion years.

Artist’s impression of Proxima b, which was discovered using the Radial Velocity method. Credit: ESO/M. Kornmesser

For these reasons, there are those who think that M-type stars are our best bet for finding habitable planets in the long run. At the same time, there are unresolved questions about whether or not planets that orbit red dwarf stars can stay habitable for long, owing to their variability and tendency to flare up. But with ExTrA and other next-generation instruments entering into service, astronomers may be able to address these burning questions.

As Bonfils excitedly put it:

With the next generation of telescopes, such as ESO’s Extremely Large Telescope, we may be able to study the atmospheres of exoplanets found by ExTra to try to assess the viability of these worlds to support life as we know it. The study of exoplanets is bringing what was once science fiction into the world of science fact.

ExTrA is a French project funded by the European Research Council and the French Agence National de la Recherche and its telescopes will be operated remotely from Grenoble, France. Also, be sure to enjoy this video of the ExTrA going online, courtesy of the ESOcast:

Further Reading: ESO

Where’s the Line Between Massive Planet and Brown Dwarf Star?

This artist's conception illustrates the brown dwarf named 2MASSJ22282889-431026, observed by NASA's Hubble and Spitzer space telescopes. Brown dwarfs are more massive and hotter than planets but lack the mass required to become stars. Image credit: NASA

When is a Brown Dwarf star not a star at all, but only a mere Gas Giant? And when is a Gas Giant not a planet, but a celestial object more akin to a Brown Dwarf? These questions have bugged astronomers for years, and they go to the heart of a new definition for the large celestial bodies that populate solar systems.

An astronomer at Johns Hopkins University thinks he has a better way of classifying these objects, and it’s not based only on mass, but on the company the objects keep, and how the objects formed. In a paper published in the Astrophysical Journal, Kevin Schlaufman made his case for a new system of classification that could helps us all get past some of the arguments about which object is a gas giant planet or a brown dwarf. Mass is the easy-to-understand part of this new definition, but it’s not the only factor. How the object formed is also key.

In general, the less massive a star, the cooler it is. Though stars smaller than our Sun can still sustain heat-producing fusion reactions, protostars that are too small cannot. These “failed” stars are commonly known as brown dwarfs, and a new definition puts their range from between 10-75 times the mass of Jupiter. This artist’s concept compares the size of a brown dwarf to that of Earth, Jupiter, a low-mass star, and the Sun. (Credit: NASA/JPL-Caltech/UCB).

Schlaufman is an assistant professor in the Johns Hopkins Department of Physics and Astronomy. He has set a limit for what we should call a planet, and that limit is between 4 and 10 times the mass of our Solar System’s biggest planet, Jupiter. Above that, you’ve got yourself a Brown Dwarf star. (Brown Dwarfs are also called sub-stellar objects, or failed stars, because they never grew massive enough to become stars.)

“An upper boundary on the masses of planets is one of the most prominent details that was missing.” – Kevin Schlaufman, Johns Hopkins University, Dept. of Physics and Astronomy.

Improvements in observing other solar systems have led to this new definition. Where previously we only had our own Solar System as reference, we now can observe other solar systems with increasing effectiveness. Schlaufman observed 146 solar systems, and that allowed him to fill in some of the blanks in our understanding of brown dwarf and planet formation.

An image of Jupiter showing its storm systems. According to a new definition, Jupiter would be considered a brown dwarf if it had grown to over 10 times its mass when it was formed. Image: Gemini

“While we think we know how planets form in a big picture sense, there’s still a lot of detail we need to fill in,” Schlaufman said. “An upper boundary on the masses of planets is one of the most prominent details that was missing.”

Let’s back up a bit and look at how Brown Dwarfs and Gas Giants are related.

Solar systems are formed from clouds of gas and dust. In the early days of a solar system, one or more stars are formed out of this cloud by gravitational collapse. They ignite with fusion and become the stars we see everywhere in the Universe. The leftover gas and dust forms into planets, or brown dwarfs. This is a simplified version of solar system formation, but it serves our purposes.

In our own Solar System, only a single star formed: the Sun. The gas giants Jupiter and Saturn gobbled up most of the rest of the material. Jupiter gobbled up the lion’s share, making it the largest planet. But what if conditions had been different and Jupiter had kept growing? According to Schlaufman, if it had kept growing to over 10 times the size it is now, it would have become a brown dwarf. But that’s not where the new definition ends.

Metallicity and Chemical Makeup

Mass is only part of it. What’s really behind his new classification is the way in which the object formed. This involves the concept of metallicity in stars.

Stars have a metallicity content. In astrophysics, this means the fraction of a star’s mass that is not hydrogen or helium. So any element from lithium on down is considered a metal. These metals are what rocky planets form from. The early Universe had only hydrogen and helium, and almost insignificant amounts of the next two elements, lithium and beryllium. So the first stars had no metallicity, or almost none.

This is an image of M80, an ancient globular cluster of stars. Since these stars formed in the early universe, their metallicity content is very low. This means that gas giants like Jupiter would be rare or non-existent here, while brown dwarfs are likely plentiful. Image: By NASA, The Hubble Heritage Team, STScI, AURA - Great Images in NASA Description, Public Domain, https://commons.wikimedia.org/w/index.php?curid=6449278
This is an image of M80, an ancient globular cluster of stars. Since these stars formed in the early universe, their metallicity content is very low. This means that gas giants like Jupiter would be rare or non-existent here, while brown dwarfs are likely plentiful. Image: By NASA, The Hubble Heritage Team, STScI, AURA – Great Images in NASA Description, Public Domain, https://commons.wikimedia.org/w/index.php?curid=6449278

But now, 13.5 billion years after the Big Bang, younger stars like our Sun have more metal in them. That’s because generations of stars have lived and died, and created the metals taken up in subsequent star formation. Our own Sun was formed about 5 billion years ago, and it has the metallicity we expect from a star with its birthdate. It’s still overwhelmingly made of hydrogen and helium, but about 2% of its mass is made of other elements, mostly oxygen, carbon, neon, and iron.

This is where Schlaufman’s study comes in. According to him, we can distinguish between gas giants like Jupiter, and brown dwarfs, by the nature of the star they orbit. The types of planets that form around stars mirror the metallicity of the star itself. Gas giants like Jupiter are usually found orbiting stars with metallicity equal to or greater than our Sun. But brown dwarfs aren’t picky; they form around almost any star. Why?

Brown Dwarfs and Planets Form Differently

Planets like Jupiter are formed by accretion. A rocky core forms, then gas collects around it. Once the process is done, you have a gas giant. For this to happen, you need metals. If metals are present for these rocky cores to form, their presence will be reflected in the metallicity of the host star.

But brown dwarfs aren’t formed by accretion like planets are. They’re formed the same way stars are; by gravitational collapse. They don’t form from an initial rocky core, so metallicity isn’t a factor.

This brings us back to Kevin Schlaufman’s study. He wanted to find out the mass at which point an object doesn’t care about the metallicity of the star they orbit. He concluded that objects above 10 times the mass of Jupiter don’t care if the star has rocky elements, because they don’t form from rocky cores. Hence, they’re not planets akin to Jupiter; they’re brown dwarfs that formed by gravitational collapse.

What Does It Matter What We Call Them?

Let’s look at the Pluto controversy to understand why names are important.

The struggle to accurately classify all the objects we see out there in space is ongoing. Who can forget the plight of poor Pluto? In 2006, the International Astronomical Union (IAU) demoted Pluto, and stripped it of its long-standing status as a planet. Why?

Because the new definition of what a planet is relied on these three criteria:

  • a planet is in orbit around a star.
  • a planet must have sufficient mass to assume a hydrostatic equilibrium (a nearly round shape.)
  • a planet has cleared the neighbourhood around its orbit

The more we looked at Pluto with better telescopes, the more we realized that it did not meet the third criteria, so it was demoted to Dwarf Planet. Sorry Pluto.

Pluto was re-classified as a dwarf planet based on our growing understanding of its nature. Will Schlaufman's new study help us more accurately classify gas giants and brown dwarfs? NASA's New Horizons spacecraft captured this high-resolution enhanced color view of Pluto on July 14, 2015. Credit: NASA/JHUAPL/SwRI
Pluto was re-classified as a dwarf planet based on our growing understanding of its nature. Will Schlaufman’s new study help us more accurately classify gas giants and brown dwarfs? NASA’s New Horizons spacecraft captured this high-resolution enhanced color view of Pluto on July 14, 2015. Credit: NASA/JHUAPL/SwRI

Our naming conventions for astronomical objects are important, because they help people understand how everything fits together. But sometimes the debate over names can get tiresome. (The Pluto debate is starting to wear out its welcome, which is why some suggest we just call them all “worlds.”)

Though the Pluto debate is getting tiresome, it’s still important. We need some way of understanding what makes objects different, and names that reflect that difference. And the names have to reflect something fundamental about the objects in question. Should Pluto really be considered the same type of object as Jupiter? Are both really planets in the same sense? The IAU says no.

The same principle holds true with brown dwarfs and gas giants. Giving them names based solely on their mass doesn’t really tell us much. Schlaufman aims to change that.

His new definition makes sense because it relies on how and where these objects form, not simply their size. But not everyone will agree, of course.

Let the debate begin.

This is the Surface of a Giant Star, 350 Times Larger Than the Sun

This artist’s impression shows the red supergiant star. Using ESO’s Very Large Telescope Interferometer, an international team of astronomers have constructed the most detailed image ever of this, or any star other than the Sun. Credit: ESO/M. Kornmesser

When it comes to looking beyond our Solar System, astronomers are often forced to theorize about what they don’t know based on what they do. In short, they have to rely on what we have learned studying the Sun and the planets from our own Solar System in order to make educated guesses about how other star systems and their respective bodies formed and evolved.

For example, astronomers have learned much from our Sun about how convection plays a major role in the life of stars. Until now, they have not been able to conduct detailed studies of the surfaces of other stars because of their distances and obscuring factors. However, in a historic first, an international team of scientists recently created the first detailed images of the surface of a red giant star located roughly 530 light-years away.

The study recently appeared in the scientific journal Nature under the title “Large Granulation cells on the surface of the giant star Π¹ Gruis“. The study was led by Claudia Paladini of the Université libre de Bruxelles and included members from the European Southern Observatory, the Université de Nice Sophia-Antipolis, Georgia State University, the Université Grenoble Alpes, Uppsala University, the University of Vienna, and the University of Exeter.

The surface of the red giant star Π¹ Gruis from PIONIER on the VLT. Credit: ESO

For the sake of their study, the team used the Precision Integrated-Optics Near-infrared Imaging ExpeRiment (PIONIER) instrument on the ESO’s Very Large Telescope Interferometer (VLTI) to observe the star known as Π¹ Gruis. Located 530 light-years from Earth in the constellation of Grus (The Crane), Π1 Gruis is a cool red giant. While it is the same mass as our Sun, it is 350 times larger and several thousand times as bright.

For decades, astronomers have sought to learn more about the convection properties and evolution of stars by studying red giants. These are what become of main sequence stars once they have exhausted their hydrogen fuel and expand to becomes hundreds of times their normal diameter. Unfortunately, studying the convection properties of most supergiant stars has been challenging because their surfaces are frequently obscured by dust.

After obtaining interferometric data on Π1 Gruis in September of 2014, the team then relied on image reconstruction software and algorithms to compose images of the star’s surface. These allowed the team to determine the convection patterns of the star by picking out its “granules”, the large grainy spots on the surface that indicate the top of a convective cell.

This was the first time that such images have been created, and represent a major breakthrough when it comes to our understanding of how stars age and evolve. As Dr. Fabien Baron, an assistant professor at Georgia State University and a co-author on the study, explained:

“This is the first time that we have such a giant star that is unambiguously imaged with that level of details. The reason is there’s a limit to the details we can see based on the size of the telescope used for the observations. For this paper, we used an interferometer. The light from several telescopes is combined to overcome the limit of each telescope, thus achieving a resolution equivalent to that of a much larger telescope.”

Earth scorched by red giant Sun
Artist’s impression of the Earth scorched by our Sun as it enters its Red Giant Branch phase. Credit: Wikimedia Commons/Fsgregs

This study is especially significant because Π1 Gruis in the last major phase of life and resembles what our Sun will look like when it is at the end of its lifespan. In other words, when our Sun exhausts its hydrogen fuel in roughly five billion years, it will expand significantly to become a red giant star. At this point, it will be large enough to encompass Mercury, Venus, and maybe even Earth.

As a result, studying this star will give scientists insight into the future activity, characteristics and appearance of our Sun. For instance, our Sun has about two million convective cells that typically measure 2,000 km (1243 mi) in diameter. Based on their study, the team estimates that the surface of Π1 Gruis has a complex convective pattern, with granules measuring about 1.2 x 10^8 km (62,137,119 mi) horizontally or 27 percent of the diameter of the star.

This is consistent with what astronomers have predicted, which was that giant and supergiant stars should only have a few large convective cells because of their low surface gravity. As Baron indicated:

“These images are important because the size and number of granules on the surface actually fit very well with models that predict what we should be seeing. That tells us that our models of stars are not far from reality. We’re probably on the right track to understand these kinds of stars.”

An illustration of the structure of the Sun and a red giant star, showing their convective zones. These are the granular zones in the outer layers of the stars. Credit: ESO

The detailed map also indicated differences in surface temperature, which were apparent from the different colors on the star’s surface. This are also consistent with what we know about stars, where temperature variations are indicative of processes that are taking place inside. As temperatures rise and fall, the hotter, more fluid areas become brighter (appearing white) while the cooler, denser areas become darker (red).

Looking ahead, Paladini and her team want to create even more detailed images of the surface of giant stars. The main aim of this is to be able to follow the evolution of these granules continuously, rather than merely getting snapshots of different points in time.

From these and similar studies, we are not only likely to learn more about the formation and evolution of different types of stars in our Universe; we’re also sure to get a better understanding of what our Solar System is in for.


Further Reading: Georgia State University, ESO, Nature

Upcoming Telescopes Should be Able to Detect Mountains and Other Landscapes on Extrasolar Planets

Using the microlensing metthod, a team of astrophysicists have found the first extra-galactic planets! Credit: NASA/Tim Pyle

The study of exoplanets has advanced by leaps and bounds in the past few decades. Between ground-based observatories and spacecraft like the Kepler mission, a total of 3,726 exoplanets have been confirmed in 2,792 systems, with 622 systems having more than one planet (as of Jan. 1st, 2018). And in the coming years, scientists expect that many more discoveries will be possible thanks to the deployment of next-generation missions.

These include NASA’s James Webb Space Telescope (JWST) and several next-generation ground based observatories. With their advanced instruments, these and other observatories are not only expected to find many more exoplanets, but to reveal new and fascinating things about them. For instance, a recent study from Columbia University indicated that it will be possible, using the Transit Method, to study surface elevations on exoplanets.

The study, which recently appeared online under the title “Finding Mountains with Molehills: The Detectability of Exotopography“, was conducted by Moiya McTier and David Kipping – and graduate student and an Assistant Professor of Astronomy at Columbia University, respectively. Based on models they created using bodies in our Solar System, the team considered whether transit surveys might be able to reveal topographical data on exoplanets.

Artist’s impression of an extra-solar planet transiting its star. Credit: QUB Astrophysics Research Center

To recap, the Transit Method (aka. Transit Photometry) is currently the most popular and reliable means for detecting exoplanets. It consists of astronomers measuring the light curve of distant stars over time and looking for periodic dips in brightness. These dips are the result of exoplanets passing in front of the star (i.e. transiting) relative to the observer.

By measuring the rate at which the star’s light dips, and the period with which the dimming occurs, astronomer are not only able to determine the presence of exoplanets, but also place accurate constraints on their size and orbital periods. According to McTier and Kipping, this same method could also reveal the presence of geographical features – for instance, mountain ranges, volcanoes, trenches, and craters.

As they indicate in their study, in lieu of direct imaging, indirect methods are the only means astronomers have for revealing data on an exoplanet’s surface. Unfortunately, there is no conceivable way that the radial velocity, microlensing, astrometry, and timing methods could reveal exotopography. This leaves the transit method, which has some potential in this respect. As they state:

“The transit method directly measures the sky-projected area of a planet’s silhouette relative to that of a star, under the assumption that the planet is not luminous itself… This fact implies that there is indeed some potential for transits to reveal surface features, since the planet’s silhouette is certainly distorted from a circular profile due to the presence of topography.”

Satellite image of the Himalayan mountain chain, as imaged by NASA’sLandsat-7 imagery of Himalayas. Credit: NASA

In other words, as a planet transits in front of its host star, the light passing around the planet itself could be measured for small variations. These could indicate the presence of mountain ranges and other large-scale features like massive chasms. To test this theory, they considered planets in the Solar System as templates for how the scattering of light during a transit could reveal large-scale features.

As an example, they consider what an Earth analog planet would reveal if the Himalayan mountain range ran from north to south and was wide enough to span 1° in longitude:

“Now assume that the planet completes half of one rotation as it transits its parent star from our point of view, which is all that is necessary to see all of the planet’s features appear on its silhouette without repeating. As our hypothetical planet rotates and the Himalayan block moves into and out of view, the change in silhouette will result in different transit depths…”

Ultimately, they consider that Mars would be the ideal test case due to its combination of small size, low surface gravity, and active internal volcanism, which has caused it become what they describe as the “bumpiest body in the Solar System”. When paired with a white dwarf star, this presents the optimal case for using light curves to determine exotopography.

Color Mosaic of Olympus Mons on Mars
Color mosaic of Mars’ greatest mountain, Olympus Mons, viewed from orbit. Credit NASA/JPL

At a distance of about 0.01 AU (which would be within a white dwarf’s habitable zone), they calculate that a Mars-sized planet would have an orbital period of 11.3 hours. This would allow for many transits to be observed in a relatively short viewing period, thus ensuring a greater degree of accuracy. At the same time, the team admits that their proposed methods suffers from drawbacks.

For instance, due to the presence of astrophysical and instrumental noise, they determined that their method would be unproductive when it comes to studying exoplanets around Sun-like stars and M-type (red dwarf) stars. But for Mars-like planets orbiting low mass, white dwarf stars, the method could produce some highly valuable scientific returns.

While this might sound rather limited, it would present some rather fascinating opportunities to learn more about planets beyond our Solar System. As they explain:

“Finding the first evidence of mountains on planets outside our solar system would be exciting in its own right, but we can also infer planet characteristics from the presence and distribution of surface features. For example, a detection of bumpiness could lead to constraints on a planet’s internal processes.”

In short, planets with a high degree of bumpiness would indicate tectonic activity or the buildup of lava caused by internal heating sources. Those with the highest bumpiness (i.e. like Mars) would indicate that they too experience a combination internal processes, low surface gravity, volcanism, and a lack of tectonic plate movement. Meanwhile, low-bumpiness planets are less likely to have any of these internal processes and their surfaces are more likely to be shaped by external factors – like asteroid bombardment.

Artist’s impression of the OWL Telescope being deployed at night from its enclosure, where it will operated during the daytime. Credit: ESO

Based on their estimates, they conclude that the various super telescopes that are scheduled to be commissioned in the coming years would be up to task. These include the ESO’s OverWhelmingly Large (OWL) Telescope, a 100-meter proposed optical and near-infrared telescope that would build on the success of the Very Large Telescope (VLT) and the upcoming Extremely Large Telescope (ELT).

Another example is the Colossus Telescope, a 74-meter optical and infrared telescope that is currently being commissioned by an international consortium. Once operational, it will be the largest telescope optimized for detecting extrasolar life and extraterrestrial civilizations.

In the past, the success of exoplanet hunters has come down to a combination of factors. In addition to greater levels of cooperation between institutions, amateur astronomers and citizen scientists, there has also been the way in which improved technology has coincided with new theoretical models. As more data become available, scientists are able to produce more educated estimates on what we might be able to learn once new instruments come online.

When the next-generation telescopes take to space or are finished construction here on Earth, we can anticipate that thousands more exoplanets will be found. At the same time, we can anticipate that important details will be also discovered about these planets that were not possible before. Do they have atmospheres? Do they have oceans? Do they have mountain ranges and chasms? We hope to find out!

Further Reading: arXiv
Here’s Something Strange, the Afterglow From Last Year’s Kilonova is Continuing to Brighten

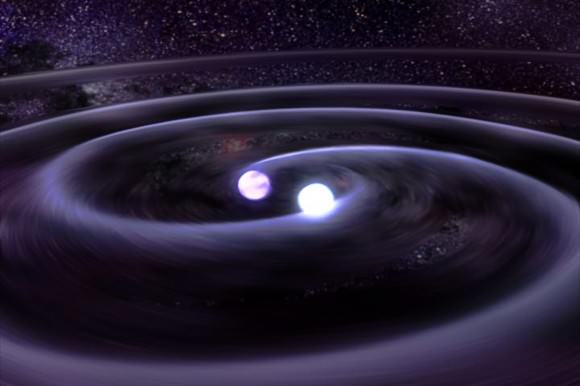
Artist's illustration of two merging neutron stars. The narrow beams represent the gamma-ray burst while the rippling spacetime grid indicates the isotropic gravitational waves that characterize the merger. Swirling clouds of material ejected from the merging stars are a possible source of the light that was seen at lower energies. Credit: National Science Foundation/LIGO/Sonoma State University/A. Simonnet

In August of 2017, a major breakthrough occurred when scientists at the Laser Interferometer Gravitational-Wave Observatory (LIGO) detected gravitational waves that were believed to be caused by the collision of two neutron stars. This source, known as GW170817/GRB, was the first gravitational wave (GW) event that was not caused by the merger of two black holes, and was even believed to have led to the formation of one.

As such, scientists from all over the world have been studying this event ever since to learn what they can from it. For example, according to a new study led by the McGill Space Institute and Department of Physics, GW170817/GRB has shown some rather strange behavior since the two neutron stars colliding last August. Instead of dimming, as was expected, it has been gradually growing brighter.

The study that describes the team’s findings, titled “Brightening X-Ray Emission from GW170817/GRB 170817A: Further Evidence for an Outflow“, recently appeared in The Astrophysical Journal Letters. The study was led by John Ruan of McGill University’s Space Institute and included members from the Canadian Institute for Advanced Research (CIFAR), Northwestern University, and the Leicester Institute for Space and Earth Observation.

Chandra images showing the X-ray afterglow of the GW170817/GRB event. Credit: NASA/CXC/McGill University/J. Ruan et al.

For the sake of their study, the team relied on data obtained by NASA’s Chandra X-ray Observatory, which showed that the remnant has been brightening in the X-ray and radio wavelengths in the months since the collision took place. As Daryl Haggard, an astrophysicist with McGill University whose research group led the new study, said in a recent Chandra press release:

“Usually when we see a short gamma-ray burst, the jet emission generated gets bright for a short time as it smashes into the surrounding medium – then fades as the system stops injecting energy into the outflow. This one is different; it’s definitely not a simple, plain-Jane narrow jet.”

What’s more, these X-ray observations are consistent with radiowave data reported last month by another team of scientists, who also indicated that it was continuing to brighten during the three months since the collision. During this same period, X-ray and optical observatories were unable to monitor GW170817/GRB because it was too close to the Sun at the time.

However, once this period ended, Chandra was able to gather data again, which was consistent with these other observations. As John Ruan explained:

“When the source emerged from that blind spot in the sky in early December, our Chandra team jumped at the chance to see what was going on. Sure enough, the afterglow turned out to be brighter in the X-ray wavelengths, just as it was in the radio.”

Collisions of neutron stars produce powerful gamma-ray bursts – and heavy elements like gold (Credit: Dana Berry, SkyWorks Digital, Inc.)

This unexpected behavior has led to a serious buzz in the scientific community, with astronomers trying to come up with explanations as to what type of physics could be driving these emissions. One theory is a complex model for neutron star mergers known as “cocoon theory”. In accordance with this theory, the merger of two neutron stars could trigger the release of a jet that shock-heats the surrounding gaseous debris.

This hot “cocoon” around the jet would glow brightly, which would explain the increase in X-ray and radiowave emissions. In the coming months, additional observations are sure to be made for the sake of confirming or denying this explanation. Regardless of whether or not the “cocoon theory” holds up, any and all future studies are sure to reveal a great deal more about this mysterious remnant and its strange behavior.

As Melania Nynka, another McGill postdoctoral researcher and a co-author on the paper indicated, GW170817/GRB presents some truly unique opportunities for astrophysical research. “This neutron-star merger is unlike anything we’ve seen before,” she said. “For astrophysicists, it’s a gift that seems to keep on giving.”

It is no exaggeration to say that the first-ever detection of gravitational waves, which took place in February of 2016, has led to a new era in astronomy. But the detection of two neutron stars colliding was also a revolutionary accomplishment. For the first time, astronomers were able to observe such an event in both light waves and gravitational waves.

In the end, the combination of improved technology, improved methodology, and closer cooperation between institutions and observatories is allowing scientists to study cosmic phenomena that was once merely theoretical. Looking ahead, the possibilities seem almost limitless!

Further Reading: Chandra X-Ray Observatory, The Astrophysical Journal Letters

A Black Hole is Pushing the Stars Around in this Globular Cluster

Artist's impression of the star cluster NGC 3201 orbiting an black hole with about four times the mass of the Sun. Credit: ESO/L. Calçada

Astronomers have been fascinated with globular clusters ever since they were first observed in 17th century. These spherical collections of stars are among the oldest known stellar systems in the Universe, dating back to the early Universe when galaxies were just beginning to grow and evolve. Such clusters orbit the centers of most galaxies, with over 150 known to belong to the Milky Way alone.

One of these clusters is known as NGC 3201, a cluster located about 16,300 light years away in the southern constellation of Vela. Using the ESO’s Very Large Telescope (VLT) at the Paranal Observatory in Chile, a team of astronomers recently studied this cluster and noticed something very interesting. According to the study they released, this cluster appears to have a black hole embedded in it.

The study appeared in the Monthly Notices of the Royal Astronomical Society under the title “A detached stellar-mass black hole candidate in the globular cluster NGC 3201“. The study was led by Benjamin Giesers of the Georg-August-University of Göttingen and included members from Liverpool John Moores University, Queen Mary University of London, the Leiden Observatory, the Institute of Astrophysics and Space Sciences, ETH Zurich, and the Leibniz Institute for Astrophysics Potsdam (AIP).

For the sake of their study, the team relied on the Multi Unit Spectroscopic Explorer (MUSE) instrument on the VLT to observe NGC 3201. This instrument is unique because of the way it allows astronomers to measure the motions of thousands of far away stars simultaneously. In the course of their observations, the team found that one of the cluster’s stars was being flung around at speeds of several hundred kilometers an hour and with a period of 167 days.

As Giesers explained in an ESO press release:

It was orbiting something that was completely invisible, which had a mass more than four times the Sun — this could only be a black hole! The first one found in a globular cluster by directly observing its gravitational pull.

This finding was rather unexpected, and constitutes the first time that astronomers have been able to detect an inactive black hole at the heart of a globular cluster – meaning that it is not currently accreting matter or surrounded by a glowing disc of gas. They were also able to estimate the black hole’s mass by measuring the movements of the star around it and thus extrapolating its enormous gravitational pull.

From its observed properties, the team determined that the rapidly-moving star is about 0.8 times the mass of our Sun and the mass of its black hole counterpart to be around 4.36 times the Sun’s mass. This put’s it in the “stellar-mass black hole” category, which are stars that exceeds the maximum mass allowance of a neutron star, but are smaller than supermassive black holes (SMBHs) – which exist at the centers of most galaxies.

This finding is highly significant, and not just because it was the first time that astronomers have observed a stellar-mass black hole in a globular cluster. In addition, it confirms what scientists have been suspecting for a few years now, thanks to recent radio and x-ray studies of globular clusters and the detection of gravity wave signals. Basically, it indicates that black holes are more common in globular clusters than previously thought.

“Until recently, it was assumed that almost all black holes would disappear from globular clusters after a short time and that systems like this should not even exist!” said Giesers. “But clearly this is not the case – our discovery is the first direct detection of the gravitational effects of a stellar-mass black hole in a globular cluster. This finding helps in understanding the formation of globular clusters and the evolution of black holes and binary systems – vital in the context of understanding gravitational wave sources.”

This find was also significant given that the relationship between black holes and globular clusters remains a mysterious, but highly important one. Due to their high masses, compact volumes, and great ages, astronomers believe that clusters have produced a large number of stellar-mass black holes over the course of the Universe’s history. This discovery could therefore tell us much about the formation of globular clusters, black holes, and the origins of gravitational wave events.

And be sure to enjoy this ESO podcast explaining the recent discovery:

Further Reading: ESO, MNRAS

Just Like Earth, Titan Has a “Sea Level” for its Lakes and Seas

Ligeia Mare, shown in here in data obtained by NASA's Cassini spacecraft, is the second largest known body of liquid on Saturn's moon Titan. It is filled with liquid hydrocarbons, such as ethane and methane, and is one of the many seas and lakes that bejewel Titan's north polar region. Credit: NASA/JPL-Caltech/ASI/Cornell

Thanks to the Cassini mission, we have learned some truly amazing things about Saturn and its largest moon, Titan. This includes information on its dense atmosphere, its geological features, its methane lakes, methane cycle, and organic chemistry. And even though Cassini recently ended its mission by crashing into Saturn’s atmosphere, scientists are still pouring over all of the data it obtained during its 13 years in the Saturn system.

And now, using Cassini data, two teams led by researchers from Cornell University have released two new studies that reveal even more interesting things about Titan. In one, the team created a complete topographic map of Titan using Cassini’s entire data set. In the second, the team revealed that Titan’s seas have a common elevation, much like how we have a “sea level” here on Earth.

The two studies recently appeared in the Geophysical Research Letters, titled “Titan’s Topography and Shape at the End of the Cassini Mission” and “Topographic Constraints on the Evolution and Connectivity of Titan’s Lacustrine Basins“. The studies were led by Professor Paul Corlies and Assistant Professor Alex Hayes of Cornell University, respectively, and included members from The Johns Hopkins University Applied Physics Laboratory, NASA’s Jet Propulsion Laboratory, the US Geological Survey (USGS), Stanford University, and the Sapienza Universita di Roma.

This true-color image of Titan, taken by the Cassini spacecraft, shows the moon's thick, hazy atmosphere. Image: By NASA - http://photojournal.jpl.nasa.gov/catalog/PIA14602, Public Domain, https://commons.wikimedia.org/w/index.php?curid=44822294
This true-color image of Titan, taken by the Cassini spacecraft, shows the moon’s thick, hazy atmosphere. Credit: NASA

In the first paper, the authors described how topographic data from multiple sources was combined to create a global map of Titan. Since only about 9% of Titan was observed with high-resolution topography (and 25-30% in lower resolution) the remainder of the moon was mapped with an interpolation algorithm. Combined with a global minimization process, this reduced errors that would arise from such things as spacecraft location.

The map revealed new features on Titan, as well as a global view of the highs and lows of the moon’s topography. For instance, the maps showed several new mountains which reach a maximum elevation of 700 meters (about 3000 ft). Using the map, scientists were also able to confirm that two locations in the equatorial regions are depressions that could be the result of ancient seas that have since dried up or cryovolcanic flows.

The map also suggests that Titan may be more oblate than previously thought, which could mean that the crust varies in thickness. The data set is available online, and the map which the team created from it is already proving its worth to the scientific community. As Professor Corlies explained in a Cornell press release:

“The main point of the work was to create a map for use by the scientific community… We’re measuring the elevation of a liquid surface on another body 10 astronomical units away from the sun to an accuracy of roughly 40 centimeters. Because we have such amazing accuracy we were able to see that between these two seas the elevation varied smoothly about 11 meters, relative to the center of mass of Titan, consistent with the expected change in the gravitational potential. We are measuring Titan’s geoid. This is the shape that the surface would take under the influence of gravity and rotation alone, which is the same shape that dominates Earth’s oceans.”

False-color mosaic of Titan’s northern lakes, made from infrared data collected by NASA’s Cassini spacecraft. Credit: NASA

Looking ahead, this map will play an important role when it comes tr scientists seeking to model Titan’s climate, study its shape and gravity, and its surface morphology. In addition, it will be especially helpful for those looking to test interior models of Titan, which is fundamental to determining if the moon could harbor life. Much like Europa and Enceladus, it is believed that Titan has a liquid water ocean and hydrothermal vents at its core-mantle boundary.

The second study, which also employed the new topographical map, was based on Cassini radar data that was obtained up to just a few months before the spacecraft burned up in Saturn’s atmosphere. Using this data, Assistant Professor Hayes and his team determined that Titan’s seas follow a constant elevation relative to Titan’s gravitational pull. Basically, they found that Titan has a sea level, much like Earth. As Hayes explained:

“We’re measuring the elevation of a liquid surface on another body 10 astronomical units away from the sun to an accuracy of roughly 40 centimeters. Because we have such amazing accuracy we were able to see that between these two seas the elevation varied smoothly about 11 meters, relative to the center of mass of Titan, consistent with the expected change in the gravitational potential. We are measuring Titan’s geoid. This is the shape that the surface would take under the influence of gravity and rotation alone, which is the same shape that dominates Earth’s oceans.”

This common elevation is important because liquid bodies on Titan appear to be connected by something resembling an aquifer system. Much like how water flows underground through porous rock and gravel on Earth, hydrocarbons do the same thing under Titan’s icy surface. This ensures that there is transference between large bodies of water, and that they share a common sea level.

Artist concept of Cassini’s last moments at Saturn. Credit: NASA/JPL.

“We don’t see any empty lakes that are below the local filled lakes because, if they did go below that level, they would be filled themselves,”  said Hayes. “This suggests that there’s flow in the subsurface and that they are communicating with each other. It’s also telling us that there is liquid hydrocarbon stored on the subsurface of Titan.”

Meanwhile, smaller lakes on Titan appear at elevations several hundred meters above Titan’s sea level. This is not dissimilar to what happens on Earth, where large lakes are often found at higher elevations. These are known as “Alpine Lakes”, and some well-known examples include Lake Titicaca in the Andes, Lakes Geneva in the Alps, and Paradise Lake in the Rockies.

Last, but not least, the study also revealed the vast majority of Titan’s lakes are found within sharp-edged depressions that are surrounded by high ridges, some of which are hundreds of meters high. Here too, there is a resemblance to features on Earth – such as the Florida Everglades – where underlying material dissolves and causes the surface to collapse, forming holes in the ground.

The shape of these lakes indicate that they may be expanding at a constant rate, a process known as uniform scarp retreat. In fact, the largest lake in the south – Ontario Lacus – resembles a series of smaller empty lakes that have coalesced to form a single feature. This process is apparently due to seasonal change, where autumn in the southern hemisphere leads to more evaporation.

While the Cassini mission is no longer exploring the Saturn system, the data it accumulated during its multi-year mission is still bearing fruit. Between these latest studies, and the many more that will follow, scientists are likely to reveal a great deal more about this mysterious moon and the forces that shape it!

Further Reading: NASA, Cornell University, Geophysical Research Letters