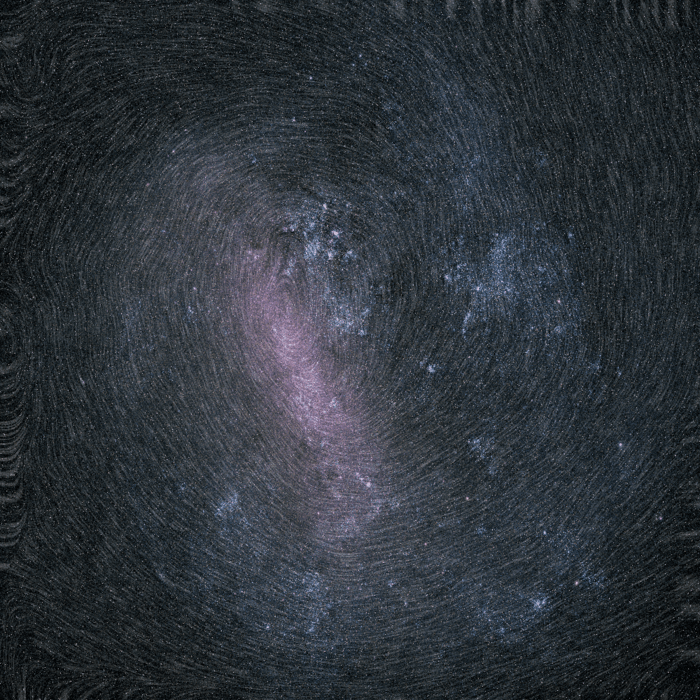
Rotation of the Large Magellanic Cloud, as revealed by the ESA's Gaia spacecraft. Copyright: ESA/Gaia/DPAC
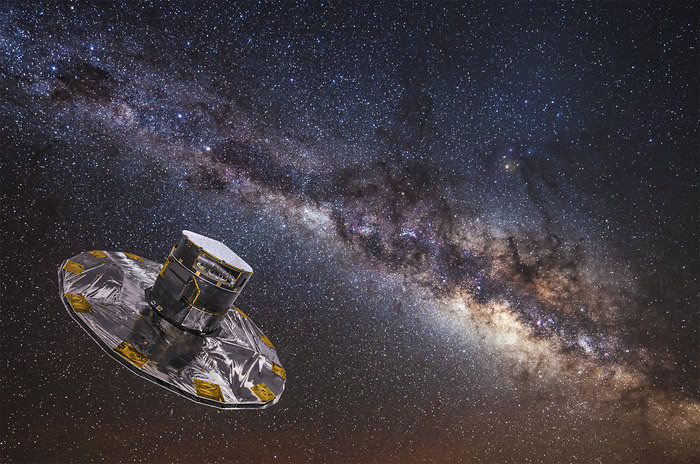
On December 19th, 2013, the European Space Agency’s (ESA) Gaia spacecraft took to space with for a very ambitious mission. Over the course of its planned 5-year mission (which was recently extended), this space observatory would map over a billion stars, planets, comets, asteroids and quasars in order to create the largest and most precise 3D catalog of the Milky Way ever created.
Since that time, the ESA has made two data releases that cover the first three years of the Gaia mission. The second data release, which took on April 25th, 2018, has already proven to be a treasure trove for astronomers. In addition to the positions, distance indicators and motions of over a billion stars and celestial objects in the Milky Way Galaxy, it also contained a hidden gem – the proper motions of stars within the Large Magellanic Cloud (LMC).
Located about 200,000 light-years from Earth, the LMC has dense clouds of dust that results in it experiencing high rates of star formation. In addition, it’s central bar is warped (where the east and west ends are nearer to the Milky Way), suggesting that it was once a barred dwarf spiral galaxy who’s spiral arms were disrupted by interaction with the Small Magellanic Cloud (SMC) and the Milky Way.
The proper motions of the stars in the LMC, as captured by the Gaia spacecraft (without color). Copyright: ESA/Gaia/DPAC
For these reasons, astronomers have been hoping to derive the orbits of dwarf galaxies (and globular clusters) that revolve around the Milky Way. In so doing, they hope to learn more about how our galaxy evolved due to mergers with clusters and other galaxies. By determining the proper motions of the LMC’s stars, the Gaia mission has provided clues as to how the Milky Way and its largest satellite galaxy have interacted over time.
As you can see from the image (at top), the bar of the LMC is outlined in great detail, along with individual star-forming regions like the Tarantula Nebula (aka. 30 Doradus, which is visible just above the center of the galaxy). The image combines the total amount of radiation detected by the observatory in each pixel. The radiation measurements were then taken through different filters on the spacecraft to generate color information.
This allowed Gaia to obtain information about the total density of stars within the LMC as well as their proper motions. As you can see, the image is dominated by the brightest, most massive stars, which greatly outshine their fainter, lower-mass counterparts. The proper motions of the stars observed is represented as the texture of the image – which looks a lot like a fingerprint.
The Large Magellanic Cloud (LMC), one of the nearest galaxies to our Milky Way, as viewed by ESA’s Gaia satellite using information from the mission’s second data release. Copyright ESA/Gaia/DPAC
From this, scientists were able to see an imprint of the stars rotating clockwise around the center of the galaxy. Using this information, astronomers will be able to create new models on how the LMC, SMC, and Milky Way evolved together over time. This, in turn, could shed light on how galaxies like our own, formed and evolved over the course of billions of years.
As with other information contained in the first and second data releases, this latest discovery demonstrates that the Gaia mission is fulfilling its intended purpose. The third release of Gaia data is scheduled to take place in late 2020, with the final catalog being published in the 2020s. Meanwhile, an extension has already been approved for the Gaia mission, which will now remain in operation until the end of 2020 (to be confirmed at the end of this year).
And be sure to enjoy this animated view of the LMC’s rotation, courtesy of the ESA:
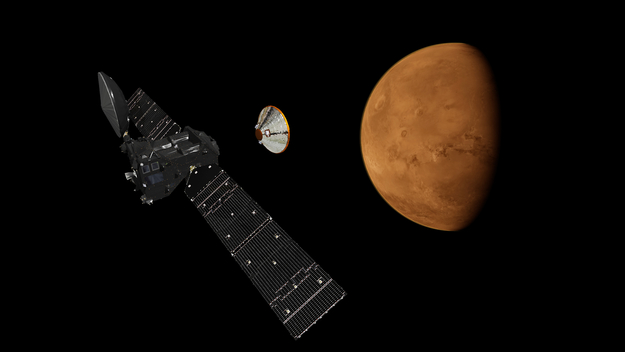
On October 19th, 2016, the European Space Agency’s Exobiology on Mars (ExoMars) mission established orbit around Mars. Consisting of the ExoMars Trace Gas Orbiter (TGO) and the Schiaparelli lander, the purpose of this mission is to investigate Mars for past signs of life. And whereas the Schiaparelli unfortunately crashed during deployment, the TGO has managed to begin its mission ahead of schedule.
A few weeks ago, the satellite achieved a near circular orbit around Mars after performing a series of braking maneuvers. Since that time, the orbiter’s Color and Stereo Surface Imaging System (CaSSIS) took a stunning image of the surface. This picture was not only the TGO’s first image of Mars, it was also a test to see if the orbiter is ready to being its main mission on April 28th.
The image captured a 40 km- (25 mi) long segment of the Korolev Crater, which is located high in Mars’ northern hemisphere. The image was a composite of three images in different colors that were taken simultaneously on April 15th, 2018, which were then assembled to produce this color image. The bright material that appears at the edge of the crater is water ice.
The ExoMars Colour and Stereo Surface Imaging System, CaSSIS, captured this view of the rim of Korolev crater (73.3ºN/165.9ºE). Copyright ESA/Roscosmos/CaSSIS
As Antoine Pommerol, a member of the CaSSIS science team working on the calibration of the data, explained in a recent ESA press release:
“We were really pleased to see how good this picture was given the lighting conditions. It shows that CaSSIS can make a major contribution to studies of the carbon dioxide and water cycles on Mars.”
Prior to the test phase, the camera team transmitted new software to the TGO, and after a few minor issues, they determined that the instrument was ready to work. The camera is one of four instruments on the TGO, which also carries two spectrometer suites and a neutron detector. The spectrometers began their science mission on April 21st by taking the first sample of the atmosphere to see how its molecules absorb sunlight.
By doing this, the TGO hopes to determine the chemical composition of Mars atmosphere and find evidence of methane and other trace atmospheric gases that could be signatures of active biological or geological processes. Eventually, the camera will help characterize features on the surface that could be related to trace gas sources. Hence the importance of this recent test.
ExoMars’ Trace Gas Orbiter (TGO) and Schiaparelli lander seperating in orbit of Mars. Credit: ESA/ATG medialab
“We aim to fully automate the image production process,” said Nicolas Thomas, the camera’s principal investigator from the University of Bern. “Once we achieve this, we can distribute the data quickly to the science community for analysis.”
A lot of challenges lie ahead, which includes a long period of data collection to bring out the details of rare (or yet to be discovered) trace gases in Mars’ atmosphere. This is necessary since trace gases (as the name would suggest) are present in only very small amounts – i.e. less than 1% of the volume of the planet’s atmosphere. But as Håkan Svedhem – the ESA’s TGO project scientist – indicated, the test image was a good start.
“We are excited to finally be starting collecting data at Mars with this phenomenal spacecraft,” he said. “The test images we have seen so far certainly set the bar high.”
By 2020, the second part of the ExoMars mission is scheduled to launch. This will consist of a Russian surface platform and a European rover landing on the surface in support of a science mission that is expected to last into 2022 or longer. Alongside NASA’s proposed Mars 2020 rover, the Red Planet is due to have several more visitors in the coming years!
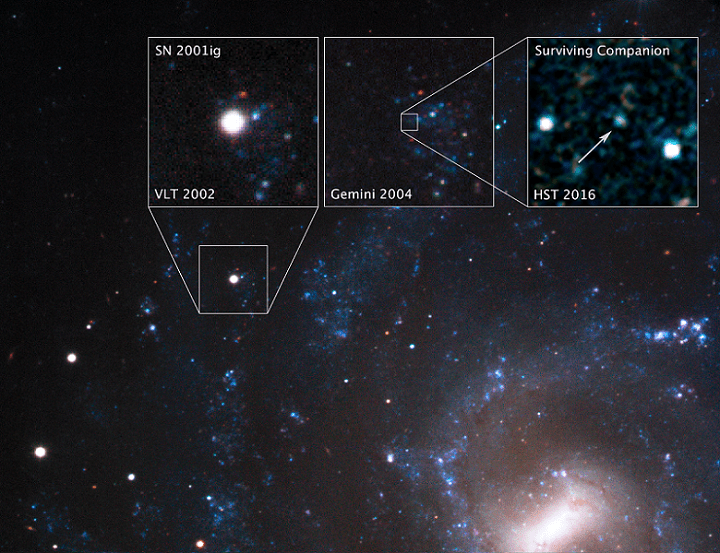
Hubble image of the supernova SN 2001ig, which indicated the presence of a companion. Credits: NASA, ESA, S. Ryder (Australian Astronomical Observatory), and O. Fox (STScI)
A Type II supernova is a truly amazing astronomical event. As with all supernovae, a Type II consists of a star experiencing core collapse at the end of its life cycle and exploding, causing it to shed its outer layers. A subclass of this type is known as Type IIb, which are stars that have been stripped of their hydrogen fuel and undergo collapse because they are no longer able to maintain fusion in their core.
Seventeen years ago, astronomers were fortunate enough to witness a Type IIb supernova in the galaxy NGC 7424, located 40 million light-years away in the southern constellation Grus. Now that this supernova has faded, the Hubble Space Telescope recently captured the first image of a surviving companion, thus demonstrating that supernovae do indeed happen in double-star systems.
This discovery is the most compelling evidence to date that some supernovae originate as a result of siphoning between binary pairs. As Stuart Ryder indicated in a recent NASA press release:
“We know that the majority of massive stars are in binary pairs. Many of these binary pairs will interact and transfer gas from one star to the other when their orbits bring them close together.”
The supernova, called SN 2001ig, was pinpointed by astronomers in 2002 using the European Southern Observatory’s Very Large Telescope (VLT). In 2004, these observations were followed-up with the Gemini South Observatory, which first hinted at the presence of a surviving binary companion. Knowing the exact coordinates, Ryder and his team were able to focus Hubble on that location as the supernova’s glow faded.
The find was especially fortuitous because it might also shed light on a astronomical mystery, which is how stripped-envelop supernovae lose their outer envelopes. Originally, scientists believed they were the result of stars with very fast winds that pushed off their outer envelopes. However, when astronomers began looking for the primary stars which spawned these supernovae, they could not find them.
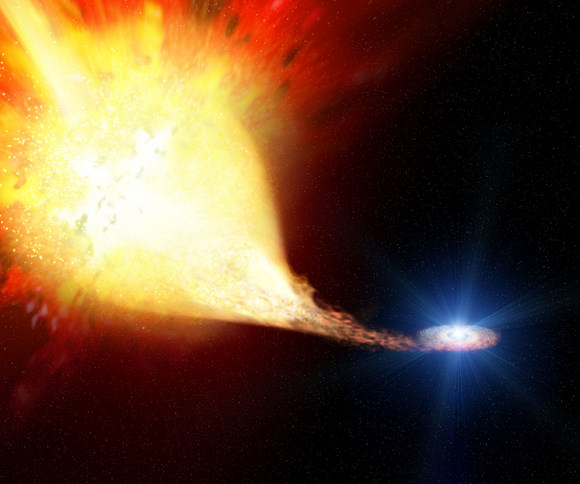
Artist’s impression of a pulsar siphoning material from a companion star. Credit: NASA
As Ori Fox, a member of the Space Telescope Science Institute and a co-author on the paper, explained:
“That was especially bizarre, because astronomers expected that they would be the most massive and the brightest progenitor stars. Also, the sheer number of stripped-envelope supernovas is greater than predicted.”
This led scientists to theorize that many of the stripped-envelop stars were the primary in lower-mass binary star systems. All that remained was to find a supernova that was part of a binary system, which Ryder and his colleagues set out to do. This was no easy task, seeing as how the companion was rather faint and at the very limits of what Hubble could see.
In addition, not many supernovae are known to go off within this distance range. Last, but not least, they had to know the exact position through very precise measurements. Thanks to Hubble’s exquisite resolution and ultraviolet capability, they were able to find and photograph the surviving companion.
Prior to the supernova, the stars orbited each other with a period of about one year. When the primary star exploded, it had an impact on the companion, but it remained intact. Because of this, SN 2001ig is the first surviving companion to ever be photographed.
Artist’s rendering of SN 1993J, where a red supergiant supernova progenitor star (left) is exploding after having transferred about 10 solar masses of hydrogen gas to the blue companion star (right). Credit: ESA
Looking ahead, Ryder and his team hope to precisely determine how many supernovae with stripped envelopes have companions. At present, it is estimated that at least half of them do, while the other half lose their outer enveloped due to stellar winds. Their next goal is to examine completely stripped-envelope supernovae, as opposed to SN 2001ig and SN 1993J, which were only about 90% stripped.
Luckily, they won’t have to wait as long to examine these completely stripped-envelope supernovae, since they don’t have as much shock interaction with gas in their surrounding environment. In short, since they lost their outer envelopes long before they exploded, they fade much faster. This means that the team will only have to wait two to three years before looking for the surviving companions.
Their efforts are also likely to be helped by the deployment of the James Webb Space Telescope (JWST), which is scheduled to launch in 2020. Depending on what they find, astronomers may be ready to resolve the mystery of what causes the different types of supernovae, which could also reveal more about the life cycles of stars and the birth of black holes.
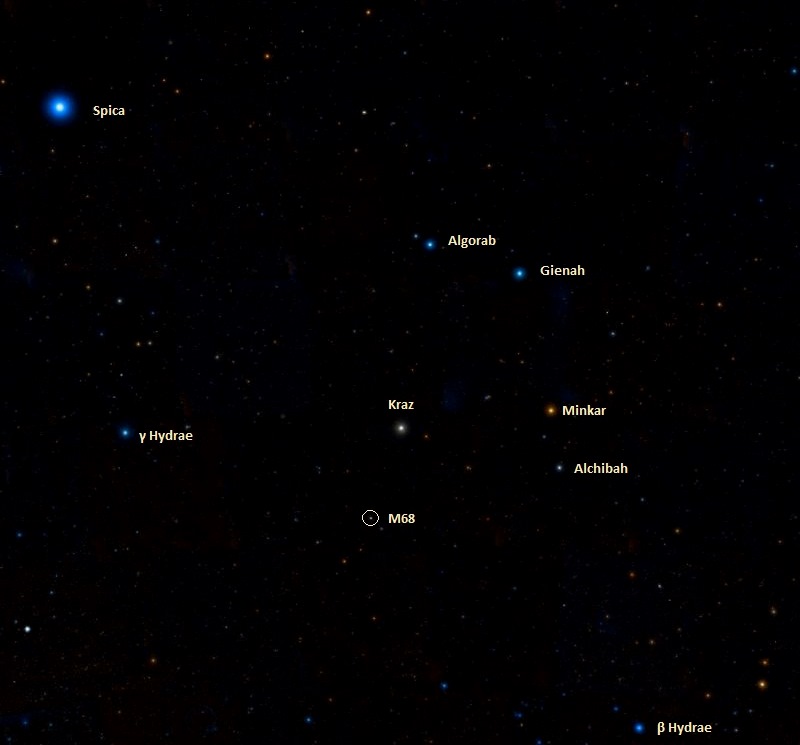
Messier 68, shown in proximity to the Hydra constellation. Credit: Wikisky
Welcome back to Messier Monday! Today, we continue in our tribute to our dear friend, Tammy Plotner, by looking at the globular cluster known as Messier 68.
In the 18th century, while searching the night sky for comets, French astronomer Charles Messier kept noting the presence of fixed, diffuse objects he initially mistook for comets. In time, he would come to compile a list of approximately 100 of these objects, hoping to prevent other astronomers from making the same mistake. This list – known as the Messier Catalog – would go on to become one of the most influential catalogs of Deep Sky Objects.
One of these objects is the globular cluster known as Messier 68. Located roughly 33,000 light-years away in the Constellation of Hydra, this cluster is orbiting through the Milky. In addition to being one of the most metal-poor globular clusters, it may be undergoing core collapse, and is believed to have been acquired from a satellite galaxy that merged with the Milky Way in the past. Continue reading “Messier 68 – the NGC 4590 Globular Cluster”
Artist impression of 14 galaxies detected by ALMA as they appear in the very early, very distant universe. These galaxies are in the process of merging and will eventually form the core of a massive galaxy cluster. Credit: NRAO/AUI/NSF; S. Dagnello
Looking deep into the observable Universe – and hence, back to the earliest periods of time – is an immensely fascinating thing. In so doing, astronomers are able to see the earliest galaxies in the Universe and learn more about how they evolved over time. From this, they are not only able to see how large-scale structures (like galaxies and galaxy clusters) formed, but also the role played by dark matter.
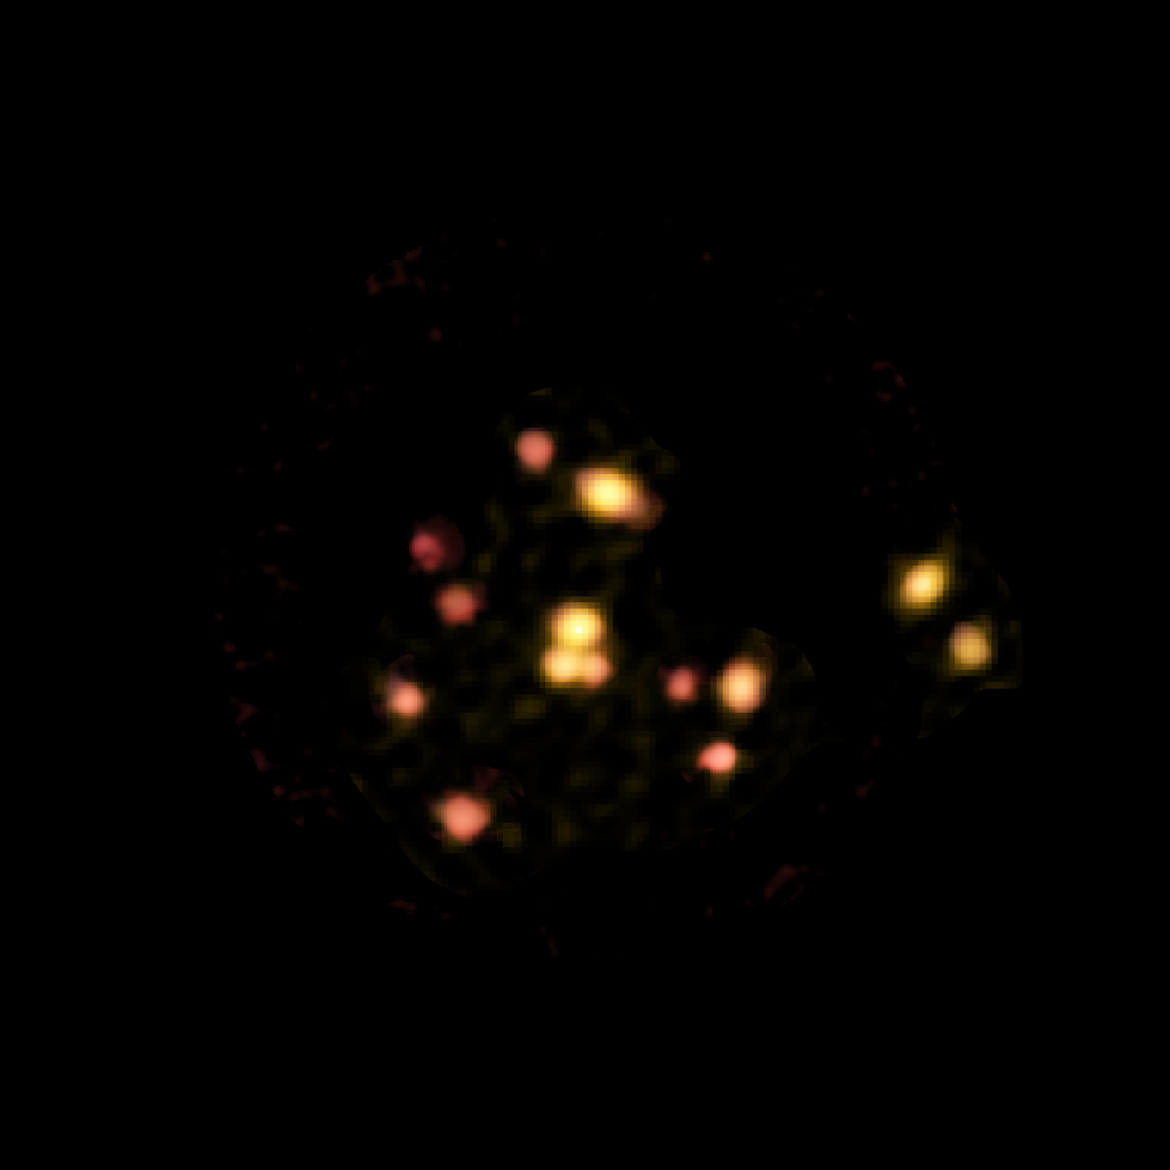
Most recently, an international team of scientists used the Atacama Large Millimeter-submillimeter Array (ALMA) to observe the Universe when it was just 1.4 billion years old. What they observed was a “protocluster”, a series of 14 galaxies located 12.4 billion light-years away that were about to merge. This would result in the formation of a massive galaxy cluster, one of the largest objects in the known Universe.
ALMA image of 14 galaxies forming a protocluster known as SPT2349-56. These galaxies are in the process of merging and will eventually form the core of a truly massive galaxy cluster. Credit: ALMA (ESO/NAOJ/NRAO); B. Saxton (NRAO/AUI/NSF)
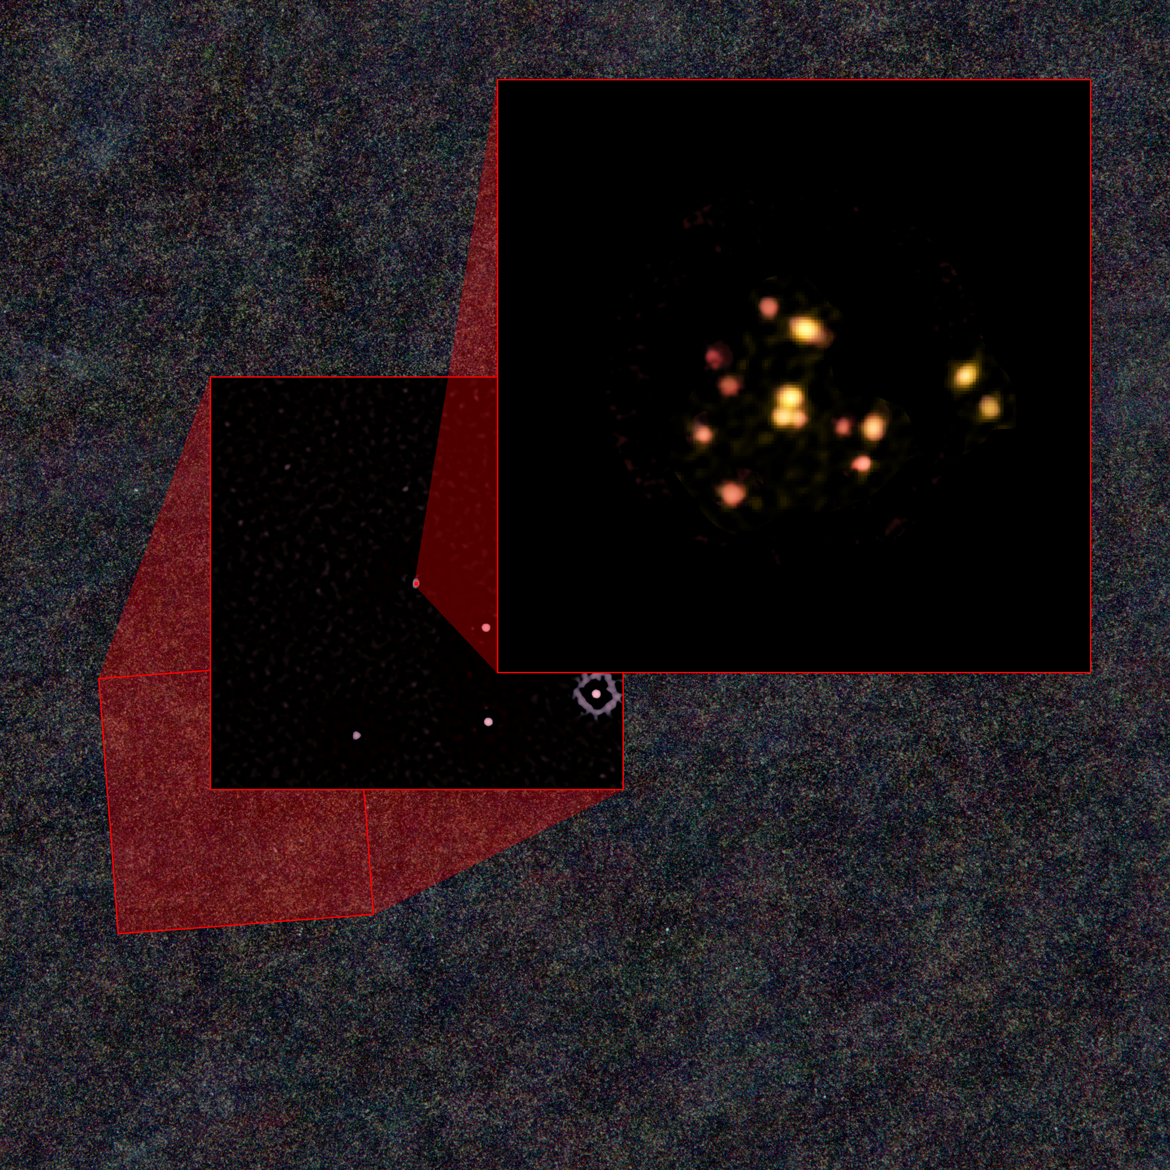
As they indicate in their study, this protocluster (designated SPT2349-56) was first observed by the National Science Foundation’s South Pole Telescope. Using the Atacama Pathfinder Experiment (APEX), the team conducted follow-up observations that confirmed that it was an extremely distant galactic source, which was then observed with ALMA. Using ALMA’s superior resolution and sensitivity, they were able to distinguish the individual galaxies.
What they found was that these galaxies were forming stars at rate 1,000 times faster than our galaxy, and were crammed inside a region of space that was about three times the size of the Milky Way. Using the ALMA data, the team was also able to create sophisticated computer simulations that demonstrated how this current collection of galaxies will likely grow and evolve over billion of years.
These simulations indicated that once these galaxies merge, the resulting galaxy cluster will rival some of the most massive clusters we see in the Universe today. As Scott Chapman, and astrophysicist at Dalhousie University and a co-author on the study, explained:
“Having caught a massive galaxy cluster in throes of formation is spectacular in and of itself. But, the fact that this is happening so early in the history of the universe poses a formidable challenge to our present-day understanding of the way structures form in the universe.”
Zooming in to the galaxies discovered by ALMA that are evolving into a galaxy cluster. Credit: ALMA (ESO/NAOJ/NRAO), T. Miller & S. Chapman et al.; Herschel; South Pole Telescope; (NRAO/AUI/NSF) B. Saxton
The current scientific consensus among astrophysicists states that a few million years after the Big Bang, normal matter and dark matter began to form larger concentrations, eventually giving rise to galaxy clusters. These objects are the largest structures in the Universe, containing trillions of stars, thousands of galaxies, immense amounts of dark matter and massive black holes.
However, current theories and computer models have suggested that protoclusters – like the one observed by ALMA – should have taken much longer to evolve. Finding one that dates to just 1.4 billion years after the Big Bang was therefore quite the surprise. As Tim Miller, who is currently a doctoral candidate at Yale University, indicated:
“How this assembly of galaxies got so big so fast is a bit of a mystery, it wasn’t built up gradually over billions of years, as astronomers might expect. This discovery provides an incredible opportunity to study how galaxy clusters and their massive galaxies came together in these extreme environments.”
Looking to the future, Chapman and his colleagues hope to conduct further studies of SPT2349-56 to see how this protoclusters eventually became a galaxy cluster. “ALMA gave us, for the first time, a clear starting point to predict the evolution of a galaxy cluster,” he said. “Over time, the 14 galaxies we observed will stop forming stars and will collide and coalesce into a single gigantic galaxy.”
The study of this and other protoclusters will be made possible thanks to instruments like ALMA, but also next-generation observatories like the Square Kilometer Array (SKA). Equipped with more sensitive arrays and more advanced computer models, astronomers may be able to create a truly accurate timeline of how our Universe became what it is today.
A recent capture of Jupiter from April 21st. Image credit and copyright: Efrain Morales.
A recent capture of Jupiter from April 21st. Image credit and copyright: Efrain Morales Rivera.
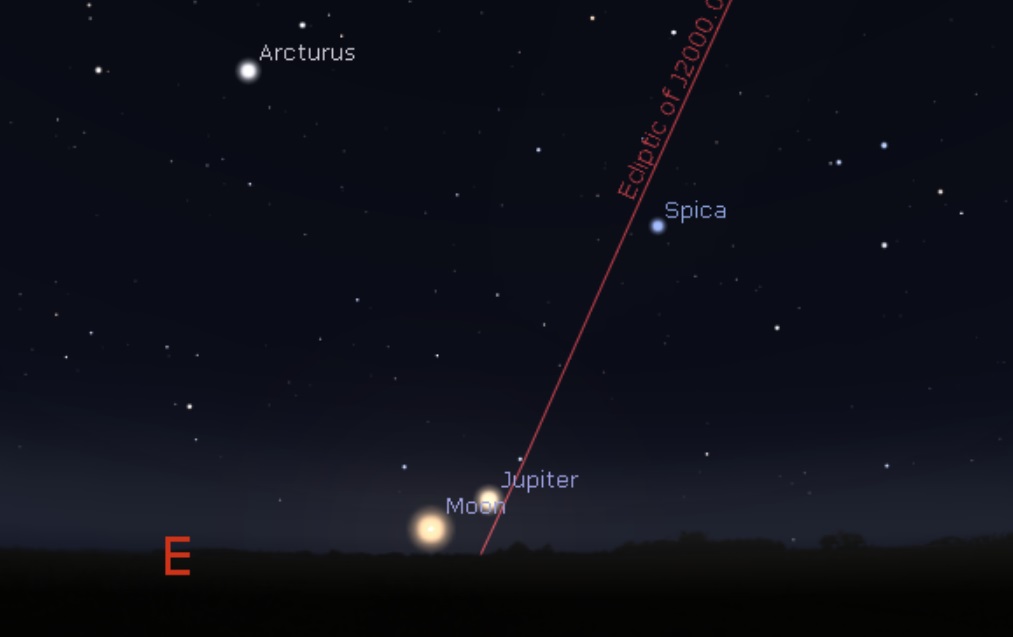
It’s a question I’ve fielded lots this weekend leading up to last night’s April Pink Full Moon, and one I expect we’ll get again tonight: “What’s that bright star near the Moon?”
That bright “star” is actually a planet, the king of them all as far as our Solar System is concerned: Jupiter. May also ushers in Jupiter observing season, as the planet reaches opposition on May 9th, rising in the east opposite to the setting Sun to the west. Jupiter now joins Venus in the dusk sky, ending the planetary drought plaguing many an evening star party.
Looking east tonight (April 30th) at 9 PM local. Created using Stellarium.
All planetary news seems to lead back to Jupiter this season. Just last week, we wrote about a recent study, suggesting that Jupiter actually gets hit by asteroids and comets on a much more regular basis than astronomers thought.
It’s always worth keeping a sharp eye on Jupiter. Shining a magnitude -2.5 near opposition, you can even pick Jupiter out against the deep blue daytime sky… if you know exactly where to look for it. The Moon visits Jupiter once every orbit, and the next time to try this feat of visual athletics is on May 27th, just before sunset.
Jupiter is 4.4 astronomical units (658 million kilometers) distant at opposition this year, and presents a disk 45” across.
At the eyepiece, Jupiter presents a roiling upper atmosphere, completing an amazing rotation once every 9.9 hours. This is not only fast enough to give Jove a noticeable equatorial bulge at its equator, but you can also observe and image Jupiter in its entirety in just one clear evening.
One of the first things that becomes apparent observing Jupiter at low power are its retinue of four Galilean moons. These are, from interior outward: Io, Europa, Ganymede and Callisto. Speedy Io takes just 1.8 days to orbit Jupiter once, while outermost Callisto takes a leisurely 16.7 days to make one circuit around Jupiter. Not only is it fun to note the changes in configuration of Jupiter’s major moons from night to night, but it’s interesting to watch them cast shadows onto Jupiter’s cloud tops and alternately disappear and reappear in and out of Jupiter’s shadow.
Two shadows crossing the face of Jupiter on July 30th, 2018. Created using Stellarium.
A few times a year, you can catch two moons casting a shadow on Jupiter at once. These usually happen in seasons, with the next pair involving Io and Europa (the most frequent transiters) set to occur on July 30th, 2018. Rarer still are triple transits, which last occurred on January 24th, 2015 and will happen next on March 20th, 2032. You’ll never see a quadruple transit though… and the outermost moon Callisto is the only one that can “miss” Jupiter, as it does in 2018.
The celestial scene changes, too, like a spotlight cast over the stage of the sky. At opposition, for example, Jupiter and its moons cast their respective shadows straight back, nearly behind them from our perspective. Watch how this changes, however, as Jupiter heads towards quadrature at 90 degrees elongation east of the Sun on August 6th, 2018 and we see Jupiter and its moons cast their shadows to the side.
Danish astronomer Ole Rømer noted a discrepancy in the timings of shadow transits near opposition versus quadrature and correctly realized that light from the events was actually taking time to transit from Jupiter to his telescope on Earth, and made the first crude measurement of the speed of light in 1676.
Crank up the magnification, and the Great Red Spot will pop into view if it’s turned Earthward. Though this centuries-long storm has been shrinking in recent years, it also seems to be condensing and reddening once again, versus the pale salmon color its exhibited as of late. How old is the Great Red Spot? Will it disappear this century, disappointing legions of school kids who diligently crayon in a ruby red eye on Jove?
One thing is for sure; the face of Jove does change over time. Another interesting example is the disappearing act that Jove’s Southern Equatorial Belt (SEB) makes every decade or so… this last occurred during 2010 season, and we may soon be due again. It would be an amazing scientific opportunity if this were to occur before NASA’s Juno spacecraft completes its mission this summer. Our question: why does the SEB disappear, while the NEB seems to be a permanent fixture on Jove?
All mysteries presented by the largest planet in our solar system, this opposition season 2018.
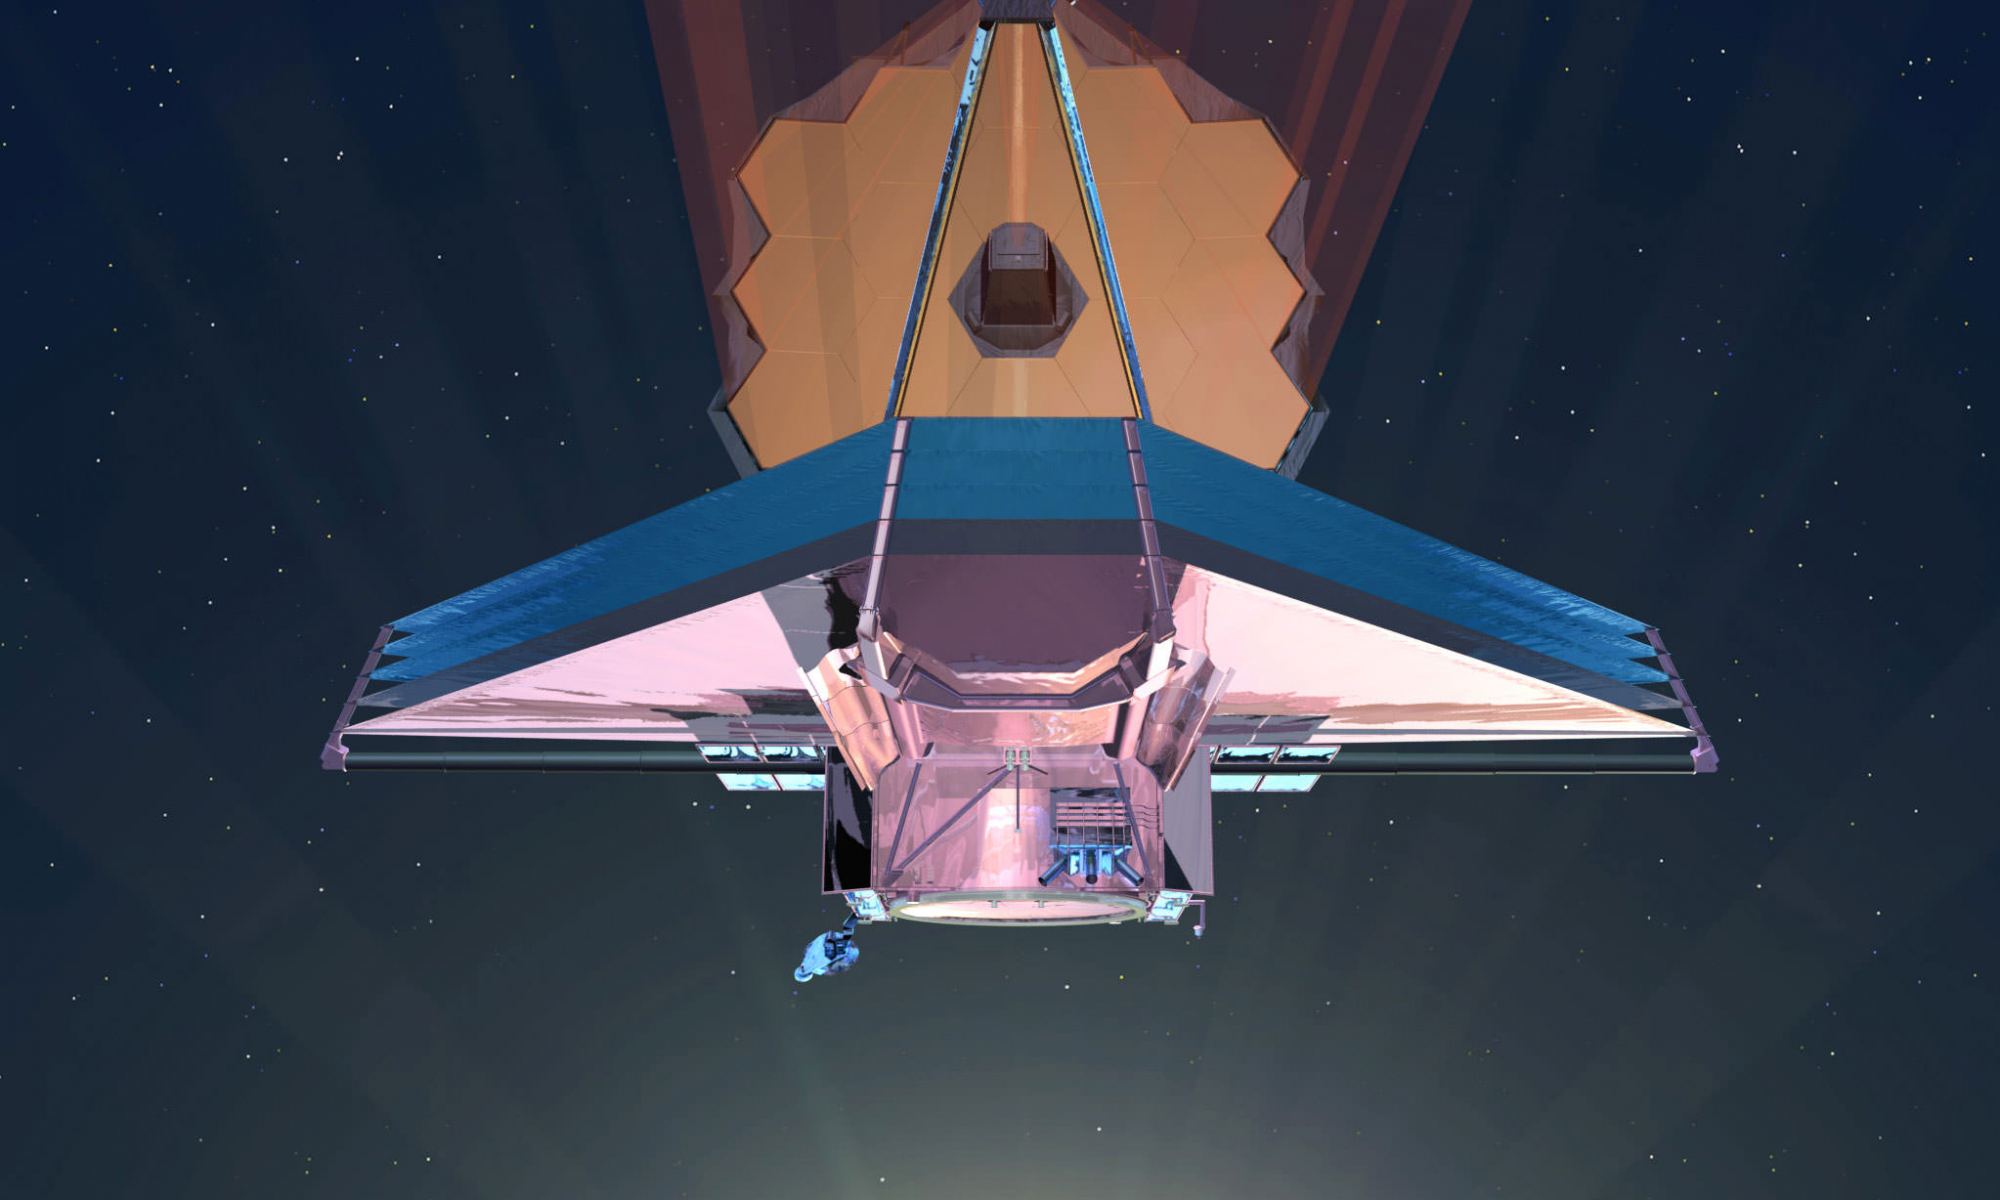
NASA's James Webb Telescope, shown in this artist's conception, will provide more information about previously detected exoplanets. Beyond 2020, many more next-generation space telescopes are expected to build on what it discovers. Credit: NASA
With the recent launch of the Transiting Exoplanet Survey Satellite (TESS) – which took place on Wednesday, April 18th, 2018 – a lot of attention has been focused on the next-generation space telescopes that will be taking to space in the coming years. These include not only the James Webb Space Telescope, which is currently scheduled for launch in 2020, but some other advanced spacecraft that will be deployed by the 2030s.
Such was the subject of the recent 2020 Decadal Survey for Astrophysics, which included four flagship mission concepts that are currently being studied. When these missions take to space, they will pick up where missions like Hubble, Kepler, Spitzer and Chandra left off, but will have greater sensitivity and capability. As such, they are expected to reveal a great deal more about our Universe and the secrets it holds.
As expected, the mission concepts submitted to the 2020 Decadal Survey cover a wide range of scientific goals – from observing distant black holes and the early Universe to investigating exoplanets around nearby stars and studying the bodies of the Solar System. These ideas were thoroughly vetted by the scientific community, and four have been selected as being worthy of pursuit.
Artist’s concept of the Large Ultraviolet/Optical/Infrared Surveyor (LUVOIR) space telescope. Credits: NASA/GSFC
“This is game time for astrophysics. We want to build all these concepts, but we don’t have the budget to do all four at the same time. The point of these decadal studies is to give members of the astrophysics community the best possible information as they decide which science to do first.”
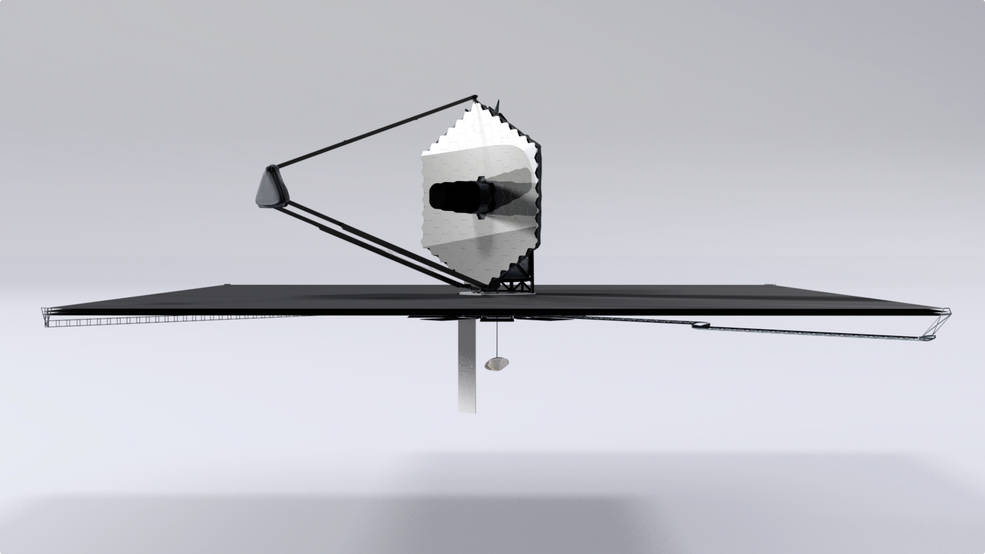
The four selected concepts include the Large Ultraviolet/Optical/Infrared Surveyor (LUVOIR), a giant space observatory developed in the tradition of the Hubble Space Telescope. As one of two concepts being investigated by NASA’s Goddard Space Flight Center, this mission concept calls for a space telescope with a massive segmented primary mirror that measures about 15 meters (49 feet) in diameter.
In comparison, the JWST‘s (currently the most advanced space telescope) primary mirror measures 6.5 m (21 ft 4 in) in diameter. Much like the JWST, LUVOIR’s mirror would be made up of adjustable segments that would unfold once it deployed to space. Actuators and motors would actively adjust and align these segments in order to achieve the perfect focus and capture light from faint and distant objects.
With these advanced tools, LUVOIR would be able to directly image Earth-sized planets and assess their atmospheres. As Study Scientist Aki Roberge explained:
“This mission is ambitious, but finding out if there is life outside the solar system is the prize. All the technology tall poles are driven by this goal… Physical stability, plus active control on the primary mirror and an internal coronagraph (a device for blocking starlight) will result in picometer accuracy. It’s all about control.”
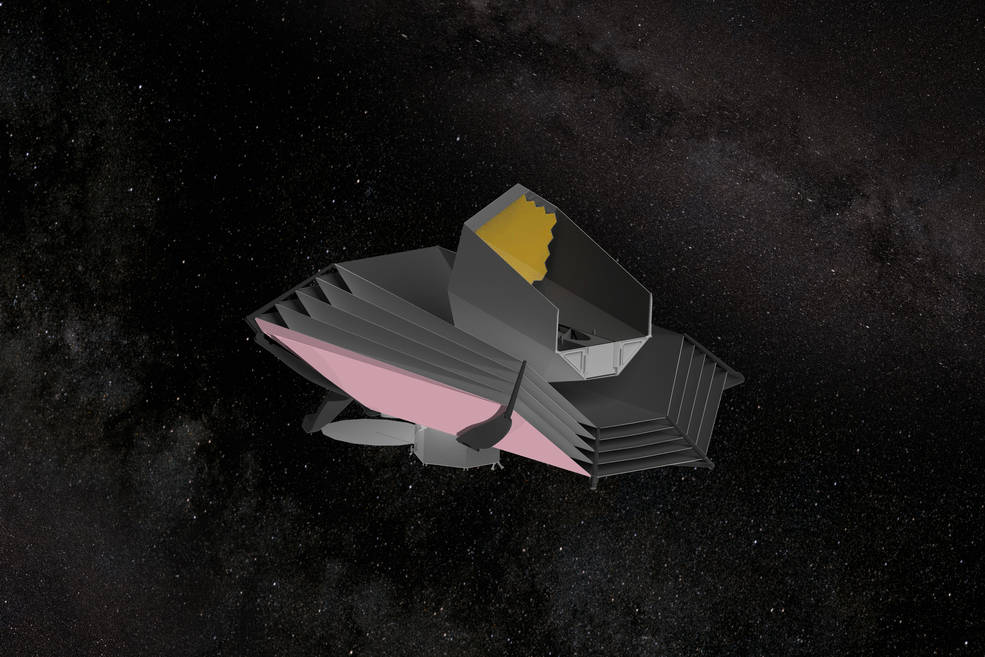
There’ also the Origins Space Telescope (OST), another concept being pursued by the Goddard Space Flight Center. Much like the Spitzer Space Telescope and the Herschel Space Observatory, this far-infrared observatory would offer 10,000 times more sensitivity than any preceding far-infrared telescope. Its goals include observing the farthest reaches of the universe, tracing the path of water through star and planet formation, and searching for signs of life in the atmospheres of exoplanets.
Its primary mirror, which would measure about 9 m (30 ft) in diameter, would be the first actively cooled telescope, keeping its mirror at a temperature of about 4 K (-269 °C; -452 °F) and its detectors at a temperature of 0.05 K. To achieve this, the OST team will rely on flying layers of sunshields, four cryocoolers, and a multi-stage continuous adiabatic demagnetization refrigerator (CADR).
Artist’s concept of the the Origins Space Telescope (OST). Credits: NASA/GSFC
According to Dave Leisawitz, a Goddard scientist and OST study scientist, the OST is especially reliant on large arrays of superconducting detectors that measure in the millions of pixels. “When people ask about technology gaps in developing the Origins Space Telescope, I tell them the top three challenges are detectors, detectors, detectors,” he said. “It’s all about the detectors.”
Specifically, the OST would rely on two emerging types of detectors: Transition Edge Sensors (TESs) or Kinetic Inductance Detectors (KIDs). While still relatively new, TES detectors are quickly maturing and are currently being used in the HAWC+ instrument aboard NASA’s Stratospheric Observatory for Infrared Astronomy (SOFIA).
Then there’s the Habitable Exoplanet Imager (HabEx) which is being developed by NASA’s Jet Propulsion Laboratory. Like LUVOIR, this telescope would also directly image planetary systems to analyze the composition of planets’ atmospheres with a large segmented mirror. In addition, it would study the earliest epochs in the history of the Universe and the life cycle of the most massive stars, thus shedding light on how the elements that are necessary for life are formed.
Also like LUVOIR, HabEx would be able to conduct studies in the ultraviolet, optical and near-infrared wavelengths, and be able to block out a parent star’s brightness so that it could see light being reflected off of any planets orbiting it. As Neil Zimmerman, a NASA expert in the field of coronagraphy, explained:
“To directly image a planet orbiting a nearby star, we must overcome a tremendous barrier in dynamic range: the overwhelming brightness of the star against the dim reflection of starlight off the planet, with only a tiny angle separating the two. There is no off-the-shelf solution to this problem because it is so unlike any other challenge in observational astronomy.”
Artist’s rendition of the Habitable Exoplanet Imager (HabEx) space telescope. Credits: NASA/JPL
To address this challenge, the HabEx team is considering two approaches, which include external petal-shaped star shades that block light and internal coronagraphs that prevent starlight from reaching the detectors. Another possibility being investigated is to apply carbon nanotubes onto the coronagraphic masks to modify the patterns of any diffracted light that still gets through.
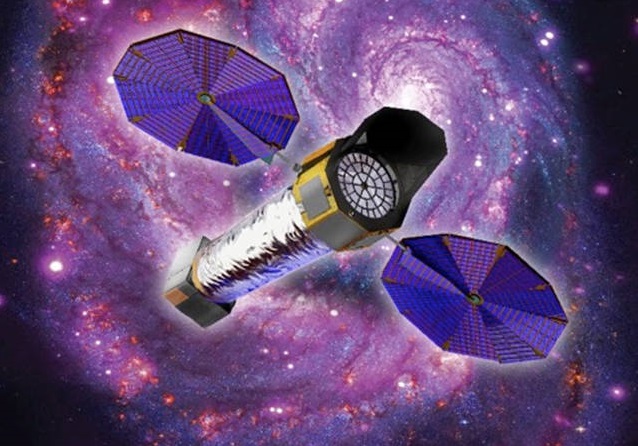
Last, but not least, is the X-ray Surveyor known as Lynx being developed by the Marshall Space Flight Center. Of the four space telescopes, Lynx is the only concept which will examine the Universe in X-rays. Using an X-ray microcalorimeter imaging spectrometer, this space telescope will detect X-rays coming from Supermassive Black Holes (SMBHs) at the center of the earliest galaxies in the Universe.
This technique consists of X-ray photos hitting a detector’s absorders and converting their energy to heat, which is measured by a thermometer. In this way, Lynx will help astronomers unlock how the earliest SMBHs formed. As Rob Petre, a Lynx study member at Goddard, described the mission:
“Supermassive black holes have been observed to exist much earlier in the universe than our current theories predict. We don’t understand how such massive objects formed so soon after the time when the first stars could have formed. We need an X-ray telescope to see the very first supermassive black holes, in order to provide the input for theories about how they might have formed.”
Artist’s impression of the X-ray Surveyor (Lynx) space telescope. Credits: NASA/MSFC
Regardless of which mission NASA ultimately selects, the agency and individual centers have begun investing in advanced tools to pursue such concepts in the future. The four teams submitted their interim reports back in March. By next year, they are expected to finish final reports for the National Research Council (NRC), which will be used to inform its recommendations to NASA in the coming years.
As Thai Pham, the technology development manager for NASA’s Astrophysics Program Office, indicated:
“I’m not saying it will be easy. It won’t be. These are ambitious missions, with significant technical challenges, many of which overlap and apply to all. The good news is that the groundwork is being laid now.”
With TESS now deployed and the JWST scheduled to launch by 2020, the lessons learned in the next few years will certainly be incorporated into these missions. At present, it is not clear which of the following concepts will be going to space by the 2030s. However, between their advanced instruments and the lessons learned from past missions, we can expect that they will make some profound discoveries about the Universe.
Using information from Gaia's second data release, a team of scientists have made refined estimates of the Milky Way's mass. Credit: ESA/Gaia/DPAC
On December 19th, 2013, the European Space Agency’s (ESA) Gaia spacecraft took to space with one of the most ambitious missions ever. Over the course of its planned 5-year mission (which was recently extended), this space observatory would map over a billion stars, planets, comets, asteroids and quasars in order to create the largest and most precise 3D catalog of the Milky Way ever created.
The first release of Gaia data, which took place in September 2016, contained the distances and motions of over two million stars. But the second data release, which took place on April 25th, 2018, is even more impressive. Included in the release are the positions, distance indicators and motions of more than one billion stars, asteroids within our Solar System, and even stars beyond the Milky Way.
Whereas the first data release was based on just over a year’s worth of observations, the new data release covers a period of about 22 months – which ran from July 25th, 2014, to May 23rd, 2016. Preliminary analysis of this data has revealed fine details about 1.7 billion stars in the Milky Way and how they move, which is essential to understanding how our galaxy evolved over time.
ESA’s Gaia is currently on a five-year mission to map the stars of the Milky Way. Image credit: ESA/ATG medialab; background: ESO/S. Brunier.
As Günther Hasinger, the ESA Director of Science, explained in a recent ESA press release:
“The observations collected by Gaia are redefining the foundations of astronomy. Gaia is an ambitious mission that relies on a huge human collaboration to make sense of a large volume of highly complex data. It demonstrates the need for long-term projects to guarantee progress in space science and technology and to implement even more daring scientific missions of the coming decades.“
The precision of Gaia‘s instruments has allowed for measurements that are so accurate that it was possible to separate the parallax of stars – the apparent shift caused by the Earth’s orbit around the Sun – from their movements through the galaxy. Of the 1.7 billion stars cataloged, the parallax and velocity (aka. proper motion) of more than 1.3 billion were measured and listed.
For about 10% of these, the parallax measurements were so accurate that astronomers can directly estimate distances to the individual stars. As Anthony Brown of Leiden University, who is also the chair of the Gaia Data Processing and Analysis Consortium Executive Board, explained:
“The second Gaia data release represents a huge leap forward with respect to ESA‘s Hipparcos satellite, Gaia‘s predecessor and the first space mission for astrometry, which surveyed some 118 000 stars almost thirty years ago… The sheer number of stars alone, with their positions and motions, would make Gaia‘s new catalogue already quite astonishing. But there is more: this unique scientific catalogue includes many other data types, with information about the properties of the stars and other celestial objects, making this release truly exceptional.“
In addition to the proper motions of stars, the catalog provides information on a wide range of topics that will be of interest to astronomers and astrophysicists. These include brightness and color measurements of nearly all of the 1.7 billion stars cataloged, as well as information on how the brightness and color change for half a million variable stars over time.
It also contains the velocities along the line of sight of seven million stars, the surface temperatures of about 100 million, and the effect interstellar dust has on 87 million. The Gaia data also contains information on objects in our Solar System, which includes the positions of 14,000 known asteroids (which will allow for the precise determination of their orbits).
Beyond the Milky Way, Gaia obtained more accurate measurements of the positions of half a million distant quasars – bright galaxies that emit massive amounts of energy due to the presence of a supermassive black hole at their centers. In the past, quasars have been used as a reference frame for the celestial coordinates of all objects in the Gaia catalogue based on radio waves.
However, this information will now be available at optical wavelengths for the first time. This, and other developments made possible by Gaia, could revolutionize how we study our galaxy and the Universe. As Antonella Vallenari, from the Istituto Nazionale di Astrofisica (INAF), the Astronomical Observatory of Padua, Italy, and the deputy chair of the Data Processing Consortium Executive Board, indicated:
“The new Gaia data are so powerful that exciting results are just jumping at us. For example, we have built the most detailed Hertzsprung-Russell diagram of stars ever made on the full sky and we can already spot some interesting trends. It feels like we are inaugurating a new era of Galactic archaeology.“
The Hertzsprung-Russell diagram, which is named after the two astronomers who devised it in the early 20th century, is fundamental to the study of stellar populations and their evolution. Based on four million stars that were selected from the catalog (all of which are withing five thousand light-years from the Sun), scientist were able to reveal many fine details about stars beyond our Solar System for the first time.
Along with measurements of their velocities, the Gaia Hertzsprung-Russell diagram enables astronomers to distinguish between populations of stars that are of different ages, are located in different regions of the Milky Way (i.e. the disk and the halo), and that formed in different ways. These include fast moving stars that were previously thought to belong to the halo, but are actually part of two stellar populations.
“Gaia will greatly advance our understanding of the Universe on all cosmic scales,” said Timo Prusti, a Gaia project scientist at ESA. “Even in the neighborhood of the Sun, which is the region we thought we understood best, Gaia is revealing new and exciting features.”
For instance, for a subset of stars within a few thousand light-years of the Sun, Gaia measured their velocity in all three dimensions. From this, it has been determined that they follow a similar pattern to stars that are orbiting the galaxy at similar speeds. The cause of these patterns will be the subject of future research, as it is unclear whether its caused by our galaxy itself or are the result of interactions with smaller galaxies that merged with us in the past.
Last, but not least, Gaia data will be used to learn more about the orbits of 75 globular clusters and 12 dwarf galaxies that revolve around the Milky Way. This information will shed further light on the evolution of our galaxy, the gravitational forces affecting it, and the role played by dark matter. As Fred Jansen, the Gaia mission manager at ESA, put it:
“Gaia is astronomy at its finest. Scientists will be busy with this data for many years, and we are ready to be surprised by the avalanche of discoveries that will unlock the secrets of our Galaxy.“
The third release of Gaia data is scheduled to take place in late 2020, with the final catalog being published in the 2020s. Meanwhile, an extension has already been approved for the Gaia mission, which will now remain in operation until the end of 2020 (to be confirmed at the end of this year). A series of scientific papers describing what has been learned from this latest release will also appear in a special issue of Astronomy & Astrophysics.
From the evolution of stars to the evolution of our galaxy, the second Gaia data release is already proving to be a boon for astronomers and astrophysicists. Even after the mission concludes, we can expect scientists will still be analyzing the data and learning a great deal more about the structure and evolution of our Universe.
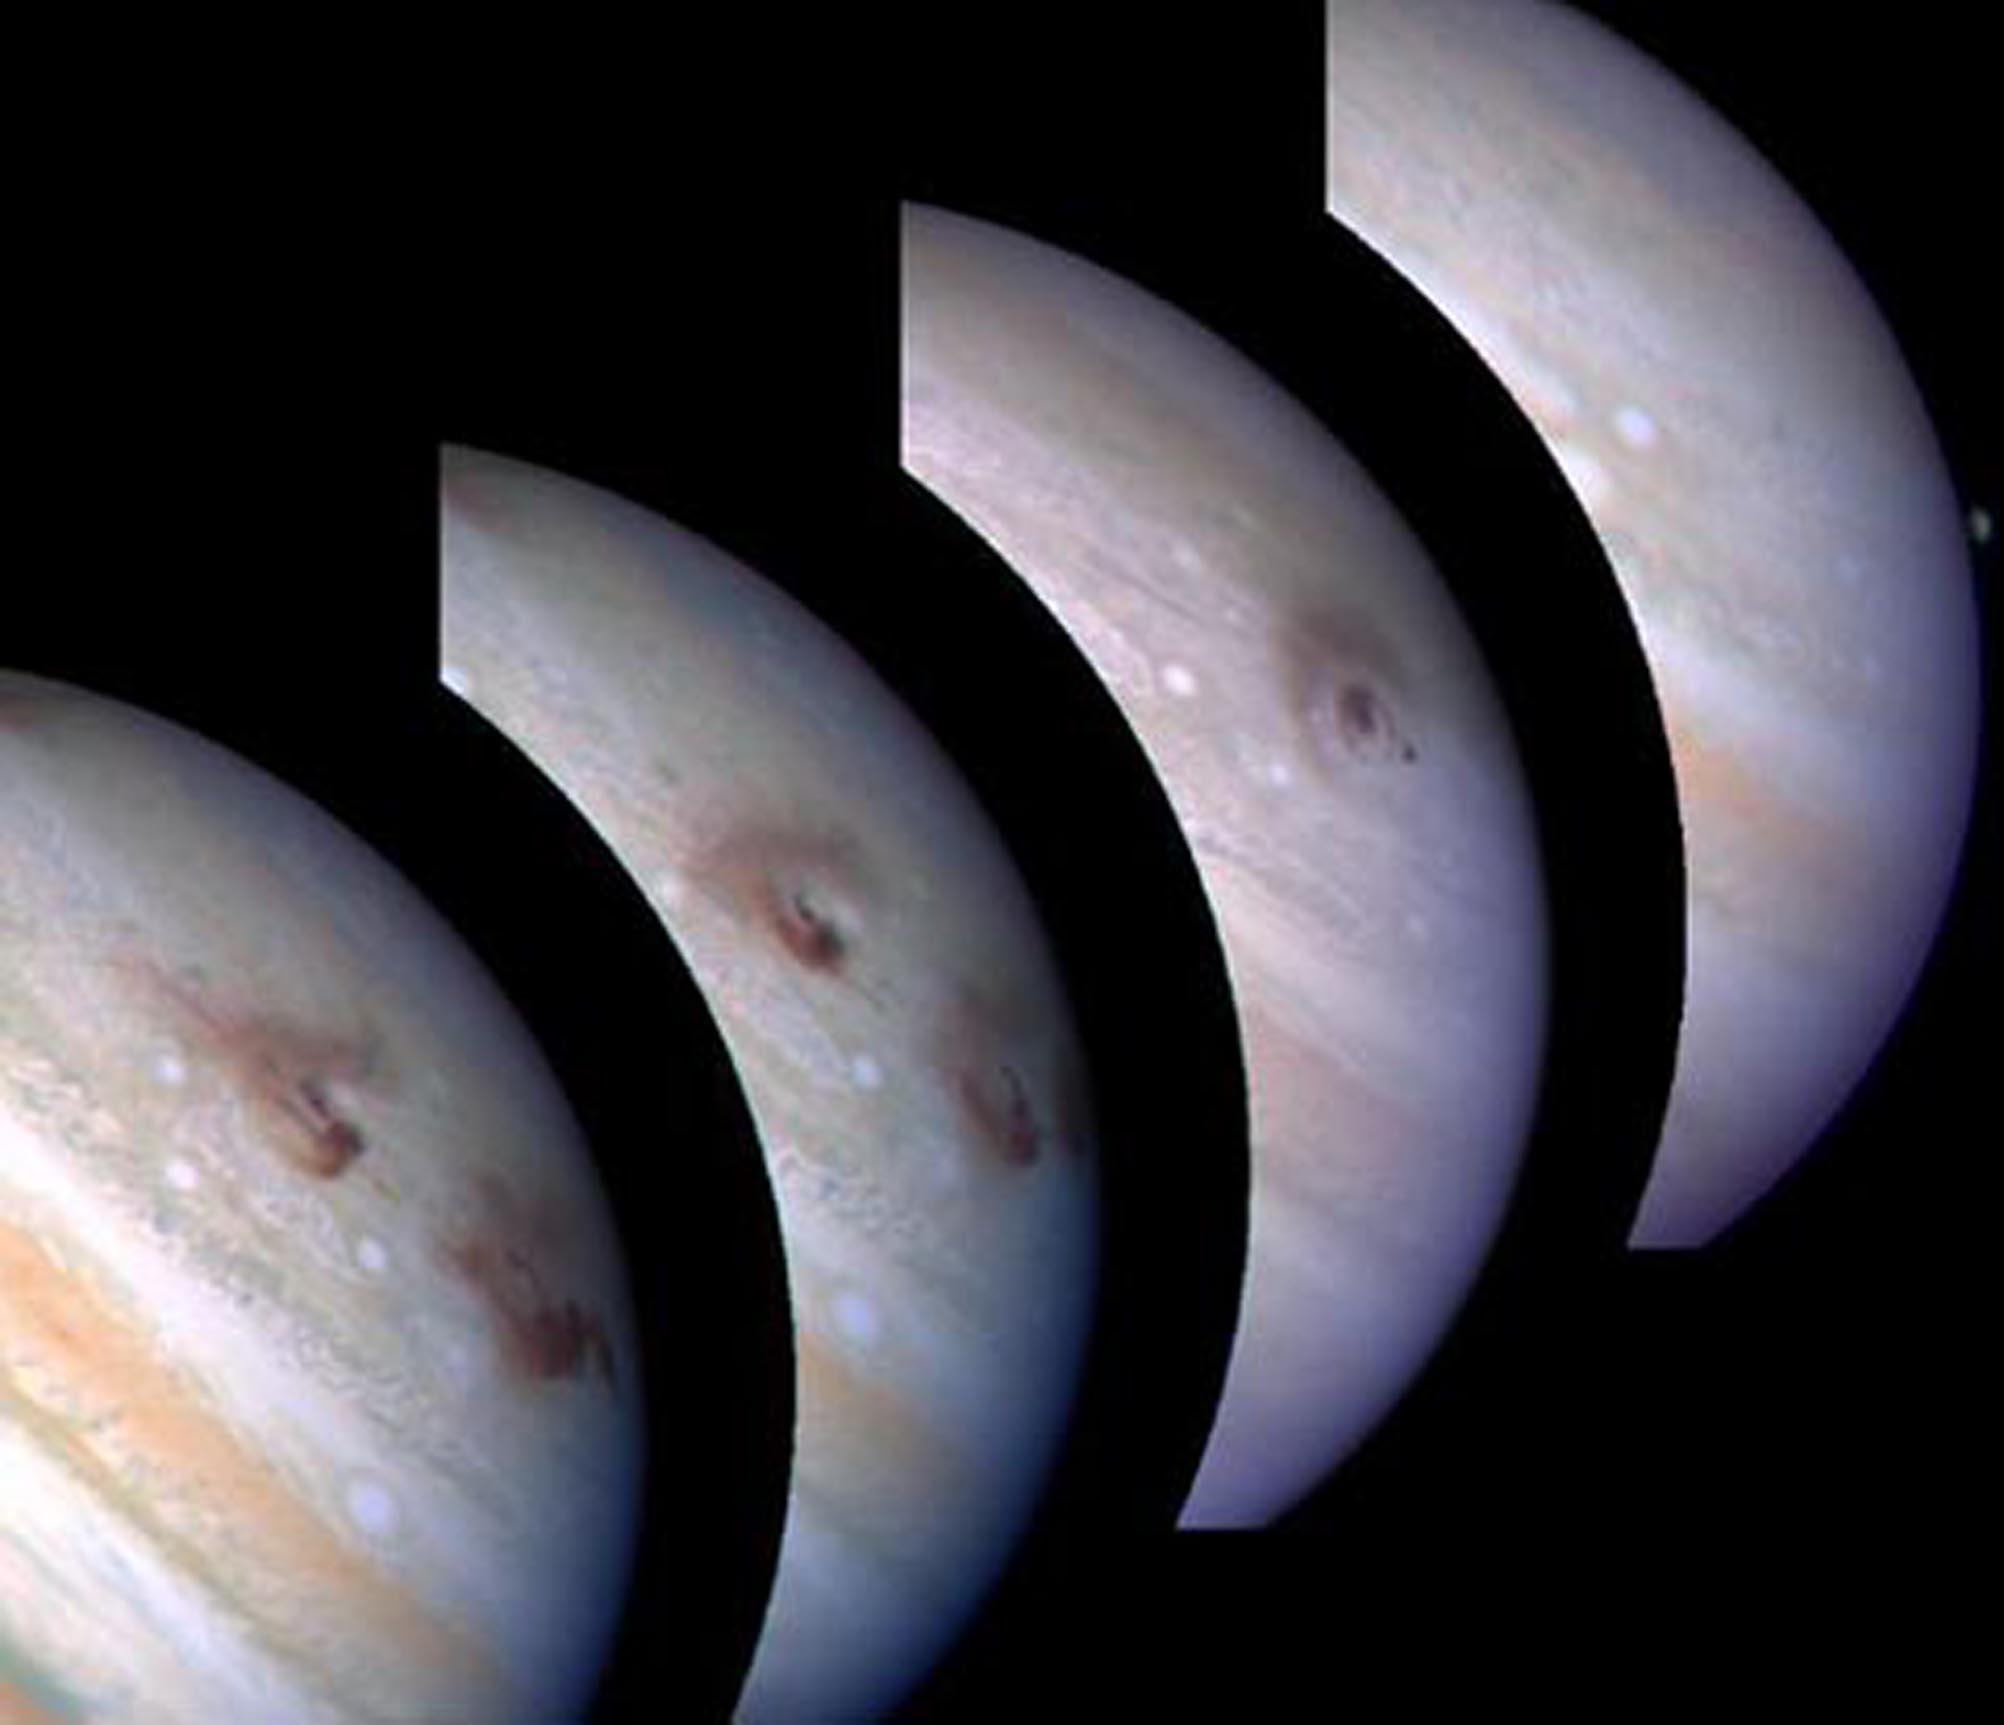
Pow: The July 1994 impact of Comet Shoemaker-Levy 9 on Jupiter, captured by the Hubble Space Telescope. Credit: R. Evans/J. Trauger/H. Hammel/HST Comet Science Team/NASA.
Pow: The July 1994 impact of Comet Shoemaker-Levy 9 on Jupiter, captured by the Hubble Space Telescope. Credit: R. Evans/J. Trauger/H. Hammel/HST Comet Science Team/NASA.
Are you keeping a eye on Jupiter? The King of the Planets, Jove presents a swirling upper atmosphere full of action, a worthy object of telescopic study as it heads towards another fine opposition on May 9th, 2018.
Now, an interesting international study out of the School of Engineering in Bilbao, Spain, the Astronomical Society of France, the Meath Astronomical Group in Dublin Ireland, the Astronomical Society of Australia, and the Esteve Duran Observatory in Spain gives us a fascinating and encouraging possibly, and another reason to keep a sharp eye on old Jove: Jupiter may just get smacked with asteroids on a more regular basis than previously thought.
The study is especially interesting, as it primarily focused in on flashes chronicled by amateur imagers and observers in recent years. In particular, researchers focused on impact events witnessed on March 17th 2016 and May 26th, 2017, along with the comparison of exogenous (of cosmic origin) dust measured in the upper atmosphere. This allowed researchers to come up with an interesting estimate: Jupiter most likely gets hit by an asteroid 5-20 meters in diameter (for comparison, the Chelyabinsk bolide was an estimated 20 meters across) 10 to 65 times every year, though researchers extrapolate that a dedicated search might only nab an impact flash or scar once every 0.4 to 2.4 years or so.
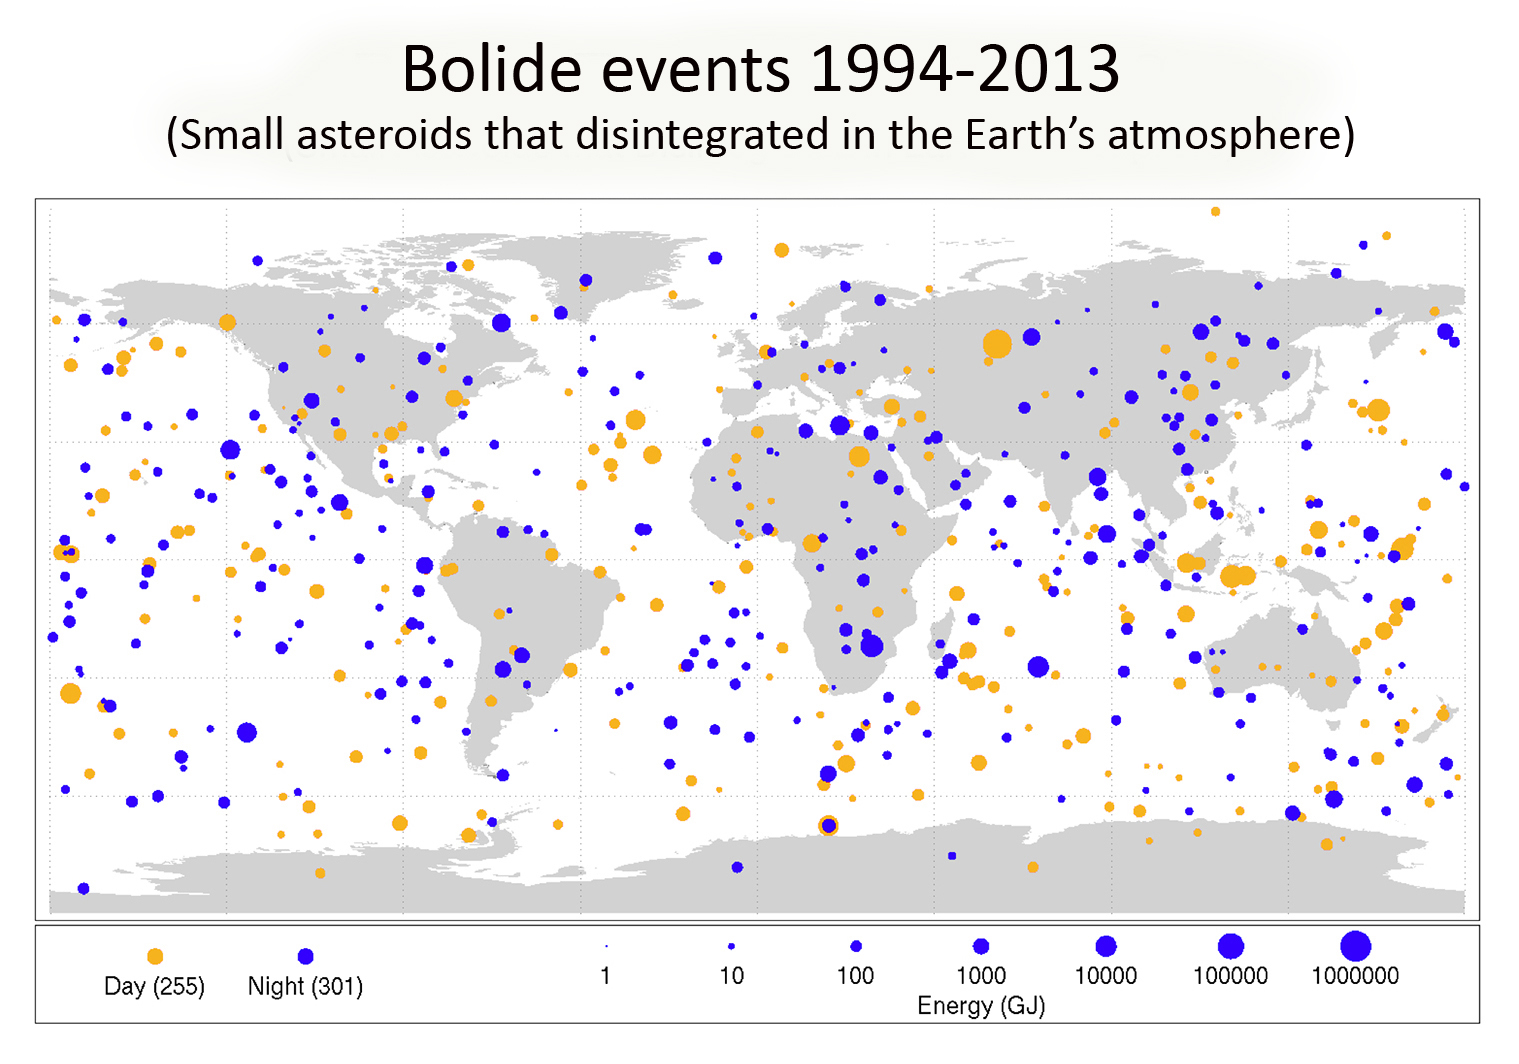
Compare this impact rate with the Earth, which gets hit by a Chelyabinsk-sized 20-meter impactor about once every half century or so. Incidentally, we know this impact rate on Earth better than ever before, largely due to U.S. Department of Defense classified assets in space continually watching for nuclear tests and missile launches, which also pick up an occasional meteor “photobomb.”
Small asteroid impacts over the span of the Earth over a 20 year period. NASA/Planetary Science.
One reason we may never have witnessed a meteor impact on Jupiter is, astronomers (both professional and amateur) never thought to look for them. The big wake-up call was the impact of Comet Shoemaker-Levy 9 in July 1994, an event witnessed by the newly refurbished Hubble Space Telescope as the resulting impact scars were easily visible in backyard telescopes for weeks afterward. Back in the day, speculation was rampant in the days leading up to the impact: would the collision be visible at all? Or would gigantic Jupiter simply gobble up the tiny comet fragments with nary a belch?
Australian amateur astronomer Anthony Wesley also caught an interesting impact (scar?) in 2009, and every few years or so, we get word of an elusive flash reported on the Jovian cloudtops, sometimes corroborated by a secondary independent observation or a resulting impact scar, and sometimes not.
An impact scar (top center on the disk) on Jupiter, captured on July 19th, 2009. Image credit: Anthony Wesley.
Of course, there are factors which will lower said ideal versus the actual observed impact rate. There’s always a month or so a year, for example, when Jupiter is near solar conjunction on the far side of the Sun, and out of range for observation. Also, we only see half of the Jovian disk from our Earthly perspective at any given time, and we’re about to lose our only set of eyes in orbit around Jupiter – NASA’s Juno spacecraft – later this summer, unless there’s a last minute mission extension.
On the plus side, however, Jupiter is a fast rotator, spinning on its axis once every 9.9 hours. This also means that near opposition, you can also track Jupiter through one full rotation in a single evening.
Finding Jupiter: looking eastward tonight at around 11PM local. Credit Stellarium.
Then there’s the planet’s location in the sky: Currently, Jupiter’s crossing the southern constellation of Libra, and opposition for Jove moves about one astronomical constellation eastward along the ecliptic a year. Jupiter will bottom out along the ecliptic in late 2019, and won’t pop back up north of the celestial equator until May 2022. And while it’s not impossible for northern observers to keep tabs on Jupiter when it’s down south, we certainly get more gaps in coverage around this time.
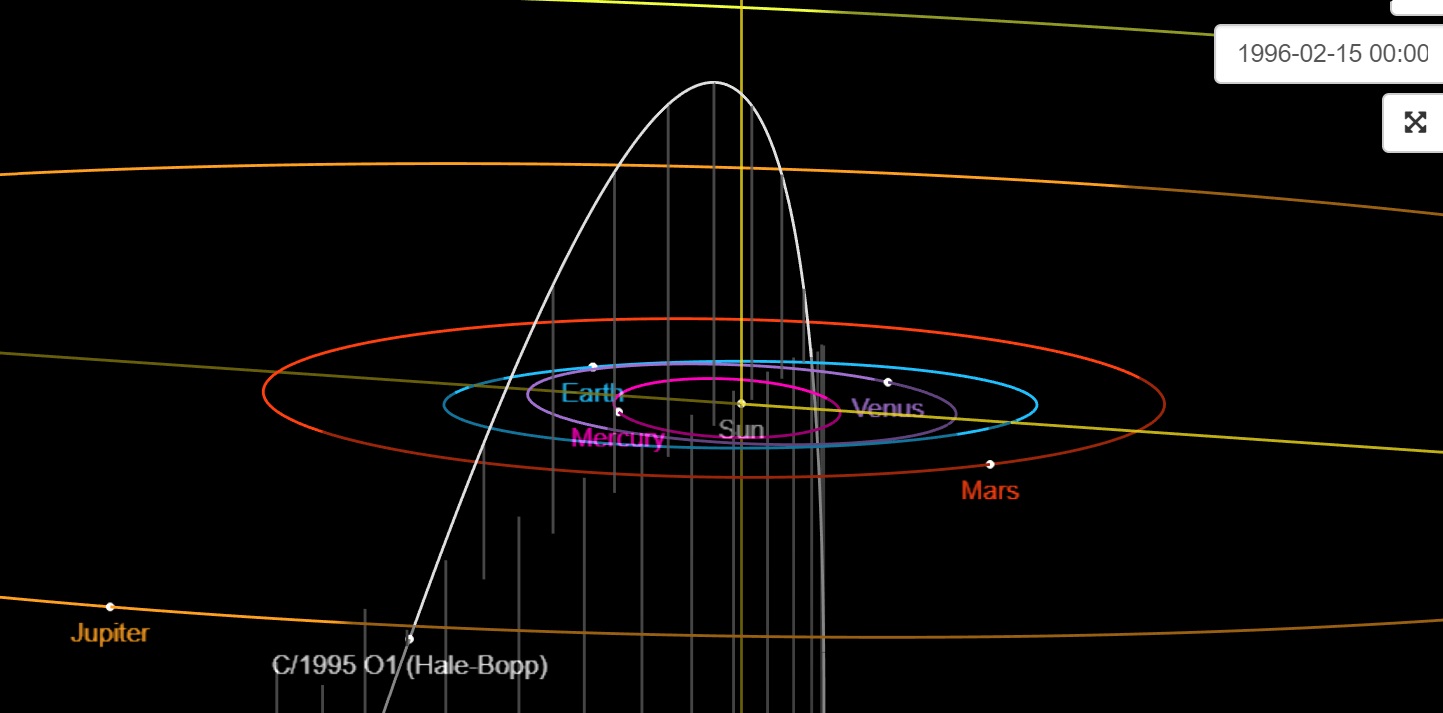
Hale-Bopp’s close inbound passage near Jupiter in 1996. Credit: NASA/JPL-Horizons.
Should we hail Jove as a protective ‘cosmic goal-tender,’ or fear it as the bringer of death and destruction? There are theories that Jupiter may be both: for example, Jupiter altered the inbound path of Comet Hale-Bopp in 1997, shortening its orbital period from 4,200 to 2,533 years. The 2000 book Rare Earth even included the hypothesis of Jupiter as a cosmic debris sweeper as one of the factors for why life evolved on Earth… if this is true, it’s an imperfect one, as Earth does indeed still get hit as well.
All reasons to keep an eye on Jupiter in the 2018 opposition season.
But just how many planets is TESS expected to find? That was the subject of a new study by a team researchers who attempted to estimate just how many planets TESS is likely to discover, as well as the physical properties of these planets and the stars that they orbit. Altogether, they estimate TESS will find thousands of planets orbiting a variety of stars during its two-year primary mission.
The study, titled “A Revised Exoplanet Yield from the Transiting Exoplanet Survey Satellite (TESS)“, recently appeared online. The study was led by Thomas Barclay, an associate research scientist at the NASA Goddard Space Flight Center and the University of Maryland, and included Joshua Pepper (an astrophysicist at Lehigh University) and Elisa Quintana (a research scientist with the SETI Institute and NASA Ames Research Center).
As Thomas Barclay told Universe Today via email:
“TESS builds off the legacy of Kepler. Kepler was primarily a statistical mission and taught us that planets are everywhere. However, it wasn’t optimized for finding excellent individual planets for further study. Now that we know planets are common, we can launch something like TESS to search for the planets that we will undertake intensive studies of using ground and space-based telescopes. Planets that TESS will find will on average be 10x closer and 100x brighter.”
For the sake of their study, the team created a three-step model that took into account the stars TESS will observe, the number of planets each one is likely to have, and the likelihood of TESS spotting them. These included the kinds of planets that would be orbiting around dwarf stars ranging from A-type to K-type (like our Sun), and lower-mass M-type (red dwarf) stars.
“To estimate how many planets TESS will find we took stars that will be observed by TESS and simulated a population of planets orbiting them,” said Barclay. “The exoplanet population stats all come from studies that used Kepler data. Then, using models of TESS performance, we estimated how many of those planets would be detected by TESS. This is where we get our yield numbers from.”
The first step was straightforward, thanks to the availability of the Candidate Target List (CTL) – a prioritized list of target stars that the TESS Target Selection Working Group determined were the most suitable stars for detecting small planets. They then ranked the 3.8 million stars that are included in the latest version based on their brightness and radius and determined which of these TESS is likely to observe.
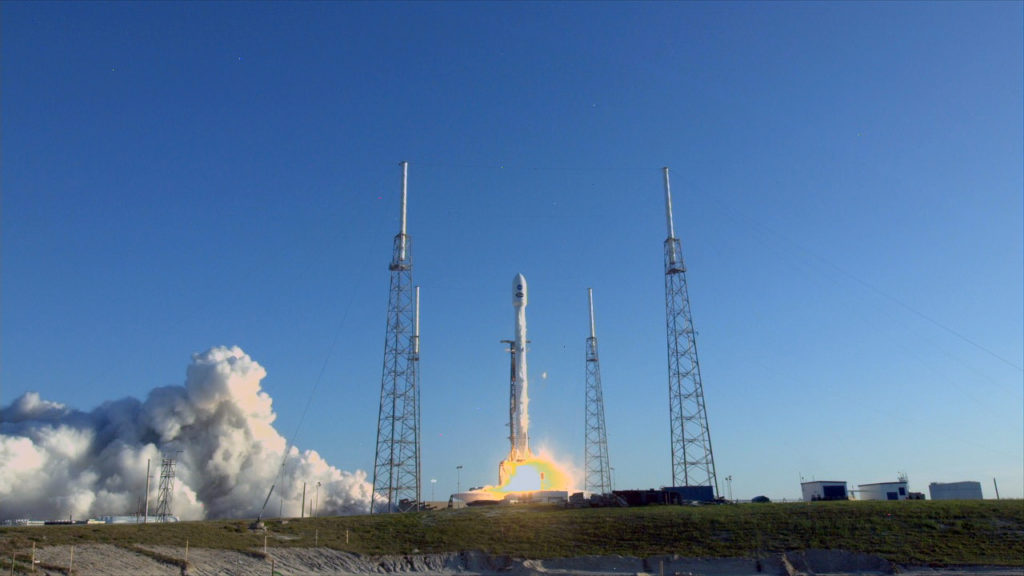
Liftoff of the SpaceX Falcon 9 rocket carrying NASA’s TESS spacecraft. Image credit: NASA TV
The second step consisted of assigning planets to each star based on a Poisson distribution, a statistical technique where a given number is assigned to each star (in this case, 0 or more). Each planet was then assigned six physical properties drawn at random, including an orbital period, a radius, an eccentricity, a periastron angle, an inclination to our line of sight, and a mid-time of first transit.
Last, they attempted to estimate how many of these planets would generate a detectable transit signal. As noted, TESS will rely on the Transit Method, where periodic dips in a star’s brightness are used to determine the presence of one or more orbiting planets, as well as place constraints on their sizes and orbital periods. For this, they considered the flux contamination of nearby stars, the number of transits, and the transit duration.
Ultimately, they determined with 90% confidence that TESS is likely to detect 4430–4660 new exoplanets during its two years mission:
“The results is that we predict that TESS will find more than 4000 planets, with hundreds smaller than twice the size of Earth. The primary goal of TESS is to find planets that are bright enough for ground-based telescope to measure their mass. We estimate that TESS could lead to triple the number of planets smaller than 4 Earth-radii with mass measurements.”
As of April 1st, 2018, a total 3,758 exoplanets have been confirmed in 2,808 systems, with 627 systems having more than one planet. In other words, Barclay and his team estimate that the TESS mission will effectively double the number of confirmed exoplanets and triple the number of Earth-sized and Super-Earth’s during its primary mission.
This will begin after a series of orbital maneuvers and engineering tests, which are expected to last for about two months. With the exoplanet catalog thus expanded, we can expect that there will be many more “Earth-like” candidates available for study. And while we still will not be able to determine if any of them have life, we may perhaps find some that show signs of a viable atmosphere and water on the surfaces.
The hunt for life beyond Earth will continue for many years to come! And in the meantime, be sure to enjoy this video about the TESS mission, courtesy of NASA:


