Metal-Eating Bacteria Could Have Left their “Fingerprints” on Mars, Proving it Once Hosted Life

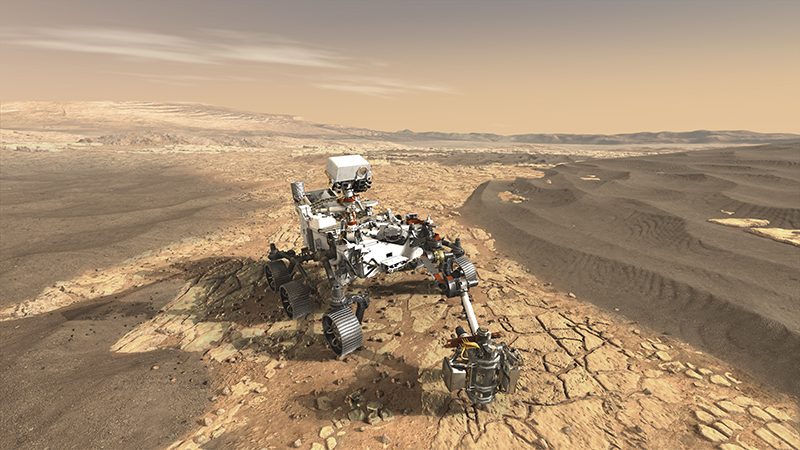
Future missions could determine the presence of past life on Mars by looking for signs of extreme metal-metabolizing bacteria. Credit: NASA.

Today, there are multiple lines of evidence that indicate that during the Noachian period (ca. 4.1 to 3.7 billion years ago), microorganisms could have existed on the surface of Mars. These include evidence of past water flows, rivers and lakebeds, as well as atmospheric models that indicate that Mars once had a denser atmosphere. All of this adds up to Mars having once been a warmer and wetter place than it is today.

However, to date, no evidence has been found that life ever existed on Mars. As a result, scientists have been trying to determine how and where they should look for signs of past life. According to a new study by a team of European researchers, extreme lifeforms that are capable of metabolizing metals could have existed on Mars in the past. The “fingerprints” of their existence could be found by looking at samples of Mars’ red sands.

For the sake of their study, which recently appeared in the scientific journal Frontiers of Microbiology, the team created a “Mars Farm” to see how a form of extreme bacteria might fare in an ancient Martian environment. This environment was characterized by a comparatively thin atmosphere composed of mainly of carbon dioxide, as well as simulated samples of Martian regolith.

Metallosphaera sedula grown on synthetic Martian Regolith. The microbes are specifically stained by Fluorescence-In-Situ-Hybridization (FISH). Credit: Tetyana Milojevic

They then introduced a strain of bacteria known as Metallosphaera sedula, which thrives in hot, acidic environments. In fact, the bacteria’s optimal conditions are those where temperatures reach 347.1 K (74 °C; 165 °F)  and pH levels are 2.0 (between lemon juice and vinegar). Such bacteria are classified as chemolithotrophs, which means that they are able to metabolize inogranic metals – like iron, sulfur and even uranium.

These stains of bacteria were then added to the samples of regolith that were designed to mimic conditions in different locations and historical periods on Mars. First, there was sample MRS07/22, which consisted of a highly-porous type of rock that is rich in silicates and iron compounds. This sample simulated the kinds of sediments found on the surface of Mars.

Then there was P-MRS, a sample that was rich in hydrated minerals, and the sulfate-rich S-MRS sample, which mimic Martian regolith that was created under acidic conditions. Lastly, there was the sample of JSC 1A, which was largely composed of the volcanic rock known as palagonite. With these samples, the team was able to see exactly how the presence of extreme bacteria would leave biosignatures that could be found today.

As Tetyana Milojevic – an Elise Richter Fellow with the Extremophiles Group at the University of Vienna and a co-author on the paper – explained in a University of Vienna press release:

“We were able to show that due to its metal oxidizing metabolic activity, when given an access to these Martian regolith simulants, M. sedula actively colonizes them, releases soluble metal ions into the leachate solution and alters their mineral surface leaving behind specific signatures of life, a ‘fingerprint’, so to say.”

Microspheroids containing mostly aluminium and chlorine overgrow the mineral surface of synthetic Mars regolith. These microspheroids can only be observed after cultivation of Metallosphaera sedula Credit: Tetyana Milojevic

The team then examined the samples of regolith to see if they had undergone any bioprocessing, which was possible thanks to the assistance of Veronika Somoza – a chemist from the University of Vienna’s Department of Physiological Chemistry and a co-author on the study. Using an electron microscope, combined with analytical spectroscopy technique, the team sought to determine if metals with the samples had been consumed.

In the end, the sets of microbiological and mineralogical data they obtained showed signs of free soluble metals, which indicated that the bacteria had effectively colonized the regolith samples and metabolized some of the metallic minerals within. As Milojevic indicated:

“The obtained results expand our knowledge of biogeochemical processes of possible life beyond Earth, and provide specific indications for detection of biosignatures on extraterrestrial material – a step further to prove potential extra-terrestrial life.”

In effect, this means that extreme bacteria could have existed on Mars billions of years ago. And thanks to the state of Mars today – with its thin atmosphere and lack of precipitation – the biosignatures they left behind (i.e. traces of free soluble metals) could be preserved within Martian regolith. These biosignatures could therefore be detected by upcoming sample-return missions, such as the Mars 2020 rover.
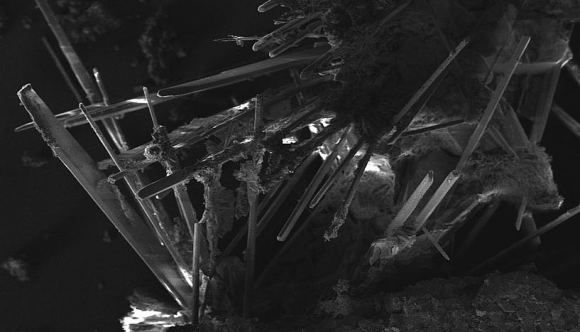
Biotransformed synthetic Martian Regolith after Metallosphaera sedula cultivation. Credit: Tetyana Milojevic

In addition to pointing the way towards possible indications of past life on Mars, this study is also significant as far as the hunt for life on other planets and star systems is concerned. In the future, when we are able to study extra-solar planets directly, scientists will likely be looking for signs of biominerals. Among other things, these “fingerprints” would be a powerful indicator of the existence of extra-terrestrial life (past or present).

Studies of extreme lifeforms and the role they play in the geological history of Mars and other planets is also helpful in advancing our understanding of how life emerged in the early Solar System. On Earth too, extreme bacteria played an important role in turning the primordial Earth into a habitable environment, and play an important role in geological processes today.

Last, but not least, studies of this nature could also pave the way for biomining, a technique where strains of bacteria extract metals from ores. Such a process could be used for the sake of space exploration and resource exploitation, where colonies of bacteria are sent out to mine asteroids, meteors and other celestial bodies.

Further Reading: University of Vienna, Frontiers in Microbiology

Flowing Water on Mars Likely Cold and Frosty, Says New Study

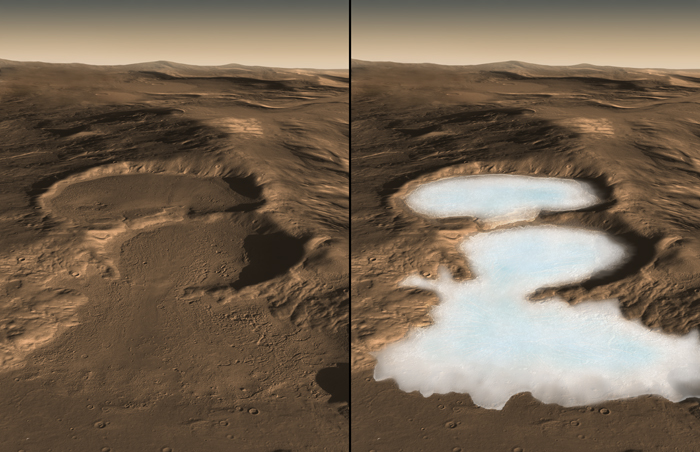
In the past, glaciers may have existed on the surface of Mars, providing meltwater during the summer to create the features we see today. Credit: NASA/Caltech/JPL/UTA/UA/MSSS/ESA/DLR Eric M. De Jong, Ali Safaeinili, Jason Craig, Mike Stetson, Koji Kuramura, John W. Holt

Thanks to decades of exploration using robotic orbiter missions, landers and rovers, scientists are certain that billions of years ago, liquid water flowed on the surface of Mars. Beyond that, many questions have remained, which include whether or not the waterflow was intermittent or regular. In other words, was Mars truly a “warm and wet” environment billions of years ago, or was it more along the lines of “cold and icy”?

These questions have persisted due to the nature of Mars’ surface and atmosphere, which offer conflicitng answers. According to a new study from Brown University, it appears that both could be the case. Basically, early Mars could have had significant amounts of surface ice which experienced periodic melting, producing enough liquid water to carve out the ancient valleys and lakebeds seen on the planet today.

The study, titled “Late Noachian Icy Highlands Climate Model: Exploring the Possibility of Transient Melting and Fluvial/Lacustrine Activity Through Peak Annual and Seasonal Temperatures“, recently appeared in Icarus. Ashley Palumbo – a Ph.D. student with Brown’s Department of Earth, Environmental and Planetary Science – led the study and was joined by her supervising professor (Jim Head) and Professor Robin Wordsworth of Harvard University’s School of Engineering and Applied Sciences.

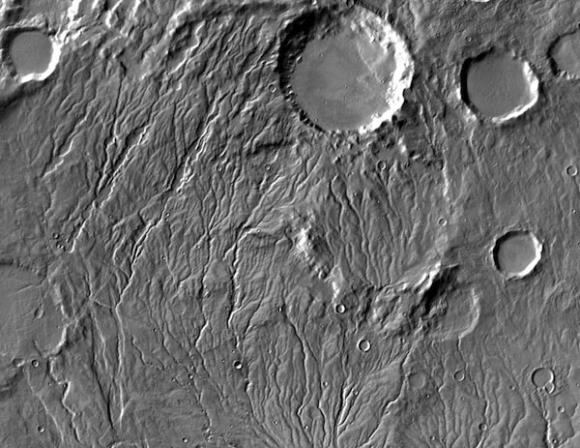
Extensive valley networks spidering through the southern highlands of Mars suggest that the planet was once warmer and wetter. Credit: NASA/JPL-Caltech/Arizona State University

For the sake of their study, Palumbo and her colleagues sought to find the bridge between Mars’ geology (which suggests the planet was once warm and wet) and its atmospheric models, which suggest it was cold and icy. As they demonstrated, it’s plausible that during the past, Mars was generally frozen over with glaciers. During peak daily temperatures in the summer, these glaciers would melt at the edges to produce flowing water.
After many years, they concluded, these small deposits of meltwater would have been enough to carve the features observed on the surface today. Most notably, they could have carved the kinds of valley networks that have been observed on Mars southern highlands. As Palumbo explained in a Brown University press release, their study was inspired by similar climate dynamics that take place here on Earth:

“We see this in the Antarctic Dry Valleys, where seasonal temperature variation is sufficient to form and sustain lakes even though mean annual temperature is well below freezing. We wanted to see if something similar might be possible for ancient Mars.”

To determine the link between the atmospheric models and geological evidence, Palumbo and her team began with a state-of-the-art climate model for Mars. This model assumed that 4 billion years ago, the atmosphere was primarily composed of carbon dioxide (as it is today) and that the Sun’s output was much weaker than it is now. From this model, they determined that Mars was generally cold and icy during its earlier days.

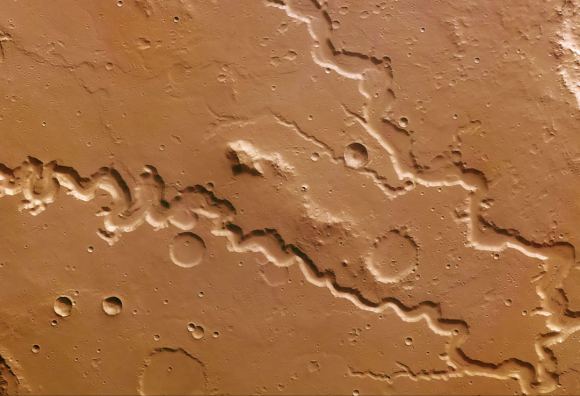
Nanedi Valles, a roughly 800-kilometre valley extending southwest-northeast and lying in the region of Xanthe Terra, southwest of Chryse Planitia. Credit: ESA/DLR/FU Berlin (G. Neukum)

However, they also included a number of variables which may have also been present on Mars 4 billion years ago. These include the presence of a thicker atmosphere, which would have allowed for a more significant greenhouse effect. Since scientists cannot agree how dense Mars’ atmosphere was between 4.2 and 3.7 billion years ago, Palumbo and her team ran the models to take into account various plausible levels of atmospheric density.

They also considered variations in Mars’ orbit that could have existed 4 billion years ago, which has also been subject to some guesswork. Here too, they tested a wide range of plausible scenarios, which included differences in axial tilt and different degrees of eccentricity. This would have affected how much sunlight is received by one hemisphere over another and led to more significant seasonal variations in temperature.

In the end, the model produced scenarios in which ice covered regions near the location of the valley networks in the southern highlands. While the planet’s mean annual temperature in these scenarios was well below freezing, it also produced peak summertime temperatures in the region that rose above freezing. The only thing that remained was to demonstrate that the volume of water produced would be enough to carve those valleys.

Luckily, back in 2015, Professor Jim Head and Eliot Rosenberg (an undergraduate with Brown at the time) created a study which estimated the minimum amount of water required to produce the largest of these valleys. Using these estimates, along with other studies that provided estimates of necessary runoff rates and the duration of valley network formation, Palumbo and her colleagues found a model-derived scenario that worked.

Was Mars warm and watery (i.e. a blue planet?) or an ice ball that occasionally experienced melting? Credit: Kevin Gill

Basically, they found that if Mars had an eccentricity of 0.17 (compared to it’s current eccentricity of 0.0934) an axial tilt of 25° (compared to 25.19° today), and an atmospheric pressure of 600 mbar (100 times what it is today) then it would have taken about 33,000 to 1,083,000 years to produce enough meltwater to form the valley networks. But assuming for a circular orbit, an axial tile of 25°, and an atmosphere of 1000 mbar, it would have taken about 21,000 to 550,000 years.

The degrees of eccentricity and axial tilt required in these scenarios are well within the range of possible orbits for Mars 4 billion years ago. And as Head indicated, this study could reconcile the atmospheric and geological evidence that has been at odds in the past:

“This work adds a plausible hypothesis to explain the way in which liquid water could have formed on early Mars, in a manner similar to the seasonal melting that produces the streams and lakes we observe during our field work in the Antarctic McMurdo Dry Valleys. We are currently exploring additional candidate warming mechanisms, including volcanism and impact cratering, that might also contribute to melting of a cold and icy early Mars.”

It is also significant in that it demonstrates that Mars climate was subject to variations that also happen regularly here on Earth. This provides yet another indication of how our two plane’s are similar in some ways, and how research of one can help advance our understanding of the other. Last, but not least, it offers some synthesis to a subject that has produced a fair share of disagreement.

The subject of how Mars could have experienced warm, flowing water on its surface – and at a time when the Sun’s output was much weaker than it is today – has remained the subject of much debate. In recent years, researchers have advanced various suggestions as to how the planet could have been warmed, ranging from cirrus clouds to periodic bursts of methane gas from beneath the surface.

While this latest study has not quite settled the debate between the “warm and watery” and the “cold and icy” camps, it does offer compelling evidence that the two may not be mutually exclusive. The study was also the subject of a presentation made at the 48th Lunar and Planetary Science Conference, which took place from March 20th to 24th in The Woodland, Texas.

Further Reading: Brown University, Icarus

Messier 58 – the NGC 4579 Barred Spiral Galaxy

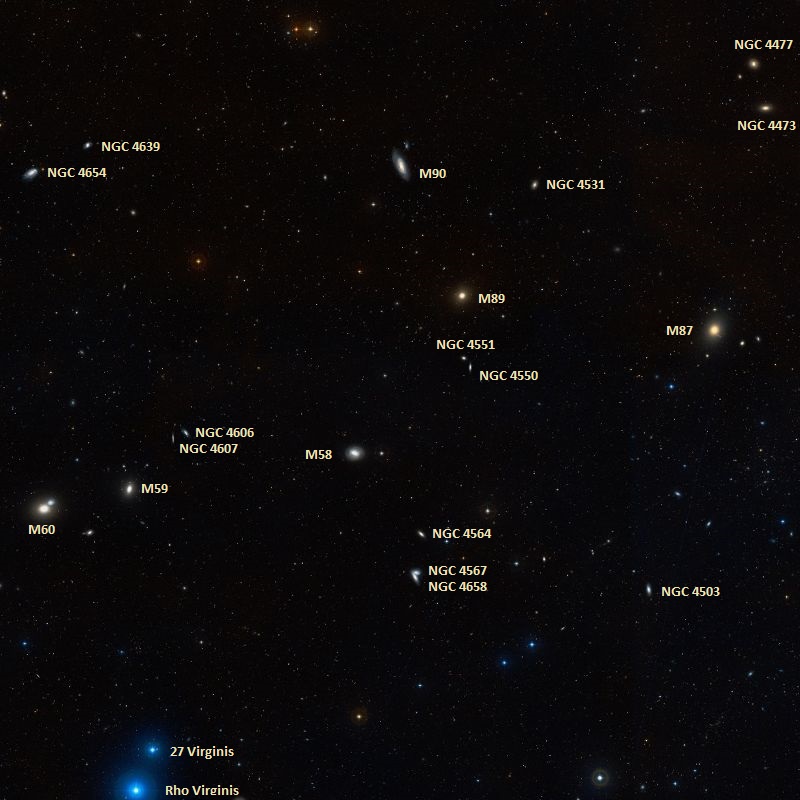
The galaxies of Messier 58, Messier 59, Messier 60, Messier 87, Messier 89 and Messier 90. Credit: Wikisky

Welcome back to Messier Monday! Today, we continue in our tribute to our dear friend, Tammy Plotner, by looking at the barred spiral galaxy, Messier 58.

In the 18th century, while searching the night sky for comets, French astronomer Charles Messier kept noting the presence of fixed, diffuse objects in the night sky. In time, he would come to compile a list of approximately 100 of these objects, with the purpose of making sure that astronomers did not mistake them for comets. However, this list – known as the Messier Catalog – would go on to serve a more important function, becoming one of the first catalogs of Deep Sky Objects.

One of these objects is the intermediate barred spiral galaxy known as Messier 58, which is located approximately 68 million light years away in the Virgo constellation. In addition to being one of just four barred spiral galaxies in the Messier Catalog, it is also one of the brightest galaxies in the Virgo Supercluster. Due to its proximity in the sky to other objects in the Virgo Galaxy Field, it can be seen only with the help of a telescope or a pair of large binoculars.

Description:

This beautiful old barred spiral galaxy located approximately 68 million light-years from Earth. Although it might appear pretty plain, it has some great things going for it… namely an active galactic nucleus. As Marcella Contini indicated in a 2004 study:

“We have modelled the low-luminosity active galactic nuclei (AGN) NGC 4579 by explaining both the continuum and the line spectra observed with different apertures. It was found that the nuclear emission is dominated by an AGN such that the flux from the active centre (AC) is relatively low compared with that of the narrow emission-line region (NLR) of Seyfert galaxies. However, the contribution of a young starburst cannot be neglected, as well as that of shock-dominated clouds with velocities of 100, 300 and 500kms-1. A small contribution from an older starburst with an age of 4.5 Myr, probably located in the external nuclear region, is also found. HII regions appear in the extended regions, where radiation and shock-dominated clouds prevail.

“The continuum SED of NGC 4579 is characterized by the strong flux from an old stellar population. Emissions in the radio range show synchrotron radiation from the base of the jet outflowing from the accretion disc within 0.1 pc from the active centre. Radio emission within intermediate distances is explained by the bremsstrahlung from gas downstream of low-velocity shocks reached by a relatively low radiation flux from the AC. In extended regions the radio emission is synchrotron radiation created by the Fermi mechanism at the shock front. The shocks are created by collision of clouds with the jet. All types of emissions observed at different radius from the centre can be reconciled with the presence of the jet.”

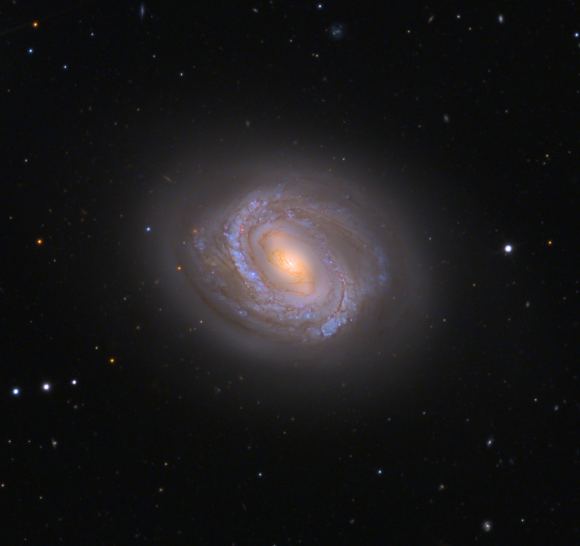
The Messier 58 barred spiral galaxy. Credit: Adam Block/Mount Lemmon SkyCenter/University of Arizona

Yet where is this gas traveling to and why? According to 2014 study by S. Garcia-Burillo (et al):

“We created a complete gravity torque map of the disk of the LINER/Seyfert 1.9 galaxy NGC 4579. We quantify the efficiency of angular momentum transport and search for signatures of secular evolution in the fueling process from r ~ 15 kpc down to the inner r ~ 50 pc around the active galactic nucleus (AGN). The derived gravity torque budget in NGC 4579 shows that inward gas flow is occurring on different spatial scales in the disk. In the outer disk, the decoupling of the spiral allows the gas to efficiently populate the UHR region, and thus produce net gas inflow on intermediate scales. The co rotation barrier seems to be overcome by secular evolution processes. The gas in the inner disk is efficiently funneled by gravity torques down to r ~ 300 pc. Closer to the AGN, gas feels negative torques due to the combined action of the large-scale bar and the inner oval. The two m=2 modes act in concert to produce net gas inflow down to r ~ 50 pc, providing clear smoking gun evidence of inward gas transport on short dynamical timescales.”

What causes inward transport of gases? Why, a massive gravity pull of course. And what could be more gravitational attractive than a black hole! As Eliot Quataert (et al) indicated in their 1999 study:

“M81 and NGC 4579 are two of the few low-luminosity active galactic nuclei which have an estimated mass for the central black hole, detected hard X-ray emission, and detected optical/UV emission. In contrast to the canonical “big blue bump,” both have optical/UV spectra which decrease with increasing frequency in a plot. Barring significant reddening by dust and/or large errors in the black hole mass estimates, the optical/UV spectra of these systems require that the inner edge of a geometrically thin, optically thick, accretion disk lies at roughly 100 Schwarzschild radii. The observed X-ray radiation can be explained by an optically thin, two temperature, advection-dominated accretion flow at smaller radii.”

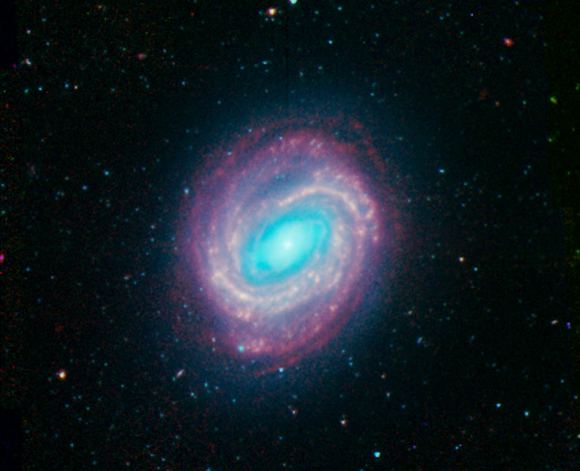
Galaxy NGC 4579 was captured by the Spitzer Infrared Nearby Galaxy Survey (SINGS) Legacy Project using the Spitzer Space Telescope’s Infrared Array Camera (IRAC). In this image, the red structures are areas where gas and dust are thought to be forming new stars, while the blue light comes from mature stars. This SINGS image is a four-channel, false-color composite, where blue indicates emission at 3.6 microns, green corresponds to 4.5 microns, and red to 5.8 and 8.0 microns. The contribution from starlight (measured at 3.6 microns) in this picture has been subtracted from the 5.8 and 8 micron images to enhance the visibility of the dust features.

Messier 58 (NGC 4579), as imaged by the Spitzer Infrared Nearby Galaxy Survey (SINGS) Legacy Project using the Spitzer Space Telescope’s Infrared Array Camera (IRAC). Credit: NASA/JPL-Caltech/R. Kennicutt (University of Arizona) and the SINGS Team

History of Observation:

When Charles Messier discovered this one on April 15, 1779, I’m sure he didn’t know he was looking back into time when he wrote:

“Very faint nebula discovered in Virgo, almost on the same parallel as Epsilon, 3rd mag. The slightest light for illuminating the micrometer wires makes it disappear. M. Messier reported it on the chart of the Comet of 1779, which is located in the volume of the Academy for the same year.”

Messier 58 may not have been a comet, but it certainly was another distant cousin of our own Milky Way!

Locating Messier 58:

Finding M58 requires a telescope or large binoculars, and lots of patience. Because the Virgo Galaxy field contains so many galaxies which can easily be misidentified, it is sometimes easier to “hop” from one galaxy to the next! In this case, we need to start by locating bright Vindemiatrix (Epsilon Virginis) almost due east of Denebola. Let’s hop four and a half degrees west and a shade north of Epsilon to locate one of the largest elliptical galaxies presently known – M60.

At a little brighter than magnitude 9, this galaxy could be spotted with binoculars, but stick with your telescope. In the same low power field (depending on aperture size) you may also note faint NGC 4647 which only appears to be interacting with M60. Also in the field to the west (the direction of drift) is our next Messier, bright cored elliptical M59. Now we will need to continue about an average eyepiece field of view, or a degree further west of this group to bring you to our “galactic twin”, fainter M58.

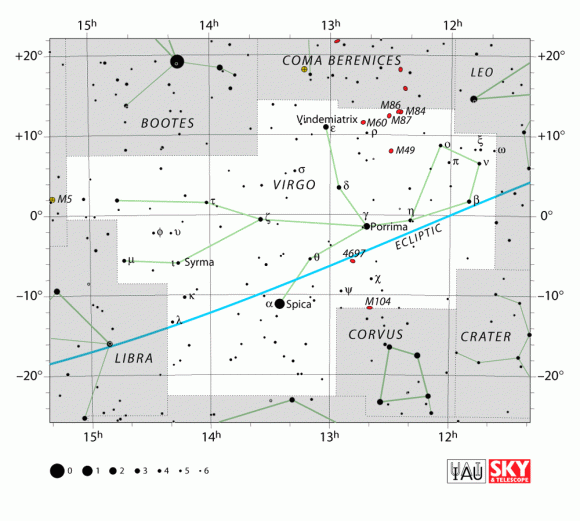
The location of M58, in the direction of the Virgo constellation. Credit: IAU

In a smaller telescope, do not expect to see much. What will appear at low power is a tiny egg-shaped patch of contrast change. As aperture increases, so does detail and a bright nucleus will begin to appear as you move into the 4-6″ size range and dark sky locations. As with all galaxies, dark skies are a must!

And here are the quick facts on this object to help you get started:

Object Name: Messier 58
Alternative Designations: M58, NGC 4579
Object Type: SBc Galaxy
Constellation: Virgo
Right Ascension: 12 : 37.7 (h:m)
Declination: +11 : 49 (deg:m)
Distance: 60000 (kly)
Visual Brightness: 9.7 (mag)
Apparent Dimension: 5.5×4.5 (arc min)

We have written many interesting articles about Messier Objects here at Universe Today. Here’s Tammy Plotner’s Introduction to the Messier ObjectsM1 – The Crab Nebula, and David Dickison’s articles on the 2013 and 2014 Messier Marathons.

Be to sure to check out our complete Messier Catalog. And for more information, check out the SEDS Messier Database.

Sources:

Scientists Find Evidence of Extreme Methane Storms On Titan

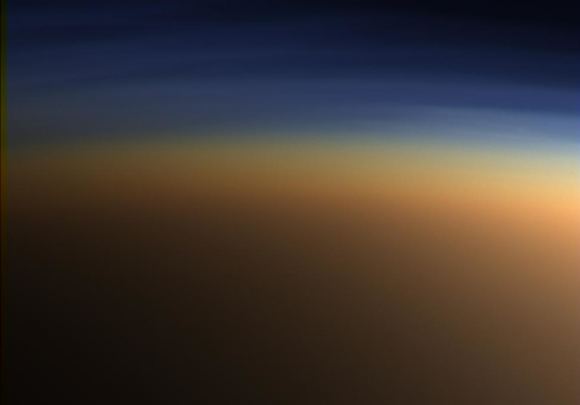
Titan's atmosphere makes Saturn's largest moon look like a fuzzy orange ball in this natural-color view from the Cassini spacecraft. Cassini captured this image in 2012. Image Credit: NASA/JPL-Caltech/Space Science Institute
According to a study from UCLA, Titan experiences severe methane rainstorms, leading to a the alluvial fans found found in both hemispheres. Credit: NASA/JPL-Caltech/Space Science Institute

Saturn’s largest moon, Titan, is a mysterious place; and the more we learn about it, the more surprises it seems to have in store. Aside from being the only body beyond Earth that has a dense, nitrogen-rich atmosphere, it also has methane lakes on its surface and methane clouds in its atmosphere. This hydrological-cycle, where methane is converted from a liquid to a gas and back again, is very similar to the water cycle here on Earth.

Thanks to the NASA/ESA Cassini-Huygens mission, which concluded on September 15th when the craft crashed into Saturn’s atmosphere, we have learned a great deal about this moon in recent years. The latest find, which was made by a team of UCLA planetary scientists and geologists, has to do with Titan’s methane rain storms. Despite being a rare occurrence, these rainstorms can apparently become rather extreme.

The study which details their findings, titled “Regional Patterns of Extreme Precipitation on Titan Consistent with Observed Alluvial Fan Distribution“, recently appeared in the scientific journal Nature Geoscience. Led by Saun P. Faulk, a graduate student at UCLA’s Department of Earth, Planetary, and Space Sciences, the team conducted simulations of Titan’s rainfall to determine how extreme weather events have shaped the moon’s surface.

Image of Titan’s atmosphere, snapped by the Cassini spacecraft. Credit: NASA/JPL/Space Science Institute

What they found was that the extreme methane rainstorms may imprint the moon’s icy surface in much the same way that extreme rainstorms shape Earth’s rocky surface. On Earth, intense rainstorms play an important role in geological evolution. When rainfall is heavy enough, storms can trigger large flows of water that transport sediment into low lands, where it forms cone-shaped features known as alluvial fans.

During it’s mission, the Cassini orbiter found evidence of similar features on Titan using its radar instrument, which suggested that Titan’s surface could be affected by intense rainfall. While these fans are a new discovery, scientists have been studying the surface of Titan ever since Cassini first reached the Saturn system in 2006. In that time, they have noted several interesting features.

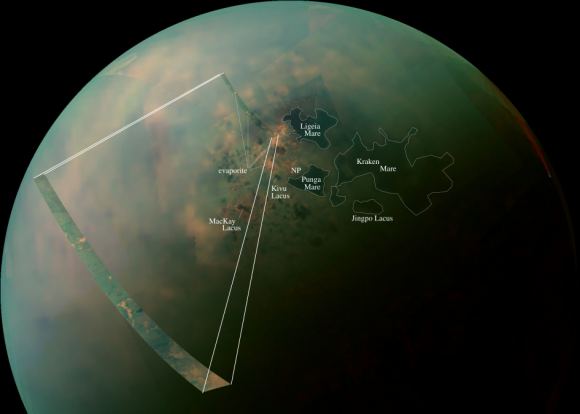
These included the vast sand dunes that dominate Titan’s lower latitudes and the methane lakes and seas that dominate it’s higher latitudes – particularly around the  northern polar region. The seas – Kraken Mare, Ligeia Mare, and Punga Mare – measure hundreds of km across and up to several hundred meters deep, and are fed by branching, river-like channels. There are also many smaller, shallower lakes that have rounded edges and steep walls, and are generally found in flat areas.

In this case, the UCLA scientists found that the alluvial fans are predominantly located between 50 and 80 degrees latitude. This puts them close to the center of the northern and southern hemispheres, though slightly closer to the poles than the equator. To test how Titan’s own rainstorms could cause these features, the UCLA team relied on computer simulations of Titan’s hydrological cycle.

False-color mosaic of Titan’s northern lakes, made from infrared data collected by NASA’s Cassini spacecraft. Credit: NASA

What they found was that while rain mostly accumulates near the poles – where Titan’s major lakes and seas are located – the most intense rainstorms occur near 60 degrees latitude. This corresponds to the region where alluvial fans are most heavily concentrated, and indicates that when Titan does experience rainfall, it is quite extreme – like a seasonal monsoon-like downpour.

As Jonathan Mitchell – a UCLA associate professor of planetary science and a senior author of the study – indicated, this is not dissimilar to some extreme weather events that were recently experienced here on Earth. “The most intense methane storms in our climate model dump at least a foot of rain a day, which comes close to what we saw in Houston from Hurricane Harvey this summer,” he said.

The team also found that on Titan, methane rainstorms are rather rare, occurring less than once per Titan year – which works out to 29 and a half Earth years. But according to Mitchell, who is also the principal investigator of UCLA’s Titan climate modeling research group, this is more often than they were expecting. “I would have thought these would be once-a-millennium events, if even that,” he said. “So this is quite a surprise.”

In the past, climate models of Titan have suggested that liquid methane generally concentrates closer to the poles. But no previous study has investigated how precipitation might cause sediment transport and erosion, or shown how this would account for various features observed on the surface. As a result, this study also suggests that regional variations in surface features could be caused by regional variations in precipitation.

On top of that, this study is an indication that Earth and Titan have even more in common than previously thought. On Earth, contrasts in temperature are what lead to intense seasonal weather events. In North America, tornadoes occur during the early to late Spring, while blizzards occur during the winter. Meanwhile, temperature variations in the Atlantic ocean are what lead to hurricanes forming between the summer and fall.

Similarly, it appears that on Titan, serious variations in temperature and moisture are what triggers extreme weather. When cooler, wetter air from the higher latitudes interacts with warmer, drier air from the lower latitudes, intense rainstorms result. These findings are also significant when it comes to other bodies in our Solar System that  have alluvial fans on them – such as Mars.

In the end, understanding the relationship between precipitation and planetary surfaces could lead to new insights about the impact climate change has on Earth and the other planets. Such knowledge would also go a long way towards helping us mitigate the effects it is having here on Earth, where the changes are only unnatural, but also sudden and very hazardous.

And who knows? Someday, it could even help us to alter the environments on other planets and bodies, thus making them more suitable for long-term human settlement (aka. terraforming)!

Further Reading: UCLA, Nature

Astronomers Find the Missing Normal Matter in the Universe, Still Looking for Dark Matter, Though

The structure of the universe at the largest scale. Credit: NASA, ESA, and E. Hallman (University of Colorado, Boulder)

For decades, the predominant cosmological model used by scientists has been based on the theory that in addition to baryonic matter – aka. “normal” or “luminous” matter, which we can see – the Universe also contains a substantial amount of invisible mass. This “Dark Matter” accounts for roughly 26.8% of the mass of the Universe, whereas normal matter accounts for just 4.9%.

While the search for Dark Matter is ongoing and direct evidence is yet to be found, scientists have also been aware that roughly 90% of the Universe’s normal matter still remained undetected. According to two new studies that were recently published, much of this normal matter – which consists of filaments of hot, diffuse gas that links galaxies together – may have finally been found.

The first study, titled “A Search for Warm/Hot Gas Filaments Between Pairs of SDSS Luminous Red Galaxies“, appeared in the Monthly Notices of the Royal Astronomic Society. The study was led by Hideki Tanimura, a then-PhD candidate at the University of British Columbia, and included researchers from the Canadian Institute for Advanced Research (CIFAR), the Liverpool John Moores University and the University of KwaZulu-Natal.

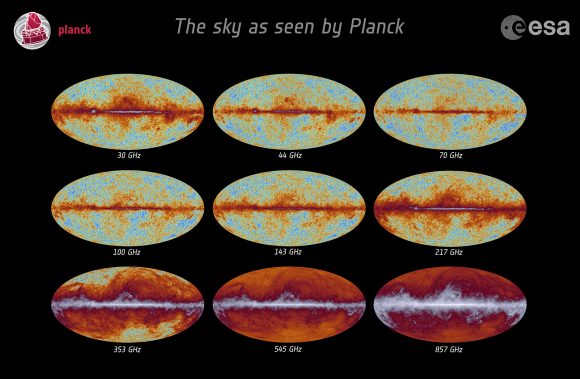
All-sky data obtained by the ESA’s Planck mission, showing the different wavelenghts. Credit: ESA

The second study, which recently appeared online, was titled “Missing Baryons in the Cosmic Web Revealed by the Sunyaev-Zel’dovich Effect“. This team consisted of researchers from the University of Edinburgh and was led Anna de Graaff, a undergraduate student from the Institute for Astronomy at Edinburgh’s Royal Observatory. Working independently of each other, these two team tackled a problem of the Universe’s missing matter.

Based on cosmological simulations, the predominant theory has been that the previously-undetected normal matter of the Universe consists of strands of baryonic matter – i.e. protons, neutrons and electrons – that is floating between galaxies. These regions are what is known as the “Cosmic Web”, where low density gas exists at a temperatures of 105 to 107 K (-168 t0 -166 °C; -270 to 266 °F).

For the sake of their studies, both teams consulted data from the Planck Collaboration, a venture maintained by the European Space Agency that includes all those who contributed to the Planck mission (ESA). This was presented in 2015, where it was used to create a thermal map of the Universe by measuring the influence of the Sunyaev-Zeldovich (SZ) effect.

This effect refers to a spectral distortion in the Cosmic Microwave Background, where photons are scattered by ionized gas in galaxies and larger structures. During its mission to study the cosmos, the Planck satellite measured the spectral distortion of CMB photons with great sensitivity, and the resulting thermal map has since been used to chart the large-scale structure of the Universe.

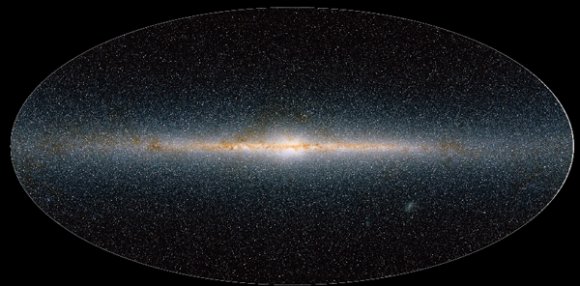
IR map of the whole Galaxy showing the plane and bulge of the Galaxy full of stars and dust. Credit: SDSS

However, the filaments between galaxies appeared too faint for scientists to examine at the time. To remedy this, the two teams consulted data from the North and South CMASS galaxy catalogues, which were produced from the 12th data release of the Sloan Digital Sky Survey (SDSS). From this data set, they then selected pairs of galaxies and focused on the space between them.

They then stacked the thermal data obtained by Planck for these areas on top of each other in order to strengthen the signals caused by SZ effect between galaxies. As Dr. Hideki told Universe Today via email:

“The SDSS galaxy survey gives a shape of the large-scale structure of the Universe. The Planck observation provides an all-sky map of gas pressure with a better sensitivity. We combine these data to probe the low-dense gas in the cosmic web.”

While Tanimura and his team stacked data from 260,000 galaxy pairs, de Graaff and her team stacked data from over a million. In the end, the two teams came up with strong evidence of gas filaments, though their measurements differed somewhat. Whereas Tanimura’s team found that the density of these filaments was around three times the average density in the surrounding void, de Graaf and her team found that they were six times the average density.

“We detect the low-dense gas in the cosmic web statistically by a stacking method,” said Hideki. “The other team uses almost the same method. Our results are very similar. The main difference is that we are probing a nearby Universe, on the other hand, they are probing a relatively farther Universe.”

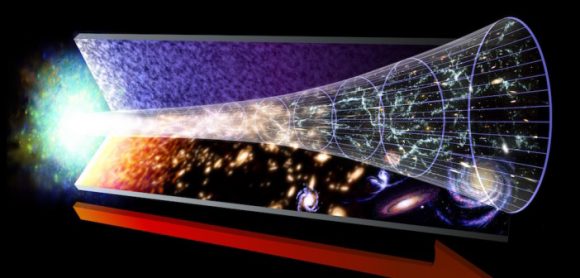
This illustration shows the evolution of the Universe, from the Big Bang on the left, to modern times on the right. Image: NASA

This particular aspect of particularly interesting, in that it hints that over time, baryonic matter in the Cosmic Web has become less dense. Between these two results, the studies accounted for between 15 and 30% of the total baryonic content of the Universe. While that would mean that a significant amount of the Universe’s baryonic matter still remains to be found, it is nevertheless an impressive find.

As Hideki explained, their results not only support the current cosmological model of the Universe (the Lambda CDM model) but also goes beyond it:

“The detail in our universe is still a mystery. Our results shed light on it and reveals a more precise picture of the Universe. When people went out to the ocean and started making a map of our world, it was not used for most of the people then, but we use the world map now to travel abroad. In the same way, a map of the entire universe may not be valuable now because we do not have a technology to go far out to the space. However, it could be valuable 500 years later. We are in the first stage of making a map of the entire Universe.”
It also opens up opportunities for future studies of the Comsic Web, which will no doubt benefit from the deployment of next-generation instruments like James Webb Telescope, the Atacama Cosmology Telescope and the Q/U Imaging ExperimenT (QUIET). With any luck, they will be able to spot the remaining missing matter. Then, perhaps we can finally zero in on all the invisible mass!
Further Reading: MNRAS, arXiv,

Debris Disks Around Stars Could Point the Way to Giant Exoplanets

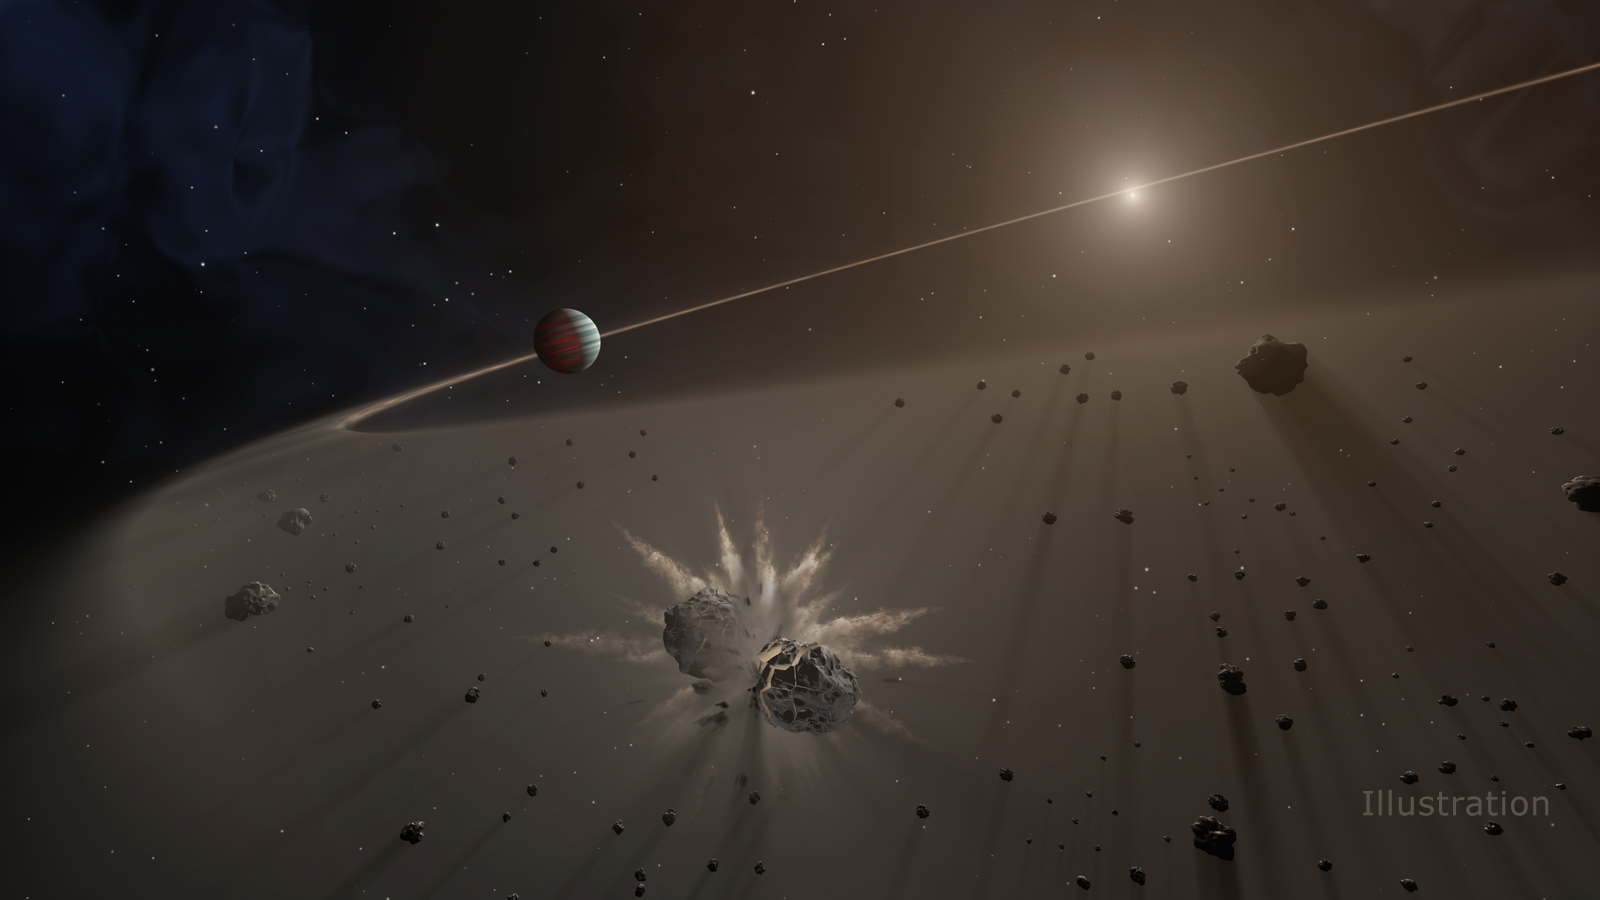
This artist's rendering shows a large exoplanet causing small bodies to collide in a disk of dust. Credit: NASA/JPL-Caltech

According to current estimates, there could be as many as 100 billion planets in the Milky Way Galaxy alone. Unfortunately, finding evidence of these planets is tough, time-consuming work. For the most part, astronomers are forced to rely on indirect methods that measure dips in a star’s brightness (the Transit Method) of Doppler measurements of the star’s own motion (the Radial Velocity Method).

Direct imaging is very difficult because of the cancelling effect stars have, where their brightness makes it difficult to spot planets orbiting them. Luckily a new study led by the Infrared Processing and Analysis Center (IPAC) at Caltech has determined that there may be a shortcut to finding exoplanets using direct imaging. The solution, they claim, is to look for systems with a circumstellar debris disk, for they are sure to have at least one giant planet.

The study, titled “A Direct Imaging Survey of Spitzer Detected Debris Disks: Occurrence of Giant Planets in Dusty Systems“, recently appeared in The Astronomical Journal. Tiffany Meshkat, an assistant research scientist at IPAC/Caltech, was the lead author on the study, which she performed while working at NASA’s Jet Propulsion Laboratory as a postdoctoral researcher.

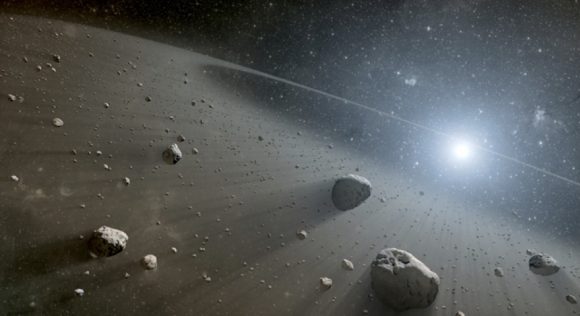
A circumstellar disk of debris around a mature stellar system could indicate the presence of Earth-like planets. Credit: NASA/JPL
Artist’s impression of circumstellar disk of debris around a distant star. Credit: NASA/JPL

For the sake of this study, Dr. Meshkat and her colleagues examined data on 130 different single-star systems with debris disks, which they then compared to 277 stars that do not appear to host disks. These stars were all observed by NASA’s Spitzer Space Telescope and were all relatively young in age (less than 1 billion years). Of these 130 systems, 100 had previously been studied for the sake of finding exoplanets.

Dr. Meshkat and her team then followed up on the remaining 30 systems using data from the W.M. Keck Observatory in Hawaii and the European Southern Observatory’s (ESO) Very Large Telescope (VLT) in Chile. While they did not detect any new planets in these systems, their examinations helped characterize the abundance of planets in systems that had disks.

What they found was that young stars with debris disks are more likely to also have giant exoplanets with wide orbits than those that do not. These planets were also likely to have five times the mass of Jupiter, thus making them “Super-Jupiters”. As Dr. Meshkat explained in a recent NASA press release, this study will be of assistance when it comes time for exoplanet-hunters to select their targets:

“Our research is important for how future missions will plan which stars to observe. Many planets that have been found through direct imaging have been in systems that had debris disks, and now we know the dust could be indicators of undiscovered worlds.”

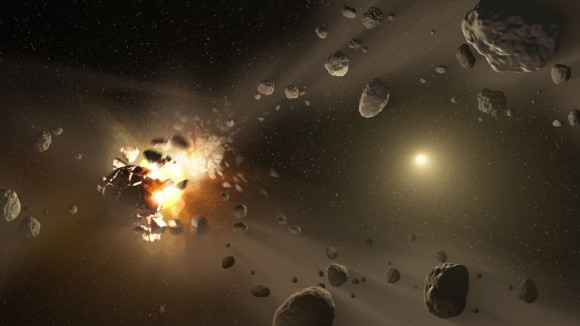
This artist’s conception shows how collisions between planetesimals can create additional debris. Credit: NASA/JPL-Caltech

This study, which was the largest examination of stars with dusty debris disks, also provided the best evidence to date that giant planets are responsible for keeping debris disks in check. While the research did not directly resolve why the presence of a giant planet would cause debris disks to form, the authors indicate that their results are consistent with predictions that debris disks are the products of giant planets stirring up and causing dust collisions.

In other words, they believe that the gravity of a giant planet would cause planestimals to collide, thus preventing them from forming additional planets. As study co-author Dimitri Mawet, who is also a JPL senior research scientist, explained:

“It’s possible we don’t find small planets in these systems because, early on, these massive bodies destroyed the building blocks of rocky planets, sending them smashing into each other at high speeds instead of gently combining.”

Within the Solar System, the giant planets create debris belts of sorts. For example, between Mars and Jupiter, you have the Main Asteroid Belt, while beyond Neptune lies the Kuiper Belt. Many of the systems examined in this study also have two belts, though they are significantly younger than the Solar System’s own belts – roughly 1 billion years old compared to 4.5 billion years old.

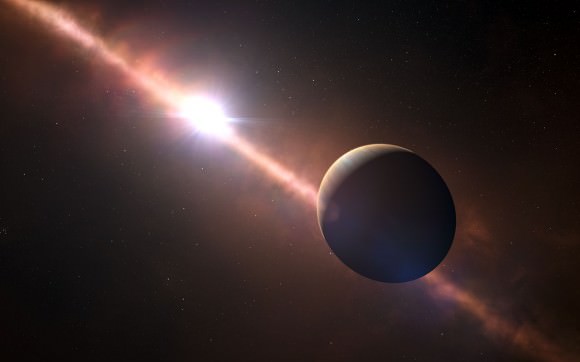
Artist’s impression of Beta Pictoris b. Credit: ESO L. Calçada/N. Risinger (skysurvey.org)

One of the systems examined in the study was Beta Pictoris, a system that has a debris disk, comets, and one confirmed exoplanet. This planet, designated Beta Pictoris b, which has 7 Jupiter masses and orbits the star at a distance of 9 AUs – i.e. nine times the distance between the Earth and the Sun. This system has been directly imaged by astronomers in the past using ground-based telescopes.

Interestingly enough, astronomers predicted the existence of this exoplanet well before it was confirmed, based on the presence and structure of the system’s debris disk. Another system that was studied was HR8799, a system with a debris disk that has two prominent dust belts. In these sorts of systems, the presence of more giant planets is inferred based on the need for these dust belts to be maintained.

This is believed to be case for our own Solar System, where 4 billion years ago, the giant planets diverted passing comets towards the Sun. This resulted in the Late Heavy Bombardment, where the inner planets were subject to countless impacts that are still visible today. Scientists also believe that it was during this period that the migrations of Jupiter, Saturn, Uranus and Neptune deflected dust and small bodies to form the Kuiper Belt and Asteroid Belt.

Dr. Meshkat and her team also noted that the systems they examined contained much more dust than our Solar System, which could be attributable to their differences in age. In the case of systems that are around 1 billion years old, the increased presence of dust could be the result of small bodies that have not yet formed larger bodies colliding. From this, it can be inferred that our Solar System was once much dustier as well.

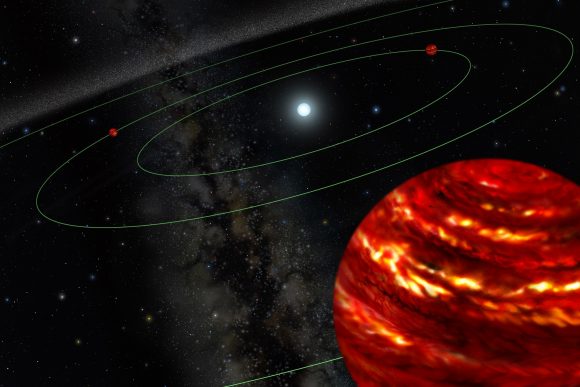
Artist’s concept of the multi-planet system around HR 8799, initially discovered with Gemini North adaptive optics images. Credit: Gemini Observatory/Lynette Cook”

However, the authors note is also possible that the systems they observed – which have one giant planet and a debris disk – may contain more planets that simply have not been discovered yet. In the end, they concede that more data is needed before these results can be considered conclusive. But in the meantime, this study could serve as an guide as to where exoplanets might be found.

As Karl Stapelfeldt, the chief scientist of NASA’s Exoplanet Exploration Program Office and a co-author on the study, stated:

“By showing astronomers where future missions such as NASA’s James Webb Space Telescope have their best chance to find giant exoplanets, this research paves the way to future discoveries.”

In addition, this study could help inform our own understanding of how the Solar System evolved over the course of billions of years. For some time, astronomers have been debating whether or not planets like Jupiter migrated to their current positions, and how this affected the Solar System’s evolution. And there continues to be debate about how the Main Belt formed (i.e. empty of full).

Last, but not least, it could inform future surveys, letting astronomers know which star systems are developing along the same lines as our own did, billions of years ago. Wherever star systems have debris disks, they an infer the presence of a particularly massive gas giant. And where they have a disk with two prominent dust belts, they can infer that it too will become a system containing many planets and and two belts.

Further Reading: NASA, The Astrophysical Journal

Tales of the King: Watch as the Moon Occults Regulus for North America This Weekend

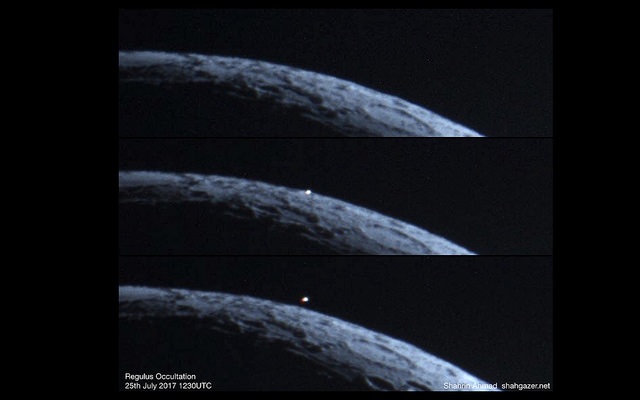
The Moon occults Regulus on July 25th, 2017. The Moon also occulted the star shortly after the August 21st total solar eclipse. Credit and copyright; @Shahgazer (Shahrin Ahmad).
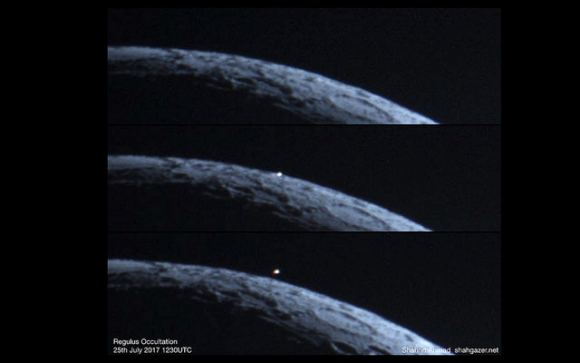
The Moon occults Regulus on July 25th, 2017. The Moon also occulted the star shortly after the August 21st total solar eclipse. Credit and copyright: @Shahgazer (Shahrin Ahmad).

Up early Sunday morning? Or perhaps, as we often do, you’re “pulling an all-nighter,” out observing until the break of dawn. Well, the clockwork celestial mechanics of the Universe has a treat in store on the morning of October 15th, as the waning crescent Moon occults (passes in front of) the bright star Regulus (Alpha Leonis, the “Little King” or “Heart of the Lion”) for the contiguous United States, Mexico and southern Canada.

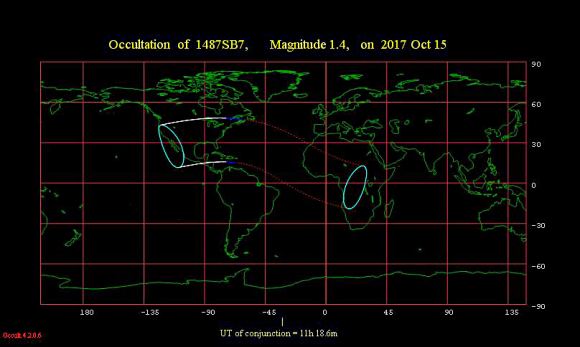
The visibility footprint for Sunday’s occultation. The white solid lines show where the occultation occurs under dark skies, blue marks twilight, and broken lines represent where the event occurs under daytime skies. Credit: Occult 4.2.

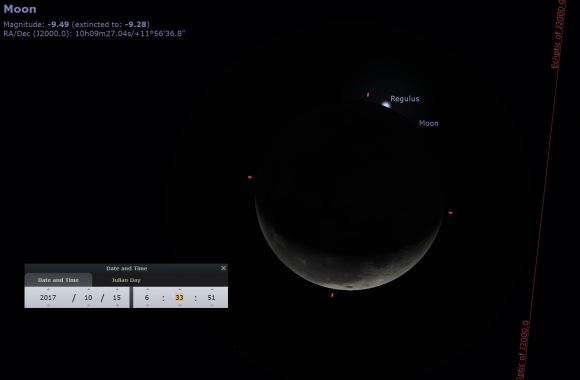
You might call this one the “Great American Occultation,” as it takes a similar track to a certain total solar eclipse and another occultation of the bright star Aldebaran earlier this year. The Moon is a 20% illuminated waning crescent during Sunday’s occultation, about the best phase for such an event, as you’ll also get a nice contrasting Earthshine or Ashen light on dark nighttime limb of the Moon. That’s sunlight from the waxing gibbous Earth, illuminating the (cue Pink Floyd) Dark Side of the Moon.

Moon versus Regulus shortly after Sunday’s occultation as seen from Spring Hill, Florida. Stellarium.

Early morning occultations always see the target star or planet ingress (passing behind) the oncoming bright limb of the waning Moon, then egress (reappearing) from behind its dark limb. During waxing evening occultations, the reverse is true, as the dark limb of the Moon leads the way. The Moon will be 53 degrees west of the Sun during the event, and folks in the western U.S. will see the occultation lower to the eastern horizon under dark skies, while observers from Florida to the Great Lakes will see the event transpire under twilight skies and observers in the U.S. northeast will see the occultation finish up after sunrise. Shining at magnitude +1.4, you’ll be able to see the disappearance and reappearance of Regulus with the unaided eye, though events on the dark limb are always more dramatic. And you may just be able to spy Regulus in the daytime post sunrise near the Moon after the occultation, using binoculars or a telescope.

The northern limit graze line path for Sunday’s occultation. Click here for a Google interactive map. Credit: IOTA

Observers along a line running from Oregon through Lake of the Woods, above the Great Lakes and north of New Brunswick are also in for a treat as you just might be able to catch a rare grazing occultation of Regulus, (see the video below) as the star’s light shines down through those lunar valleys and gets blocked by mountain peaks along the limb of the Moon. Such an event can be quite dramatic to watch, as the star light winks in and out during the very last second of its 79 light year journey.

A look at the occultation circumstances for selected locations tells the story. The International Occultation Timing Association has a full list for locales across North America.

Ingress Egress Moon Alt start/end
Boise, Idaho 9:48 UT 10:03 UT 3 deg / 6 deg
Tuscon, Arizona (before Moonrise) 10:14 UT NA / 10 deg
Mexico City, Mexico 9:19 UT 10:06 UT 6 deg / 17 deg
Tampa, Florida 9:24 UT 10:32 UT 23 deg / 39 deg
St. Louis, Missouri 9:29 UT 10:26 UT 18 deg / 29 deg
Boston, Massachusetts 9:50 UT 10:44 UT 36 deg / 45 deg
Toronto, Canada 9:47 UT 10:32 UT 29 / 37 deg

The Moon is in the midst of a cycle of occultations of Regulus running from December 18th, 2016 to the final one for the cycle on April 24th, 2018. This is number 12 in a series of 19 events, and the best pre-dawn occultation of Regulus for the United States in the current cycle.

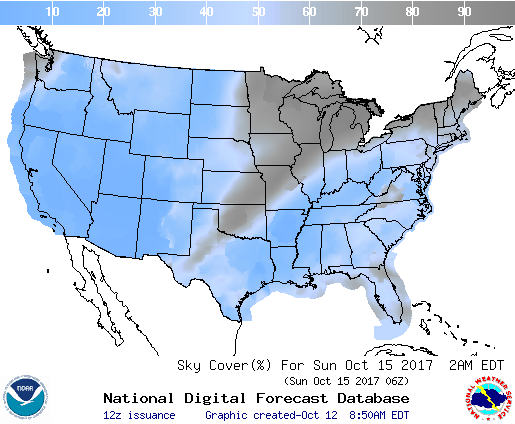
US cloud cover percentages, a few hours before the occultation. Credit: NOAA

The Moon can occult four bright +1st magnitude stars during the current epoch: Regulus, Antares, Spica and Aldebaran. And though Regulus lies closest to the ecliptic plane, it actually gets occulted the least of any 1st magnitude star in the 21st century, with only 220 events. The Moon actually also occulted the bright star Pollux up until almost two millennia ago, and will resume doing so again in the future.

Occultations are easy to observe, and one of the few times (including eclipses) were you can see the motion of the Moon, in real time. The Moon moves its own diameter (30′ or half a degree) per hour, and the reemergence of the bright star will be an abrupt “lights back on” for Regulus. Does it seem to linger a bit between the horns of the crescent Moon? This often reported optical illusion is called the Coleridge Effect, from a line from Samuel Coleridge’s (not Iron Maiden’s) Rime of the Ancient Mariner:

While clome above the Eastern bar

The horned Moon, with one bright star

Almost atween the tips.

Happen to see Regulus “a clome ‘atween the tips?” We also like to refer to this as the ‘Protor and Gamble effect’ due to the company’s traditional star-filled logo.

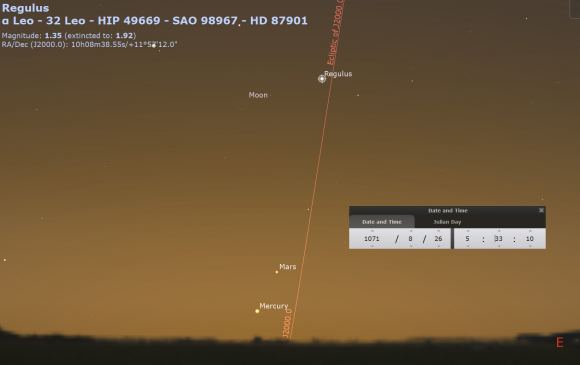
Occultations also adorn the flags of many Middle Eastern countries. The star and crescent of Islam traces back to antiquity, but was said to have been adapted for the Turkish flag after Sultan Alp Arslan witnessed a close pairing shortly after the Battle of Manzikert on August 26th, 1071 AD. Though Venus is usually stated as the legendary “star,” Regulus was in fact, just a few degrees away from the Moon on the very same morning… perhaps adding some credence to a major legend vexing vexillology?

The Moon and Regulus on the morning of August 26th, 1071 AD. Stellarium.

Of course, we may never truly know just what Sultan Arsulan saw. A more recent occultation tale was featured in the November 2017 issue of Sky and Telescope, positing the an occultation of Aldebaran by the Moon on March 7th, 1974 was the source of William Wilkins’ alleged “Volcano on the Moon…” the timing is certainly right, though one wonders how a skilled observer like Wilkins could be fooled by a prominent star (wistful thinking, maybe?)

Recording an occultation is as easy as aiming a video camera at the Moon through a telescope and letting it run. Start early, and make sure you’ve got the contrast between the bright limb of the Moon and the star adjusted, so both appear in the frame. We like to have WWV radio running in the background for an accurate time hack on the video.

Regulus also has a suspected (though never seen) white dwarf companion. Such a star should shine at +12th magnitude or so… and just might make a very brief appearance on the dark limb of the Moon during egress. One total unknown is its position angle, which is a big wild card, but you just never know… its worth examining that video afterwards, especially if you’re shooting at a high frame rate.

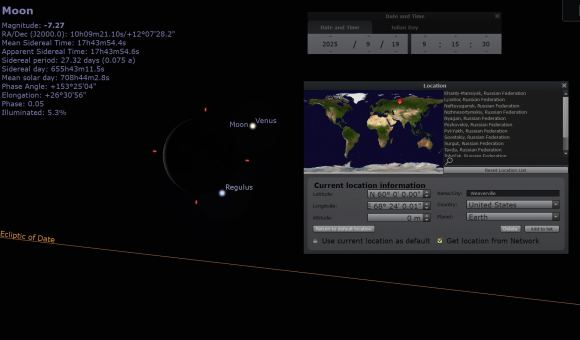
…and speaking of occultations, we’re in the midst of combing through near double occultations of bright stars and planets out to 3000 A.D… hey, it’s what we do for fun. Anyhow, we’re tweeting these out as @Astroguyz as we find ’em, one per day. As a teaser, I give you this grazing occultation of Venus and Regulus over Siberia coming right up in 2025:

The Moon occults Venus and Regulus in 2025. Stellarium.

If nothing else, the cosmic grin of a planet, star and crescent Moon does hint at the Universe’s strange sense of humor.

Scientist Find Treasure Trove of Giant Black Hole Pairs

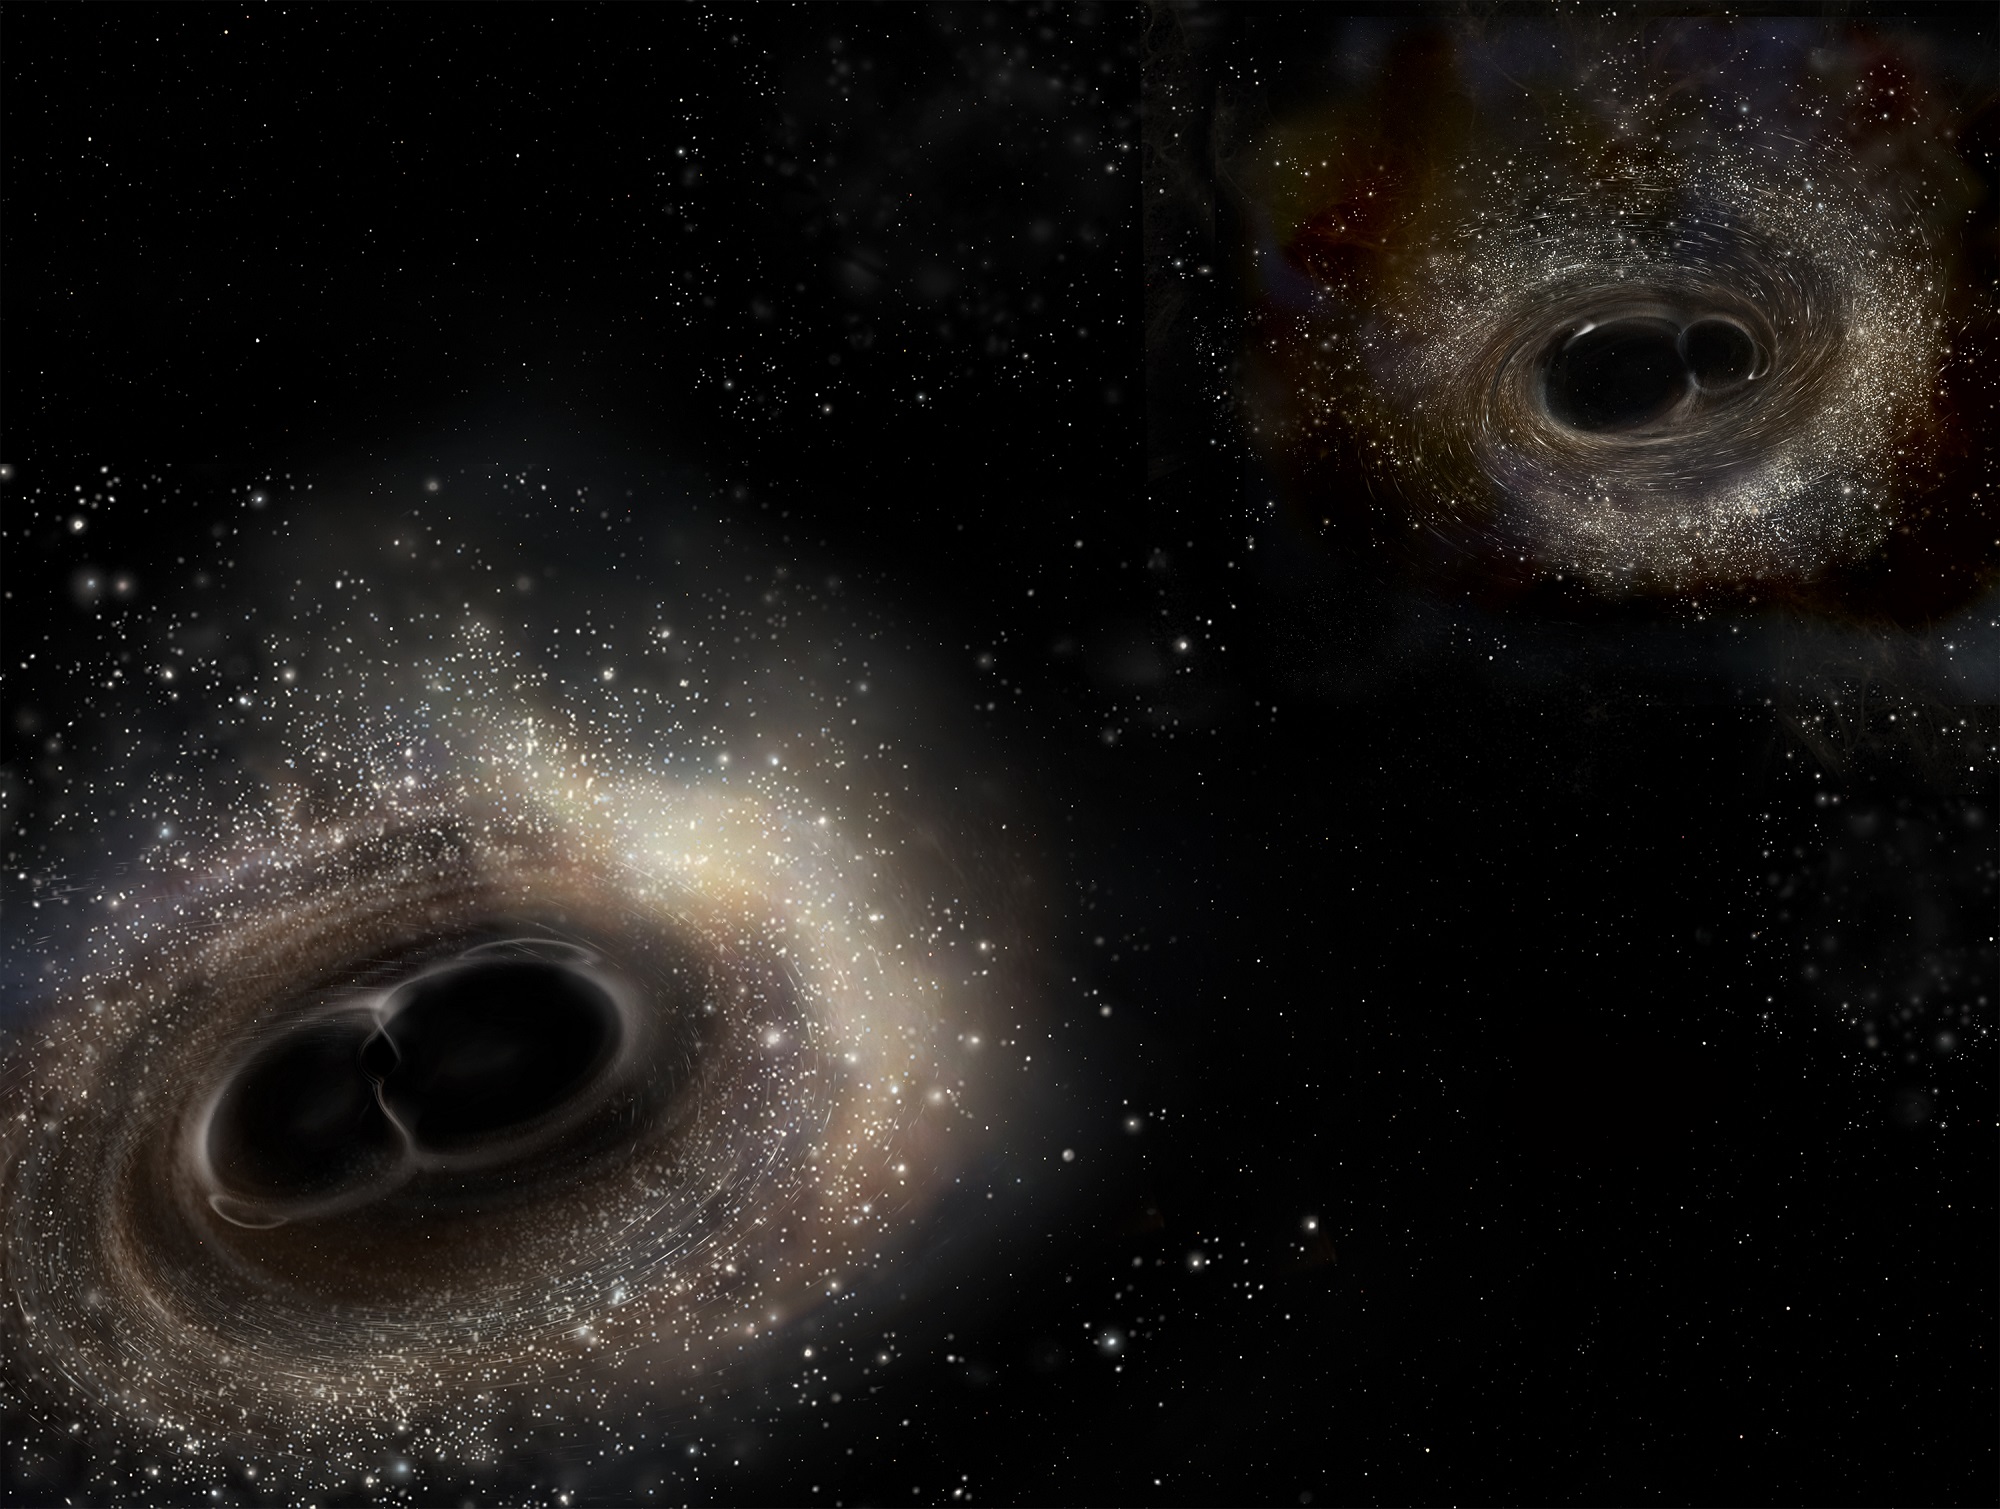
In February 2016, LIGO detected gravity waves for the first time. As this artist's illustration depicts, the gravitational waves were created by merging black holes. The third detection just announced was also created when two black holes merged. Credit: LIGO/A. Simonnet.
Artist's impression of merging binary black holes. Credit: LIGO/A. Simonnet.

For decades, astronomers have known that Supermassive Black Holes (SMBHs) reside at the center of most massive galaxies. These black holes, which range from being hundreds of thousands to billions of Solar masses, exert a powerful influence on surrounding matter and are believed to be the cause of Active Galactic Nuclei (AGN). For as long as astronomers have known about them, they have sought to understand how SMBHs form and evolve.

In two recently published studies, two international teams of researchers report on the discovery of five newly-discovered black hole pairs at the centers of distant galaxies. This discovery could help astronomers shed new light on how SMBHs form and grow over time, not to mention how black hole mergers produce the strongest gravitational waves in the Universe.

The first four dual black hole candidates were reported in a study titled “Buried AGNs in Advanced Mergers: Mid-Infrared Color Selection as a Dual AGN Finder“, which was led by Shobita Satyapal, a professor of astrophysics at George Mason University. This study was accepted for publication in The Astrophysical Journal and recently appeared online.

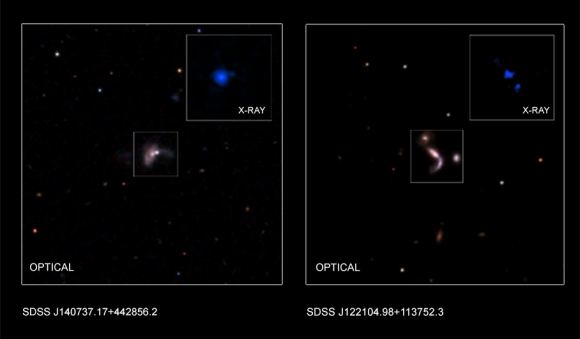
Optical and x-ray data on two of the new black hole pairs discovered. Credit: NASA/CXC/Univ. of Victoria/S.Ellison et al./George Mason Univ./S.Satyapal et al./SDSS

The second study, which reported the fifth dual black hole candidate, was led by Sarah Ellison – an astrophysics professor at the University of Victoria. It was recently published in the Monthly Notices of the Royal Astronomical Society under the title “Discovery of a Dual Active Galactic Nucleus with ~8 kpc Separation. The discovery of these five black hole pairs was very fortuitous, given that pairs are a very rare find.

As Shobita Satyapal explained in a Chandra press statement:

“Astronomers find single supermassive black holes all over the universe. But even though we’ve predicted they grow rapidly when they are interacting, growing dual supermassive black holes have been difficult to find.

The black hole pairs were discovered by combining data from a number of different ground-based and space-based instruments. This included optical data from the Sloan Digital Sky Survey (SDSS) and the ground-based Large Binocular Telescope (LBT) in Arizona with near-infrared data from the Wide-Field Infrared Survey Explorer (WISE) and x-ray data from NASA’s Chandra X-ray Observatory.

For the sake of their studies, Satyapal, Ellison, and their respective teams sought to detect dual AGNs, which are believed to be a consequence of galactic mergers. They began by consulting optical data from the SDSS to identify galaxies that appeared to be in the process of merging. Data from the all-sky WISE survey was then used to identify those galaxies that displayed the most powerful AGNs.

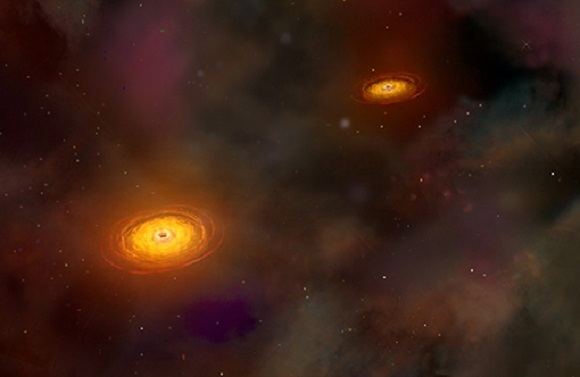
Illustration of a pair of black holes. Credit: NASA/CXC/A.Hobart

They then consulted data from the Chandra’s Advanced CCD Imaging Spectrometer (ACIS) and the LBT to identify seven galaxies that appeared to be in an advanced stage of merger. The study led by Ellison also relied on optical data provided by the Mapping Nearby Galaxies at Apache Point Observatory (MaNGA) survey to pinpoint one of the new black hole pairs.

From the combined data, they found that five out of the seven merging galaxies hosted possible dual AGNs, which were separated by less than 10 kiloparsecs (over 30,000 light years). This was evidenced by the infrared data provided by WISE, which was consistent with what is predicated of rapidly growing supermassive black holes.

In addition, the Chandra data showed closely-separated pairs of x-ray sources, which is also consistent with black holes that have matter slowly being accreted onto them. This infrared and x-ray data also suggested that the supermassive black holes are buried in large amounts of dust and gas. As Ellison indicated, these findings were the result of painstaking work that consisted of sorting through multiple wavelengths of data:

“Our work shows that combining the infrared selection with X-ray follow-up is a very effective way to find these black hole pairs. X-rays and infrared radiation are able to penetrate the obscuring clouds of gas and dust surrounding these black hole pairs, and Chandra’s sharp vision is needed to separate them”.

Artist’s impression of binary black hole system in the process of merging. Credit: Bohn et al.

Before this study, less than ten pairs of growing black holes had been confirmed based on X-ray studies, and these were mostly by chance. This latest work, which detected five black hole pairs using combined data, was therefore both fortunate and significant. Aside from bolstering the hypothesis that supermassive black holes form from the merger of smaller black holes, these studies also have serious implications for gravitational wave research.

“It is important to understand how common supermassive black hole pairs are, to help in predicting the signals for gravitational wave observatories,” said Satyapa. “With experiments already in place and future ones coming online, this is an exciting time to be researching merging black holes. We are in the early stages of a new era in exploring the universe.”

Since 2016, a total of four instances of gravitational waves have been detected by instruments like the Laser Interferometer Gravitational-Wave Observatory (LIGO) and the VIRGO Observatory. However, these detections were the result of black hole mergers where the black holes were all smaller and less massive  – between eight and 36 Solar masses.

Supermassive Black Holes, on the other hand, are much more massive and will likely produce a much larger gravitational wave signature as they continue to draw closer together. And in a few hundred million years, when these pairs eventually do merge, the resulting energy produced by mass being converted into gravitational waves will be incredible.
Artist’s conception of two merging black holes, similar to those detected by LIGO on January 4th, 2017. Credit: LIGO/Caltech

At present, detectors like LIGO and Virgo are not able to detect the gravitational waves created by Supermassive Black Hole pairs. This work is being done by arrays like the North American Nanohertz Observatory for Gravitational Waves (NANOGrav), which relies on high-precision millisecond pulsars to measure the influence of gravitational waves on space-time.

The proposed Laser Interferometer Space Antenna (LISA), which will be the first dedicated space-based gravitational wave detector, is also expected to help in the search. In the meantime, gravitational wave research has already benefited immensely from collaborative efforts like the one that exists between Advanced LIGO and Advanced Virgo.

In the future, scientists also anticipate that they will be able to study the interiors of supernovae through gravitational wave research. This is likely to reveal a great deal about the mechanisms behind black hole formation. Between all of these ongoing efforts and future developments, we can expect to “hear” a great deal more of the Universe and the most powerful forces at work within it.

Be sure to check out this animation that shows what the eventual merger of two of these black hole pairs will look like, courtesy of the Chandra X-ray Observatory:

Further Reading: Chandra HarvardarXiv, MNRAS

New Clues Emerge for the Existence of Planet 9

Artist's impression of Planet Nine, blocking out the Milky Way. The Sun is in the distance, with the orbit of Neptune shown as a ring. Credit: ESO/Tomruen/nagualdesign

Planet 9 cannot hide forever, and new research has narrowed the range of possible locations further! In January of 2016, astronomers Mike Brown and Konstantin Batygin published the first evidence that there might be another planet in our Solar System. Known as “Planet 9” (“Planet X” to some), this hypothetical body was believed to orbit at an extreme distance from our Sun, as evidenced by the orbits of certain extreme Kuiper Belt Objects (eKBOs).

Since that time, multiple studied have been produced that have attempted to place constraints on Planet 9’s location. The latest study once again comes from Brown and Batygin, who conducted an analytical assessment of all the processes that have indicated the presence of Planet 9 so far. Taken together, these indications show that the existence of this body is not only likely, but also essential to the Solar System as we know it.

The study, titled “Dynamical Evolution Induced by Planet Nine“, recently appeared online and has been accepted for publication in The Astronomical Journal. Whereas previous studies have pointed to the behavior of various populations of KBOs as proof of Planet 9, Brown and Batygin sought to provide a coherent theoretical description of the dynamical mechanisms responsible for these effects.

In the end, they concluded that it would be more difficult to imagine a Solar System without a Planet 9 than with one. As Konstantin Batygin explained in a recent NASA press statement:

“There are now five different lines of observational evidence pointing to the existence of Planet Nine. If you were to remove this explanation and imagine Planet Nine does not exist, then you generate more problems than you solve. All of a sudden, you have five different puzzles, and you must come up with five different theories to explain them.”

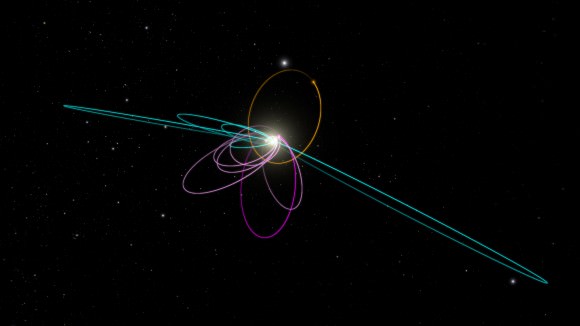
In 2016, Brown and Batygin described the first three lines of observational evidence for Planet 9. These include six extreme Kuiper Belt Objects which follow highly elliptical paths around the Sun, which are indicative of an unseen mechanism affecting their orbit. Second is the fact that the orbits of these bodies are all tilted the same way – about 30° “downward” to the plane of the Kuiper Belt.

The third hint came in the form of computer simulations that included Planet 9 as part of the Solar System. Based to these simulations, it was apparent that more objects should be tilted with respect to the Solar plane, on the order of about 90 degrees. Thanks to their research, Brown and Batygin found five such objects that happened to fit this orbital pattern, and suspected that more existed.

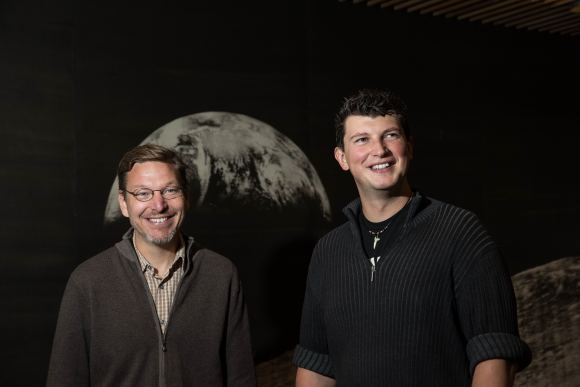
Caltech professor Mike Brown and assistant professor Konstanin Batygin have been working together to investigate Planet Nine. Credit: Lance Hayashida/Caltech

Since the publication of the original paper, two more indications have emerged for the existence of Planet 9. Another involved the unexplained orbits of more Kuiper Belt Objects which were found to be orbiting in the opposite direction from everything else in the Solar System. This was a telltale indication that a relatively close body with a powerful gravitational force was affecting their orbits.

And then there was the argument presented in a second paper by the team – which was led by Elizabeth Bailey, Batygin’s graduate student. This study argued that Planet 9 was responsible for tilting the orbits of the Solar planets over the past 4.5 billion years. This not only provided additional evidence for Planet 9, but also answered a long standing mystery in astrophysics – why the planets are tilted 6 degrees relative to the Sun’s equator.

As Batygin indicated, all of this adds up to a solid case for the existence of a yet-to-discovered massive planet in the outer Solar System:

“No other model can explain the weirdness of these high-inclination orbits. It turns out that Planet Nine provides a natural avenue for their generation. These things have been twisted out of the solar system plane with help from Planet Nine and then scattered inward by Neptune.”

A predicted consequence of Planet Nine is that a second set of confined objects (represented in blue) should also exist. Credit: Caltech/R. Hurt (IPAC)

Recent studies have also shed some light on how and where Planet 9 originated. Whereas some suggested that the planet moved to the edge of the Solar System after forming closer to the Sun, others have suggested that it might be an exoplanet that was captured early in the Solar System’s history. At present, the favored theory appears to be that it formed closer to the Sun and migrated outward over time.

Granted, there is not yet a scientific consensus when it comes to Planet 9 and other astronomers have offered other possible explanations for the evidence cited by Batygin and Brown. For instance, a recent analysis based on the Outer Solar System Origins Survey – which discovered more than 800 new Trans-Neptunian Objects (TNOs) – suggests that the evidence could also be consistent with a random distribution of such objects.

In the meantime, all that remains is to find direct evidence of the planet. At present, Batygin and Brown are attempting to do just that, using the Subaru Telescope at the Mauna Kea Observatory in Hawaii. The detection of this planet will not only settle the matter of whether or not it even exists, it will also help resolve a mystery that emerged in recent years thanks to the discovery of thousands of extra-solar planets.

In short, thanks to the discovery of 3,529 confirmed exoplanets in 2,633 solar systems, astronomers have noticed that statistically, the most likely types of planets are “Super-Earths” and “mini-Neptunes” – i.e. planets that are more massive than Earth but not more than about 10 Earth masses. If Planet 9 is confirmed to exist, which is estimated to have 10 times the Mass of Earth, then it could explain this discrepancy.

Planet 9, we know you’re out there and we will find you! Unless you’re not, in which case, disregard this message!

Further Reads: NASA

Not an Alien Megastructure, a Cloud of Dust on a 700-Day Orbit

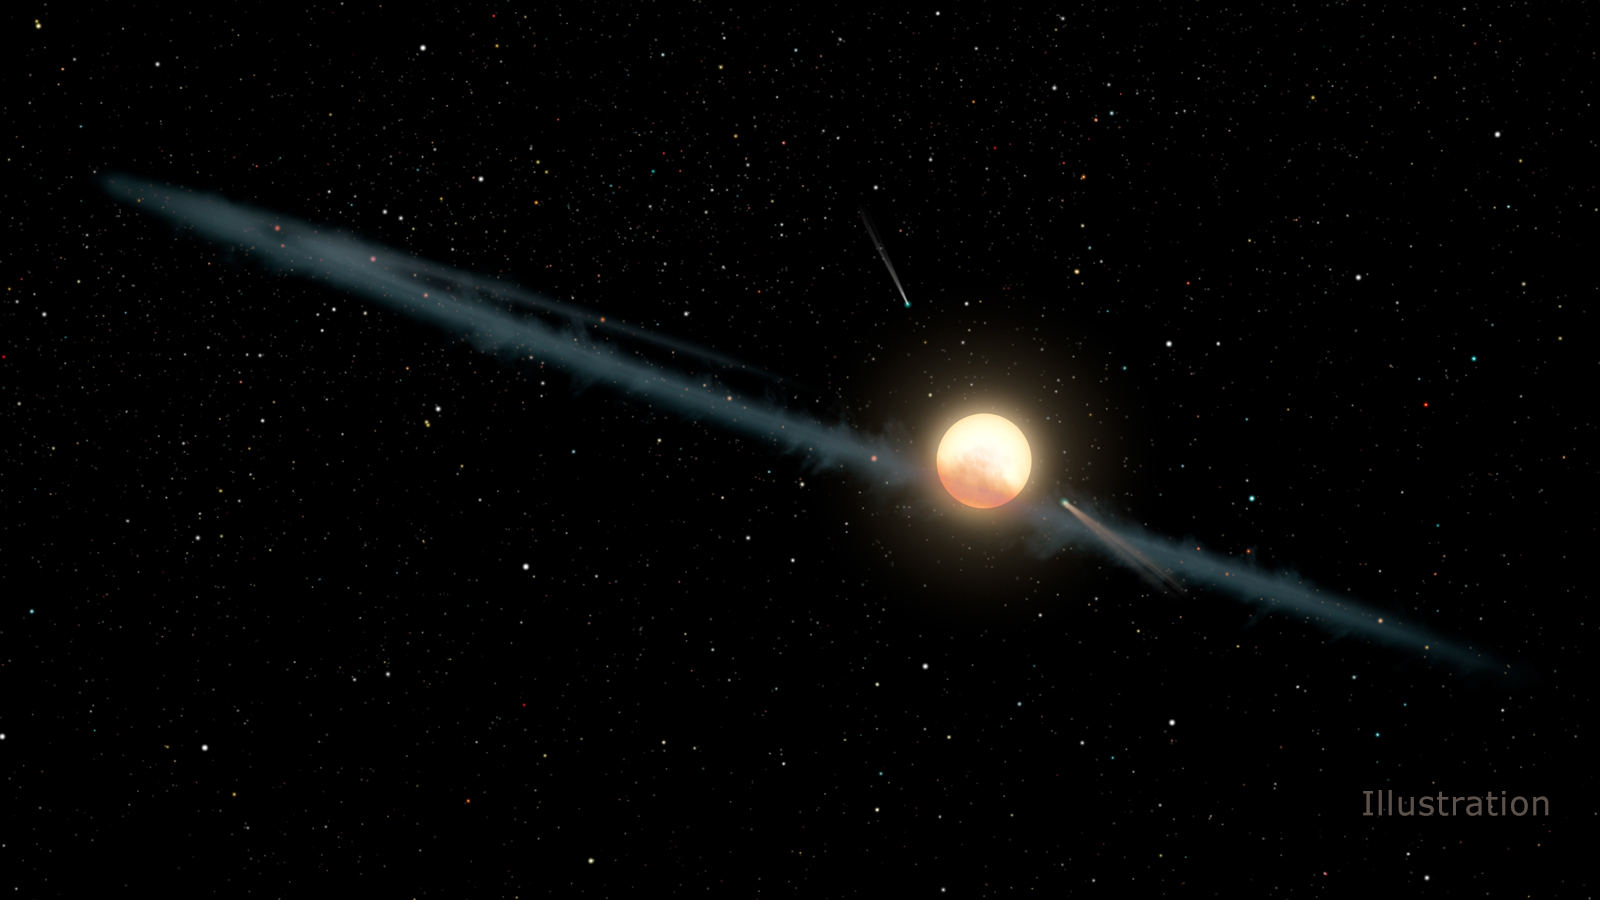
This illustration depicts a hypothetical uneven ring of dust orbiting KIC 8462852, also known as Boyajian's Star or Tabby's Star. Credit: NASA/JPL-Caltech

The mystery of KIC 8462852 (aka. Boyajian’s Star or Tabby’s Star) continues to excite and intrigue! Ever since it was first seen to be undergoing strange and sudden dips in brightness (back in October of 2015) astronomers have been speculating as to what could be causing this. Since that time, various explanations have been offered, including large asteroids, a large planet, a debris disc or even an alien megastructure.

Many studies have been produced that have sought to assign some other natural explanation to the star’s behavior. The latest comes from an international team of scientists – which included Tabetha Boyajian, the lead author on the original 2016 paper. According to this latest study, which was recently published in The Astrophysical Journal, the star’s long-term dimming patterns are likely the result of an uneven dust cloud moving around the star. Continue reading “Not an Alien Megastructure, a Cloud of Dust on a 700-Day Orbit”