Venus is one hellish place! Aside from surface temperatures hot enough to melt lead – as high as 737 K (462 °C; 864 °F) – there’s also the sulfuric acid droplets and extreme pressure conditions (92 times that of Earth’s) to contend with! Because of these hostile conditions, exploring Venus’ surface and atmosphere has been an ongoing and significant challenge for space agencies.
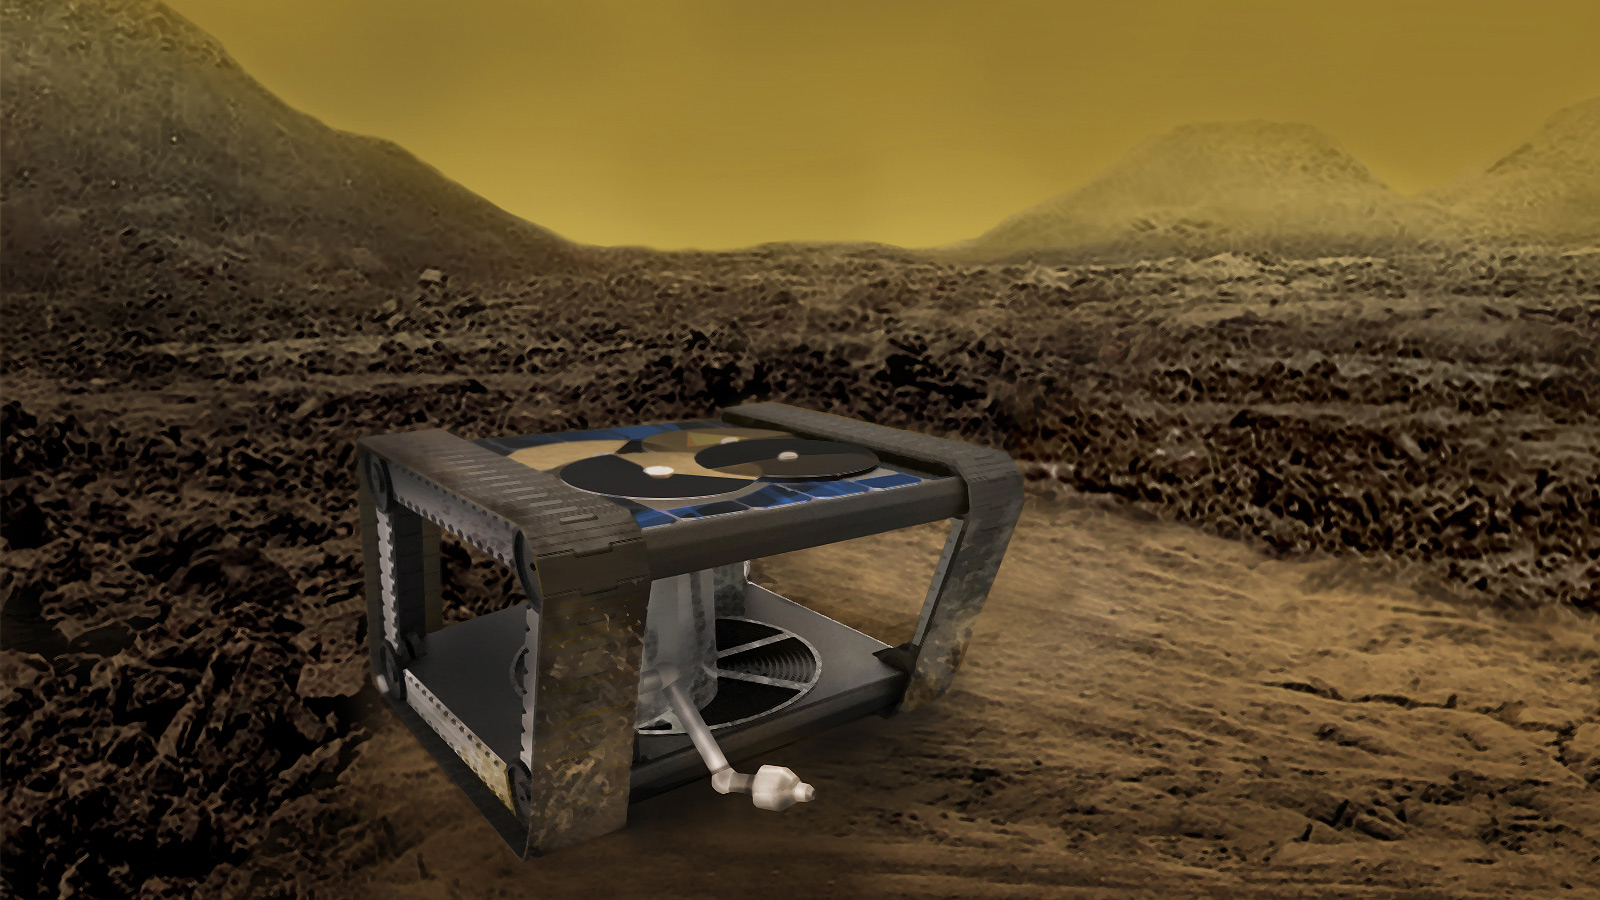
Hence why NASA’s Jet Propulsion Laboratory (JPL) is looking at some truly innovative and unconventional ideas for future missions to Venus. One of them is the second-generation concept known as the Automaton Rover for Extreme Environments (AREE). By relying on clockwork mechanisms instead of electronics, this rover will be able to function on the surface of Venus for longer periods of time.
If deployed, this rover will build upon the accomplishments of the Soviet-era Venera and Vega programs, which were the only missions to ever successfully land on Venus’ hostile surface. Unfortunately, those probes that actually made it to the surface and landed safely only survived for 23 to 127 minutes before their electronics failed and they could no longer send back information.

This is the reality of operating machines on Venus, where the extreme temperatures will melt outer casings and sulfuric acid will corrode electronics. Hence why Jonathan Sauder, a mechatronics engineer at JPL, began tinkering with the idea of a clockwork rover. In this respect, he was inspired by mechanical computers, a time-honored concept that relies on levers and gears to make calculations rather than electronic components.
The earliest known example is the Antikythera mechanism, a device built by the ancient Greeks to predict astronomical phenomena. In 1642, French mathematician Blaise Pascal created what is considered to be the first mechanical calculator. Alternately known as the “Arithmetic Machine” and “Pascal Calculator“, Pascal is said to have invented this device to help his father reorganize the tax revenues for their province.
In the early 19th century, French weaver and merchant Joseph Marie Jacqaurd created the “Jacquard Loom“, a machine that relied on punch cards to turn out textiles in various patterns. And in 1822, English mathematician Charles Babbage began work on his “Difference Engine“, a machine that would automatically perform calculations and create error-free tables.
From these and other examples, Sauders and his team saw a possible solution to surviving Venus’ atmosphere. In essence, they proposed reverting back to an ancient practice of using analog gears to build a robot that could survive the most extreme environment within the Solar System. By relying on an entirely mechanical design and hardened metal structure, the AREE could theoretically survive for months or longer on Venus.
As Sauder explained in a recent NASA press statement:
“Venus is too inhospitable for kind of complex control systems you have on a Mars rover. But with a fully mechanical rover, you might be able to survive as long as a year.”
As a result, it would be able to send back far more information about Venus’ surface conditions and geological processes, which have remained something of a mystery for decades. These include (but are not limited to) why Venus has fewer volcanoes than Earth today – despite widespread evidence of volcanic activity early in its history – and the strange absorption patterns that have been seen in its upper atmosphere.
Sauder first proposed the concept back in 2015. In 2016, the concept was assessed as part of the NASA Innovative Advanced Concepts (NIAC) program, which opens itself to submissions every year for mission ideas. Along with twelve other proposals, AREE was selected for Phase I development and Sauder and his team were awarded $100,000 for a nine month period to assess the feasibility of their concept.
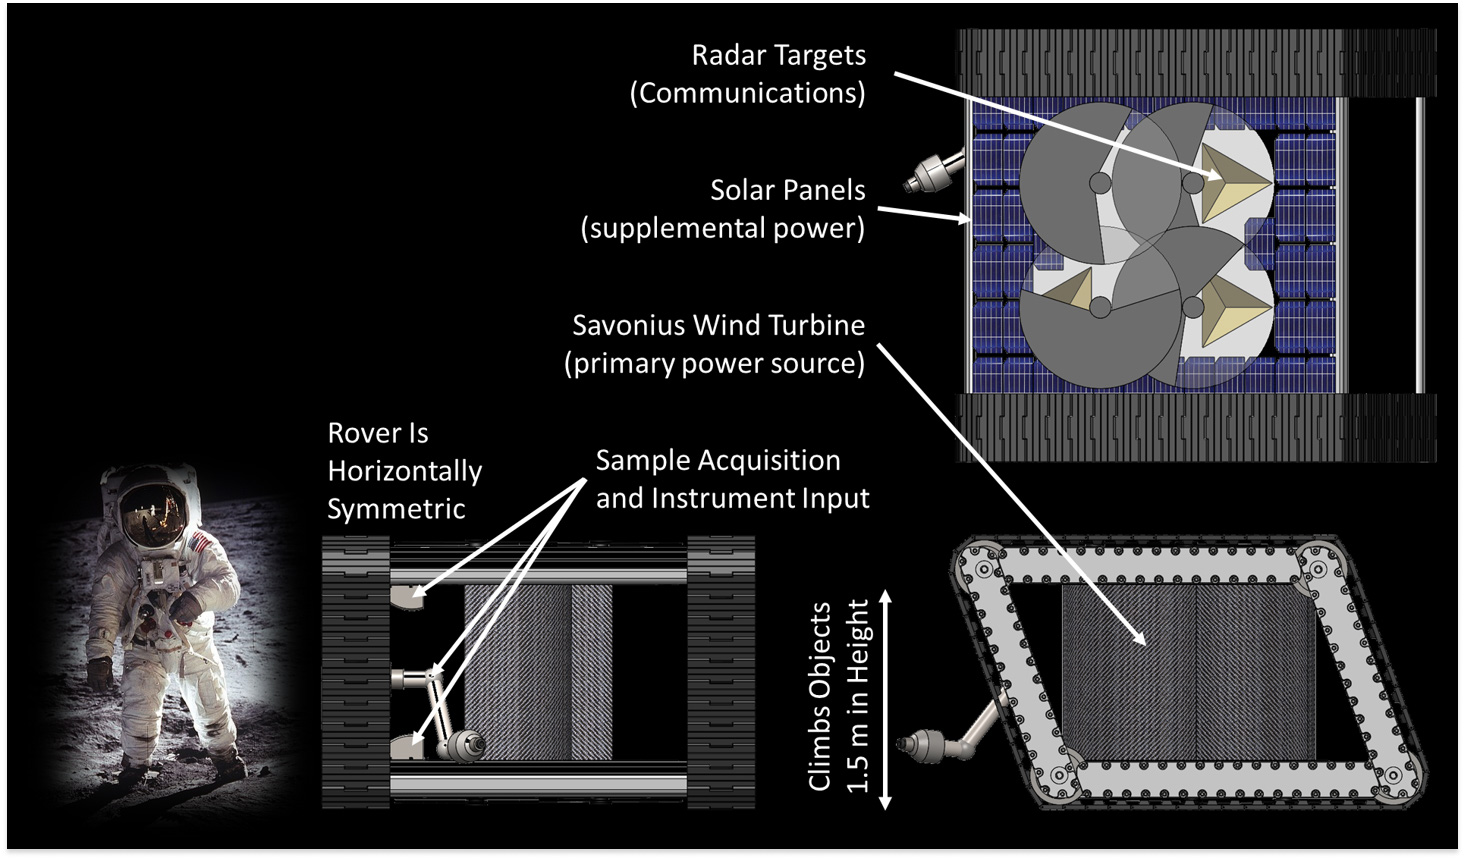
Beyond its processors, AREE would also rely on analog components for power. This would be necessary since solar cells cannot receive sunlight in Venus’ dense atmosphere. And a Multi-Mission Radioisotope Thermoelectric Generator (MMRTG), which the Curiosity rover relies on for power, has complex electrical systems that would likely break down in Venus’s atmosphere.
Mobility is another challenge, and one which Sauder and his team also looked to an old idea to address. Basically, Venus’ rocky, craters surface is full of unknowns and will likely be very difficult to navigate. Sauder and his team therefore looked to World War I-era tanks treads as a solution. These vehicles were slow and lumbering, but were designed to traverse the difficult terrain of No Man’s Land, which was characterized by trenches and craters.
Originally, Sauder’s was inspired by Dutch artist Theo Jansen’s “Strandbeests“, a series of wood and canvas “robots” that relied on wind-driven gears to power their legs and walk along beaches. In the same vein, Sauder considered building a spider-like robot that used spindly legs to get around. However, this seemed too unstable for Venus’ rocky terrain, and treads were favored instead.
For communications, AREE would rely on another time-honored technology – Morse Code. This would involve an orbiting spacecraft pinging the rover using radar, while the rover would communicate by reflecting radar signals off of properly-shaped targets. Thanks to a rotating shutter, which would be positioned in front of the radar target, the rover would be able to turn the signal on and off to simulate dots and dashes.
If successful, this rover would be the first mission since the Cold War to explore the surface of Venus. As Evan Hilgemann, a JPL engineer working on high temperature designs for AREE, explained:
“When you think of something as extreme as Venus, you want to think really out there. It’s an environment we don’t know much about beyond what we’ve seen in Soviet-era images.”

Beyond Venus, such a probe would also be useful for exploring hostile environments on Mercury, within Jupiter’s radiation belt, interiors of gas giants, within volcanoes, and perhaps even the mantle of Earth. The AREE rover is currently in its second phase of NIAC development, and the team is working towards refining and prototyping parts of the concept.
In the future, Sauder and his team hope to expand the rover’s capabilities further and maybe equip it with a drill to collect geological samples. With the ability to function on the planet for up to a year, and the prospect of actual samples being obtained from the surface, scientists will be able to learn a great deal about Earth’s “Sister Planet”. This, in turn, could teach us much about the formation and evolution of rocky planets in our Solar System.
Be sure to check out this video of AREE concept, which features the team’s original spider-leg design: