The Corvus Constellation

Celestial map of the constellation Corvus, the Raven. Credit and Copyright ©: Torsten Bronger

Welcome to another edition of Constellation Friday! Today, in honor of the late and great Tammy Plotner, we take a look at the “Raven” – the Corvus constellation. Enjoy!

In the 2nd century CE, Greek-Egyptian astronomer Claudius Ptolemaeus (aka. Ptolemy) compiled a list of all the then-known 48 constellations. This treatise, known as the Almagest, would be used by medieval European and Islamic scholars for over a thousand years to come, effectively becoming astrological and astronomical canon until the early Modern Age.

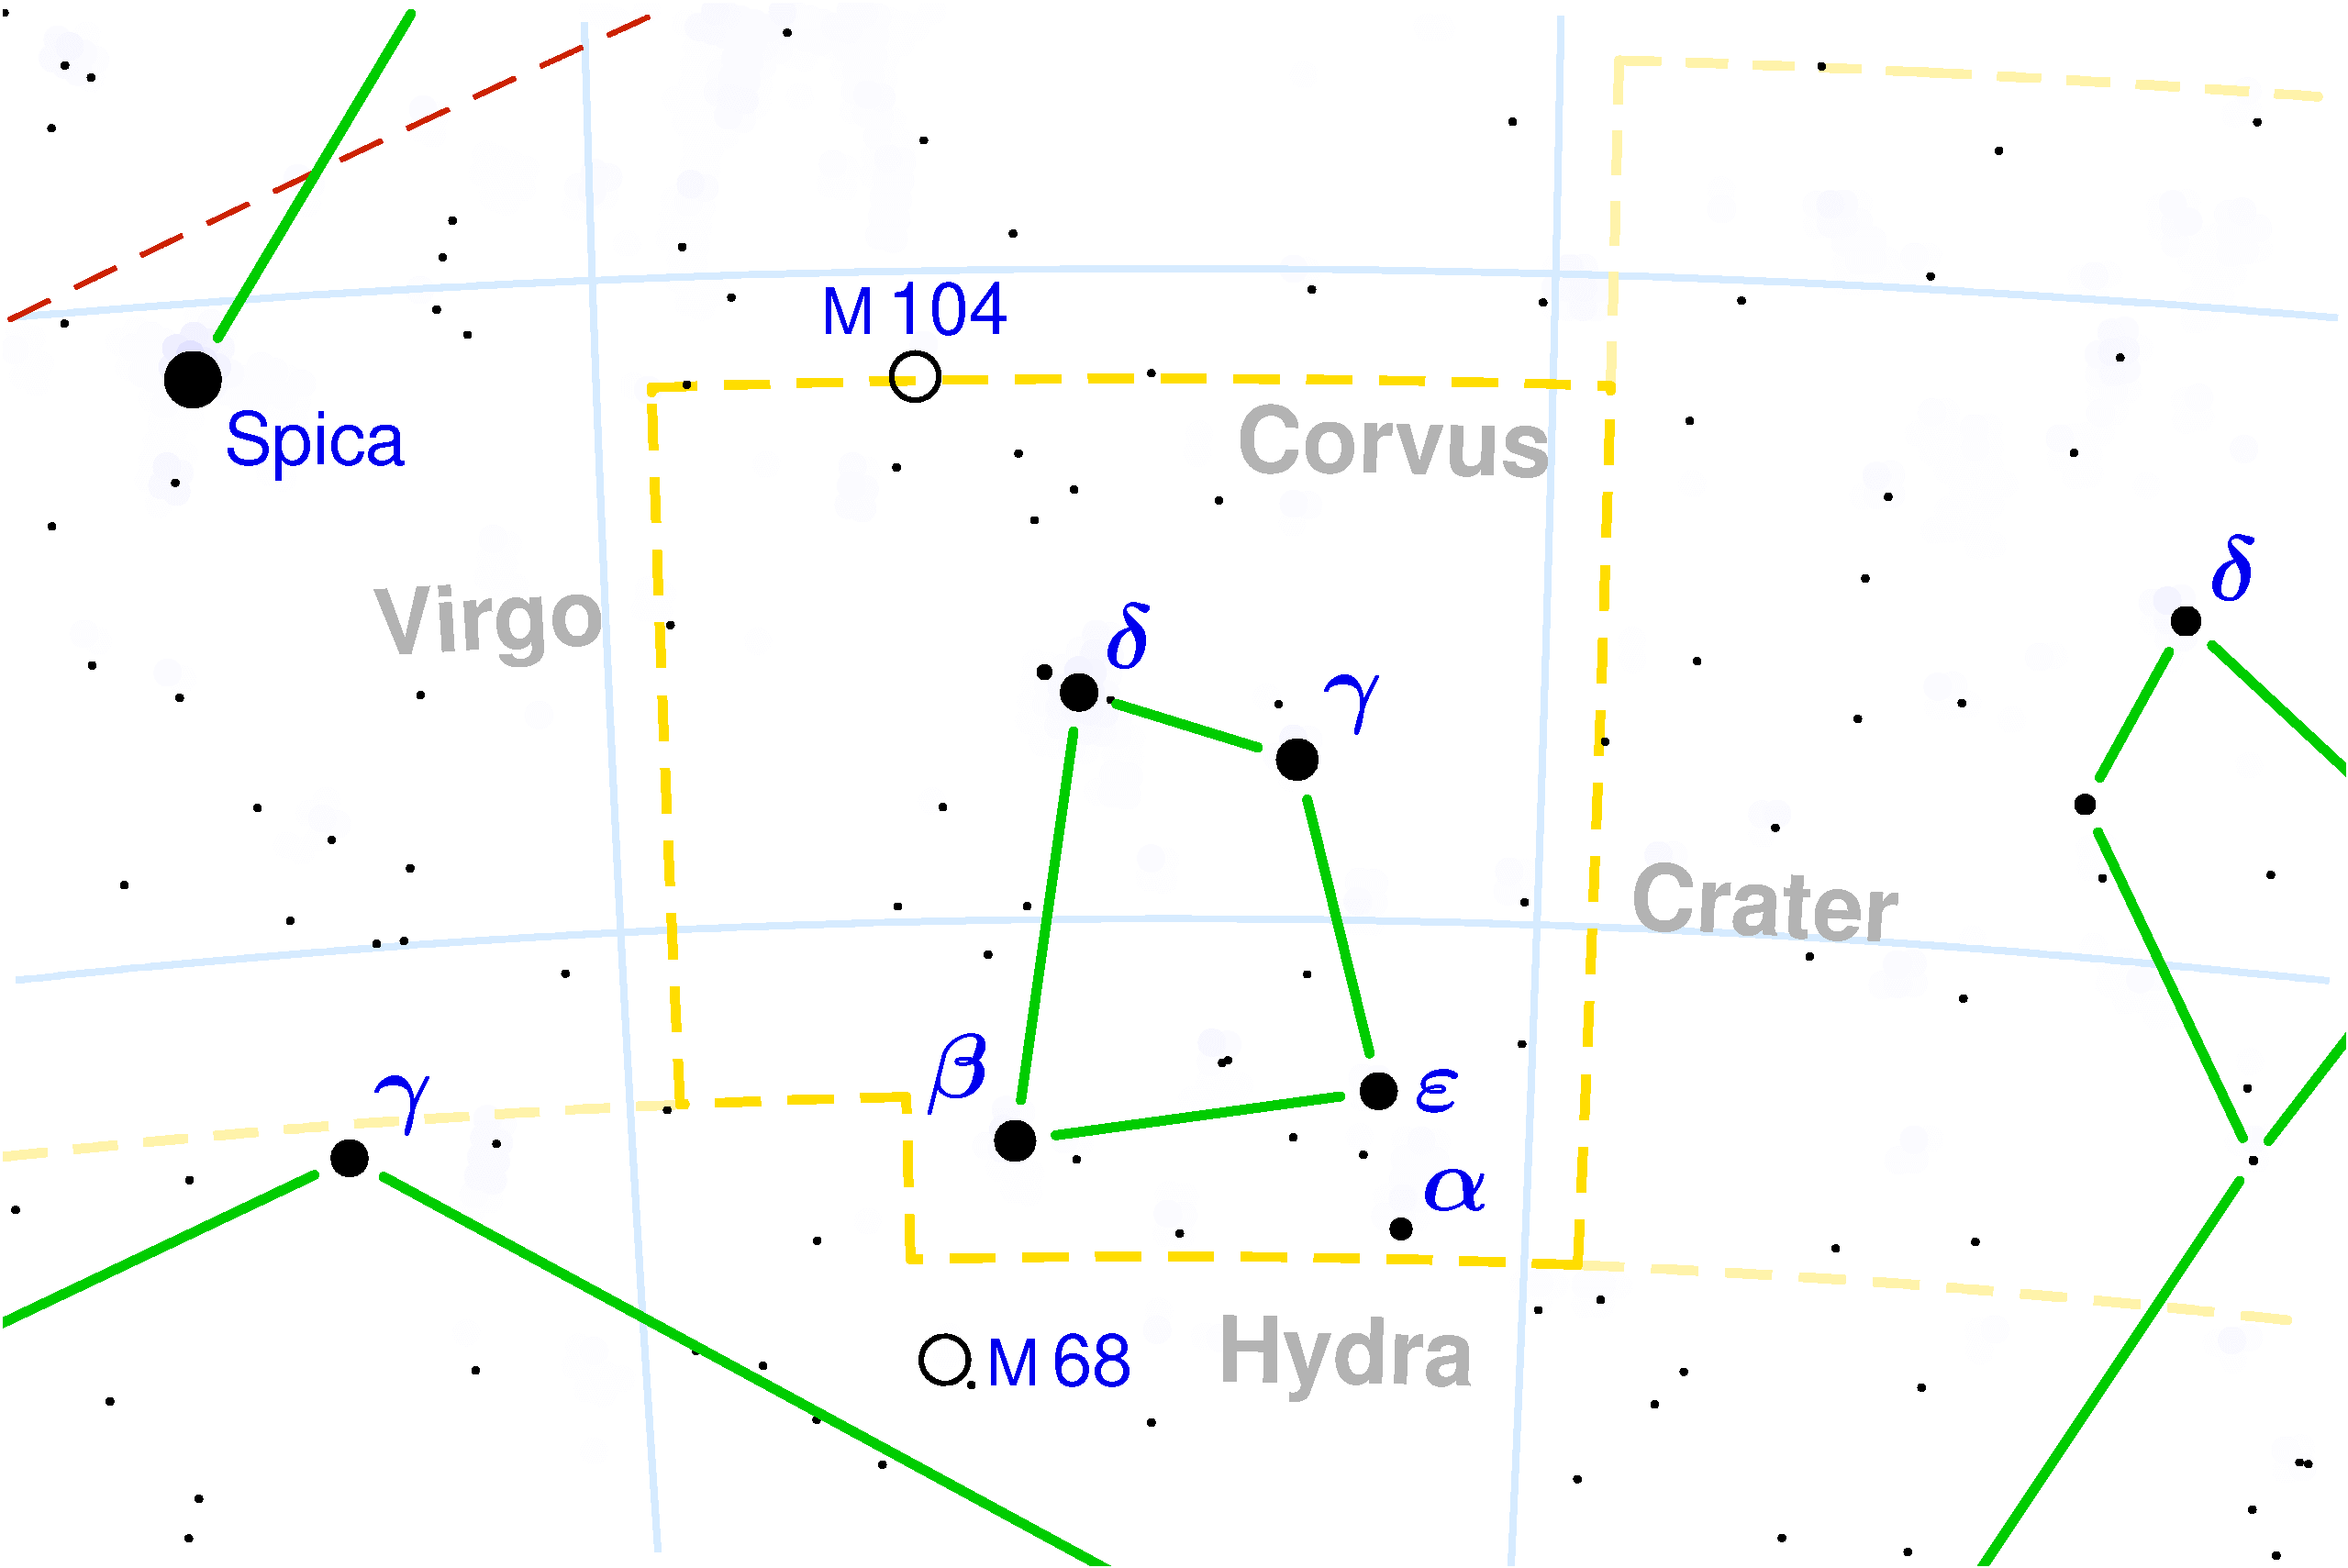
One of these constellation is the Corvus constellation, a southern constellation whose name in Latin means “the Raven”. Bordered by the constellations of Virgo, Crater and Hydra, it is visible at latitudes between +60° and -90° and is best seen at culmination during the month of May. Today, it is one of the 88 modern constellations recognized by the International Astronomical Union (IAU).

Name and Meaning:

In classical mythology, Corvus represents the Raven, and is both a charming and sad tale. Legend tells us that the constellation of Crater is the cup of the gods. This cup belonged to the god of the skies himself, the venerable archer-god Apollo. And who holds this cup, dressed in black? The Raven, Corvus.

“Noctua, Corvus, Crater, Sextans Uraniæ, Hydra, Felis, Lupus, Centaurus, Antlia Pneumatica, Argo Navis, and Pyxis Nautica”, plate 32 in Urania’s Mirror, by Sidney Hall. Credit: Library of Congress

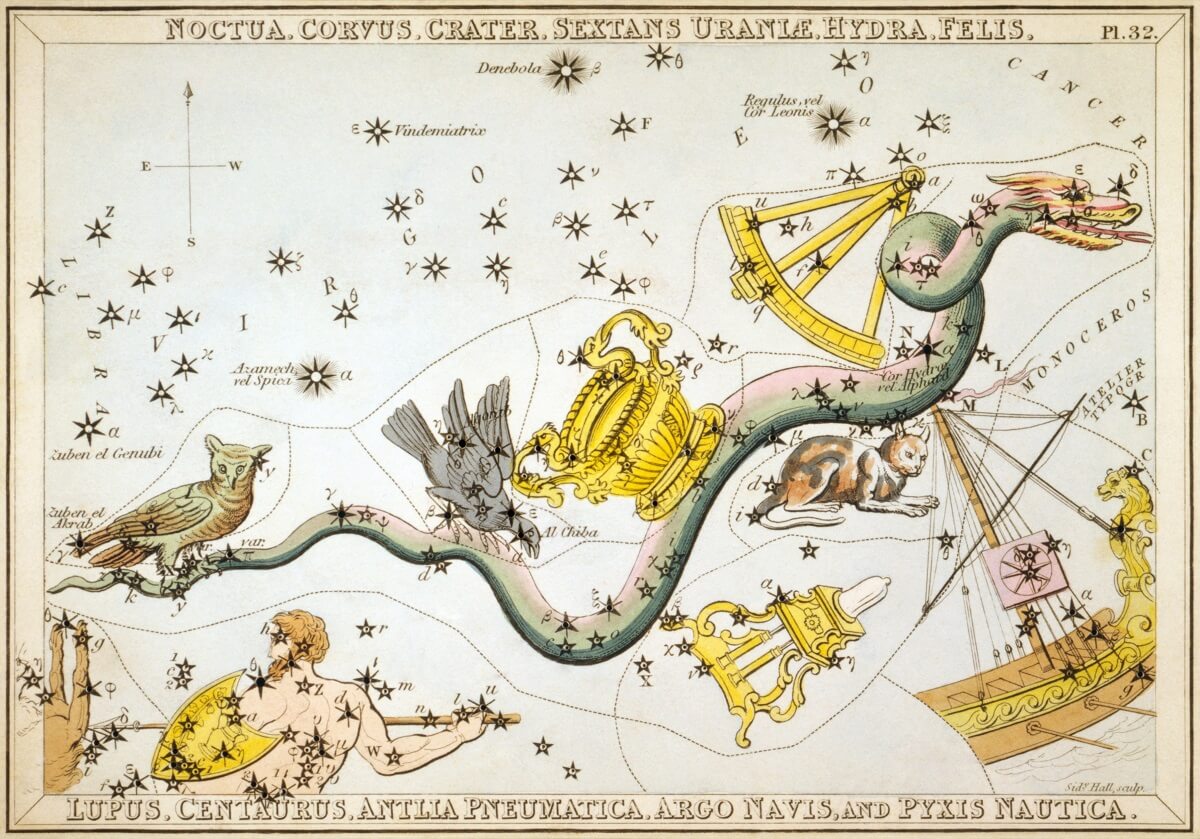
The story of a creature sent to fetch water for his master, only to stop to eat figs. Corvus tarried too long, waiting on a fig to ripen. When he realized his mistake, the Raven returned to Apollo with his cup and brought along the serpent Hydra in his claws as well, claiming that the snake prevented him from filling the cup.

Realizing his feathered-friend’s lie, Apollo became angry and tossed the cup (Crater), the snake (Hydra) and the raven (Corvus) into the sky, where they became constellations for all eternity. He further punished the raven by making sure the cup would be out of reach, thus ensuring he would forever be thirsty.

History of Observation:

As with most of the 48 constellations recorded by Ptolemy, the Corvus constellation has roots that go back to ancient Mesopotamia. In the Babylonian star catalogues (dated to ca. 1100 BCE), Corvus was called the Babylonian Raven (MUL.UGA.MUSHEN), which sat on the tail of the Serpent – which was associated with Ningishzida, the Babylonian god of the underworld. This constellation was also sacred to the god of rains and storm (Adad).

By about 500 BCE, this constellation was introduced to the Greeks, along with Crater, Hydra, Aquila and Piscis Austrinus constellations. By the 2nd century CE, they were included by Ptolemy in his Almagest, which would remain the definitive source on astronomy and astrology to Medieval European and Islamic astronomers for many centuries.

In Chinese astronomy, the stars that make up Corvus are located within the Vermilion Bird of the South (Nán Fang Zhu Què). The four main stars depict a chariot (Zhen) while Alpha and Eta mark the linchpins for the wheels, and Zeta represents a coffin (Changsha).

In Indian astronomy, the first five stars in Corvus correspond to the Hast nakshatra – a lunar zodiacal constellation. This is one of is one of the 27 or 28 divisions of the sky, identified by the prominent stars in them, that the Moon passes through during its monthly cycle. While it is Hindu, it is still very similar to the divisions of the ecliptic plane referred to as the zodiac. The Moon takes approximately one day to pass through each nakshatra.

Notable Objects:

This small, box-like asterism has no bright star and consists of 11 stars which are visible to the unaided eye, yet Ptolemy only listed 7! There are 4 main stars and 10 which have Bayer/Flamsteed designations. For unaided eye observers, the Delta, Gamma, Epsilon and Beta (what appears to look like a figure 8, Y, E and B on the map) form an asterism that looks like a “sail”, and when connected seem to point to the bright star Spica.

The brightest star in Corvus is not even its alpha, but is Gamma Corvi. This giant star (which is thought to be a binary system) is located approximately 165 light years from Earth and is also known as Gienah, which comes from the Arabic phrase al-janah al-ghirab al-yaman (“the right wing of the crow”).

Antennae Galaxies – NGC 4038, NGC 4039. Credit: NASA, ESA, and the Hubble Heritage Team (STScI, AURA)-ESA, Hubble Collaboration

The second-brightest star, Beta Corvi, is a yellow-white G-type bright giant that is located about 140 light years from Earth. Its proper name, Kraz, was assigned to it in modern times, but the origin of the name is uncertain. Delta Corvi is a class A0 star in Corvus located approximately 87 light years distant from Earth whose traditional name (Algorab) comes from the Arabic word al-ghuraab – which means “the crow.”

Epsilon Corvi is a K2 III class star that is approximately 303 light-years from Earth. The star’s traditional name, (Minkar) comes from the Arabic word almánxar, which means “the nostril of the crow.” Alpha Corvi, which is only the fifth brightest star in the constellation, is a class F0 dwarf or subdwarf that is only 48.2 light years distant. The star’s traditional name (Alchiba) is derived from the Arabic al hibaa, which means “tent.”

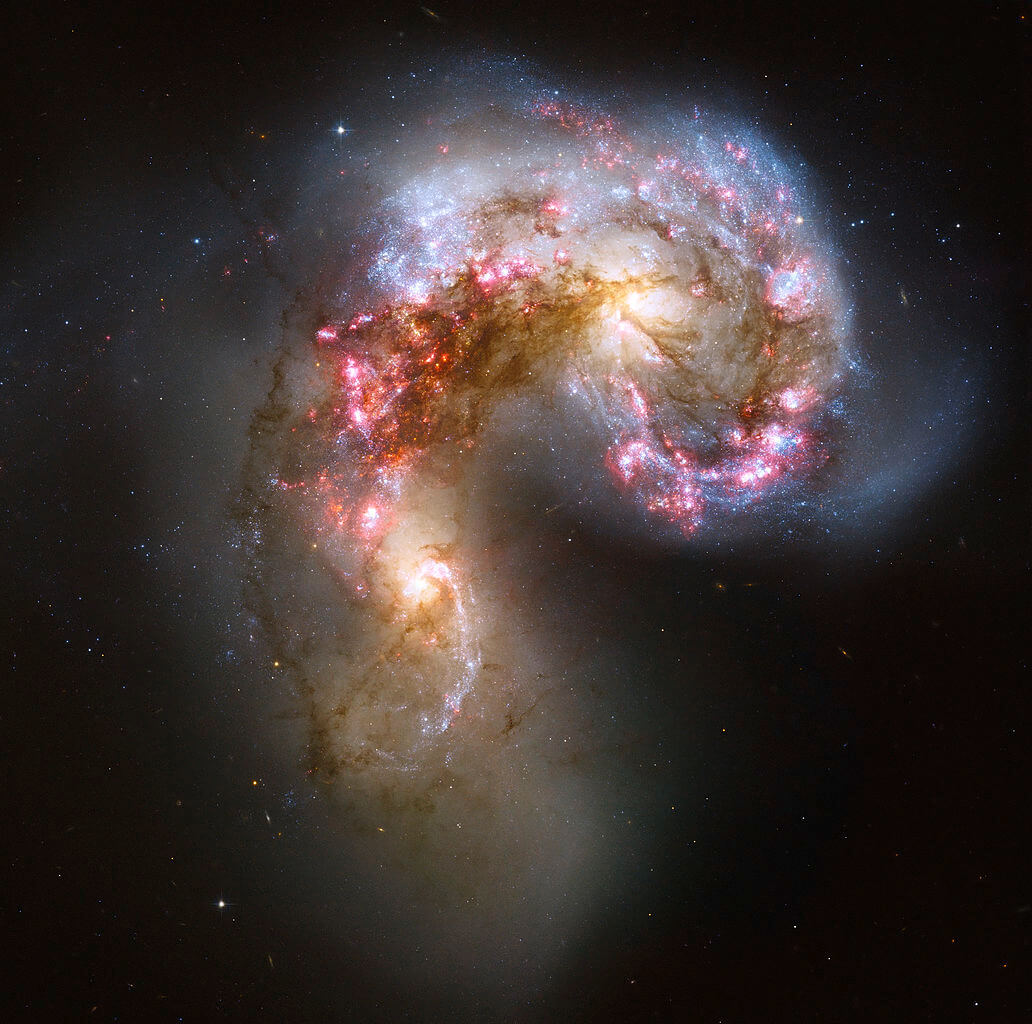
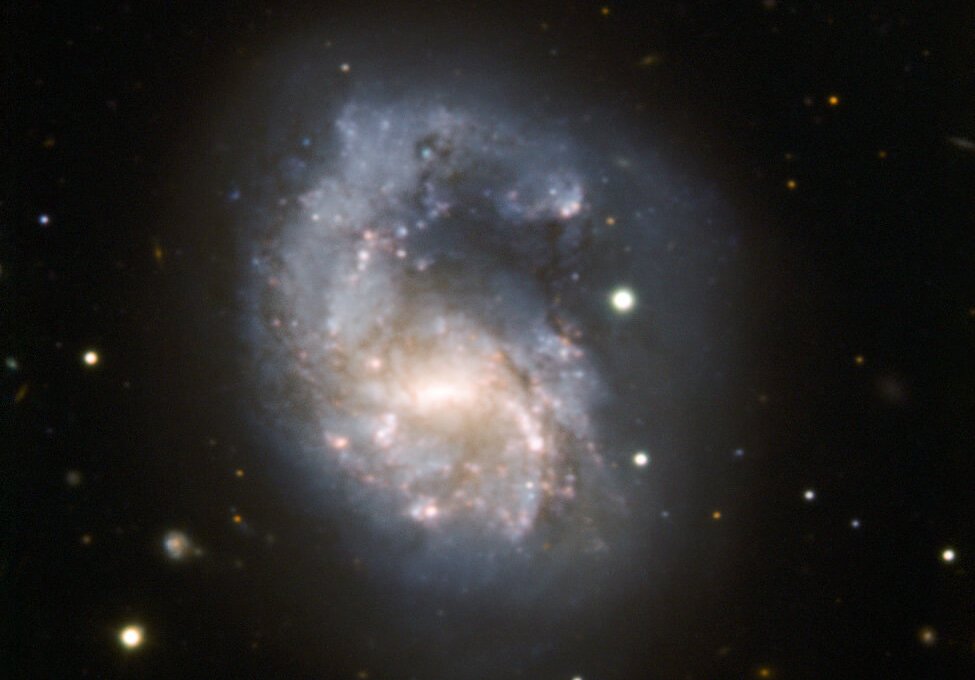
Corvus is also home to many Deep Sky Objects. These include the Antennae Galaxies (NGC 4038/NGC 4039), a pair of interacting galaxies that were first discovered in the late 18th century. These colliding galaxies – which are located 45 million light years from Earth – are currently in the starburst stage, meaning they are experiencing an exceptionally high rate of star forming activity.

There’s also the NGC 4027 barred spiral galaxy, which is located about 83 million light years from Earth. This galaxy is peculiar, in that one of its spiral arm extends further than the other – possibly due to a past collision with another galaxy. Finally, there’s the large planetary nebula known as NGC 4361, which is located at the center of the constellation and resembled a faint elliptical galaxy.

The barred, spiral galaxy known as NGC 4027. Credit : ESO

Finding Corvus:

Let’s start with binoculars and look down at the southern corner, where we will find Alpha Corvi – aka. Alchiba. Alchiba belongs to the spectral class F0 and has apparent magnitude +4.00. This star is suspected of being a spectroscopic binary, although this has not yet been confirmed. Now take a look at Beta Corvi – aka. Kraz. Good old Kraz is approximately 140 light-years away and is a G-type bright giant star whose apparent visual magnitude varies between 2.60 and 2.66.

Head west and look at Epsilon. Although it doesn’t look any further away, spectral class K2 III – Minkar – is 303 light-years from Earth! Need a smile? Then take a look at Gamma, aka. Geinah. How about Delta? Algorab is a spectral class A0 and is about 87 light years from our solar system.

Now get out your telescope as we explore planetary nebula, NGC 4361 (RA 12 24 5 Dec -18 48). At around magnitude 10, this greenish disc is fairly easily spotted with smaller telescopes, but the 13th stellar magnitude central star requires larger aperture to be seen. It has a very symmetrical shape that is similar to a spiral galaxy.

For galaxy fans, have a look at interacting galaxy pair, NGC 4038 and NGC 4039 – the “Ringtail Galaxy” (RA 12 01 53 Dec -18 52-3). This peculiar galaxy (also referred to as the “Antennae Galaxies”) were both discovered by Friedrich Wilhelm Herschel in 1785. Even in relatively small telescopes, you can see two long tails of stars, gas and dust thrown out of the galaxies as a result of the collision that resemble the antennae of an insect.

Map of the Corvus Constellation. Credit: IAU and Sky&Telescope magazine

As explained by Vázquez (et al.) in a 1999 study:

“The morphology of this object is complex given the highly filamentary structure of the envelope, which is confirmed to possess a low mass. The halo has a high expansion velocity that yields incompatible kinematic and evolutionary ages, unless previous acceleration of the nebular expansion is considered. However, the most remarkable result from the present observations is the detection of a bipolar outflow in NGC 4361, which is unexpected in a PN with a Population II low-mass-core progenitor. It is shown that shocks resulting from the interaction of the bipolar outflow with the outer shell are able to provide an additional heating source in this nebula.”

Most galaxies probably undergo at least one significant collision in their lifetimes. This is likely the future of our Milky Way when it collides with the Andromeda Galaxy. Two supernovae have been discovered in the galaxy: SN 2004GT and SN 2007sr. A recent study finds that these interacting galaxies are closer to the Milky Way than previously thought – at 45 million light-years instead of 65 million light-years. Geez… What’s 20 million light years between friends?

We have written many interesting articles about the constellation here at Universe Today. Here is What Are The Constellations?What Is The Zodiac?, and Zodiac Signs And Their Dates.

Be sure to check out The Messier Catalog while you’re at it!

For more information, check out the IAUs list of Constellations, and the Students for the Exploration and Development of Space page on Canes Venatici and Constellation Families.

Sources:

Did you Know There are X-rays Coming from Pluto? That’s Strange, What’s Causing it?

An artist's illustration of Pluto. Credit: NASA/New Horizons

Once held to be the outermost planet of the Solar System, Pluto‘s designation was changed by the International Astronomical Union in 2006, owing to the discovery of many new Kuiper Belt Objects that were comparable in size. In spite of this, Pluto remains a source of fascination and a focal point of much scientific interest. And even after the historic flyby conducted by the New Horizons probe in July of 2015, many mysteries remain.

What’s more, ongoing analysis of the NH data has revealed new mysteries. For instance, a recent study by a team of astronomers indicated that a survey by the Chandra X-ray Observatory revealed the presence of some rather strong x-rays emissions coming from Pluto. This was unexpected, and is causing scientists to rethink what they thought they knew about Pluto’s atmosphere and its interaction with solar wind.

In the past, many Solar bodies have been observed emitting x-rays, which were the result of interaction between solar wind and neutral gases (like argon and nitrogen). Such emissions have been detected from planets like Venus and Mars (due to the presence of argon and/or nitrogen in their atmospheres), but also with smaller bodies like comets – which acquire halos due to outgassing.

Artist’s impression of New Horizons’ close encounter with the Pluto–Charon system. Credit: NASA/JHU APL/SwRI/Steve Gribben

Ever since the NH probe conducted its flyby of Pluto in 2015, astronomers have been aware that Pluto has an atmosphere which changes size and density with the seasons. Basically, as the planet reaches perihelion during its 248 year orbital period – a distance of 4,436,820,000 km, 2,756,912,133 mi from the Sun – the atmosphere thickens due to the sublimation of frozen nitrogen and methane on the surface.

The last time Pluto was at perihelion was on September 5th, 1989, which means that it was still experiencing summer when NH made its flyby. While studying Pluto, the probe detected an atmosphere that was primarily composed of nitrogen gas (N²) along with methane (CH4) and carbon dioxide (CO²). Astronomers therefore decided to look for signs of x-ray emissions coming from Pluto’s atmosphere using the Chandra X-ray Observatory.

Prior to the NH mission’s flyby, most models of Pluto’s atmosphere expected it to be quite extended. However, the probe found that the atmosphere was less extended and that its rate of loss was hundreds of times lower than what these models predicted. Therefore, as the team indicated in their study, they expected to find x-ray emissions that were consistent with what the NH flyby observed:

“Given that most pre-encounter models of Pluto’s atmosphere had predicted it to be much more extended, with an estimated loss rate to space of ~1027 to 1028 mol/sec of N² and CH4… we attempted to detect X-ray emission created by [solar wind] neutral gas charge exchange interactions in the low density neutral gas surrounding Pluto,” they wrote.

Images sent by NASA’s New Horizons spacecraft show possible clouds floating over the frozen landscape including the streaky patch at right. Credit: NASA/JHUAPL/SwR

However, after consulting data from the Advanced CCD Imaging Spectrometer (ACIS) aboard Chandra, they found that x-ray emissions coming from Pluto were greater than what this would allow for.  In some cases, strong x-ray emissions have been noted coming from other smaller objects in the Solar System, which is due to the scattering of solar x-rays by small dust grains composed of carbon, nitrogen and oxygen.

But the energy distribution they noted with Pluto’s x-rays were not consistent with this explanation. Another possibility that the team offered is that they could be due to some process (or processes) that focus the solar wind near Pluto, which would enhance the effect of its modest atmosphere. As they indicate in their conclusions:

“The observed emission from Pluto is not aurorally driven. If due to scattering, it would have to be sourced by a unique population of nanoscale haze grains composed of C, N, and O atoms in Pluto’s atmosphere resonantly fluorescing under the Sun’s insolation. If driven by charge exchange between [solar wind] minor ions and neutral gas species (mainly CH4) escaping from Pluto, then density enhancement and adjustment of the [solar wind] minor ion relative abundance in the interaction region near Pluto is required versus naïve models.”

For the time being, the true cause of these x-ray emissions is likely to remain a mystery. They also highlight the need for more research when it comes to this distant and most massive of Kuiper Belt Objects. Luckily, the data provided by the NH mission is likely to be poured over for decades, revealing new and interesting things about Pluto, the outer Solar System, and how the most distant worlds from our Sun behave.

The study – which was accepted for publication in the journal Icarus – was conducted by astronomers from the Johns Hopkins University Applied Physics Laboratory (JHUAPL), the Harvard-Smithsonian Center for Astrophysics, the Southwest Research Institute (SwI), the Vikram Sarabhai Space Center (VSCC), and NASA’s Jet Propulsion Laboratory and Ames Research Center.

Further Reading: CfA, arXiv

I Wonder if it has Room Service? Here’s the Space Hotel that Won a Recent NASA Competition

The Managed, Reconfigurable, In-space Nodal Assembly (MARINA), developed by MIT graduate students, is designed as a habitable commercially owned module for use in low Earth orbit. Credit: MIT/MARINA team

Looking to the future of space exploration, there really is no question that it will involve a growing human presence in Low Earth Orbit (LEO). This will include not only successors to the International Space Station, but most likely commercial habitats and facilities. These will not only allow for ventures like space tourism, but will also facilitate missions that take us back to the Moon, to Mars, and even beyond.

With this purpose in mind, an interdisciplinary team of MIT graduate students designed a space habitat known as the Managed, Reconfigurable, In-space Nodal Assembly (MARINA). This module would serve as an privately-owned space station that would be occupied by two anchor-tenants for a period of ten years; a luxury hotel that would provide orbital accommodations, and NASA.

For their invention, the team won first prize in the graduate division of the Revolutionary Aerospace Systems Concepts-Academic Linkage Design Competition Forum (RASC-AL), a yearlong graduate-level competition hosted by NASA. This challenge involved designing a commercial module for use in low Earth orbit that could also serve as a Mars transit vehicle in the future.

In the future, LEO will become home to commercial modules (like the Bigelow Aerospace B330 expandable module, shown here), will become a reality. Credit: Bigelow Aerospace

Since 2002, RASC-AL competitions have sought to engage university students and advisors for the purpose of coming up with ideas that could enhancing future NASA missions. For this year’s competition, NASA asked teams to develop human spaceflight concepts that focused on operations in cislunar space – i.e. in, around, and beyond the Moon – that could also facilitate their proposed “Journey to Mars” by the 2030s.

Specifically, they were tasked with finding ways to leverage innovations and new technologies to improve humanity’s ability to work more effectively in microgravity. With this in mind, the themes for this year’s competition ranged from from the design of more efficient subsystems to the development of architectures that support NASA’s goal of extending humanity’s reach into space.

These included new designs for a Lightweight Exercise Suite, Airlock Design, concepts for a Commercially Enabled LEO/Mars Habitable Module, and concepts for a new Logistics Delivery System. As Pat Troutman, the Human Exploration Strategic Analysis lead at NASA’s Langley Research Center, said in a NASA press statement:

“We are carefully examining what it will take to establish a presence beyond low-Earth orbit, where astronauts will build and begin testing the systems needed for challenging missions to distant destinations, including Mars. The 2017 RASC-AL university teams have developed exciting concepts with supporting engineering analysis that may influence how future deep space infrastructure will look and operate.”

Members of the MIT team (from left to right): Caitlin Mueller (faculty advisor), Matthew Moraguez, George Lordos, and Valentina Sumini. Credit: MIT/MARINA team

Led by Matthew Moraguez, a graduate student at MIT’s Department of Aeronautics and Astronautics (AeroAstro) and a member of the Strategic Engineering Research Group (SERG), the MIT team focused on the theme of creating a Commercially Enabled LEO Habitat Module. Their concept, which incorporates lessons that have been learned from the ISS, was designed with the needs of both the private and public space sectors in mind.

As George Lordos – a graduate fellow in the MIT System Design and Management (SDM) Program, and a team member of both MARINA and SERG – explained:

“Just like a yacht marina, MARINA can provide all essential services, including safe harbor, reliable power, clean water and air, and efficient logistics and maintenance. This will facilitate design simplicity and savings in construction and operating costs of customer-owned modules. It will also incent customers to lease space inside and outside MARINA’s node modules and make MARINA a self-funded entity that is attractive to investors.”

To meet their goals for the competition , the team came up with a modular design for MARINA that featured several key innovations. These included extensions to the International Docking System Standard (IDSS) interface (used aboard the ISS), modular architecture, and a distribution of subsystem functions throughout these modules. As Moraguez explained, their design will allow for some wide-ranging opportunities.

“Modularized service racks connect any point on MARINA to any other point via the extended IDSS interface,” he said. “This enables companies of all sizes to provide products and services in space to other companies, based on terms determined by the open market. Together these decisions provide scalability, reliability, and efficient technology development benefits to MARINA and NASA.”

Another important benefit comes in the form of cost-savings. According to NASA estimates, the recurring cost of MARINA will be about $360 million per year, which represents a significant reduction over the current costs of maintaining and operating the ISS. In total, it would offer NASA a savings of about $3 billion per year, which is approximately 16% of the agency’s annual budget.

But what is perhaps most interesting about the MARINA concept is the fact that it could serve as the world’s first space hotel. According to Valentina Suminia, a postdoc at MIT who contributed to the architectural concept, the space hotel will be “a luxury Earth-facing eight-room space hotel complete with bar, restaurant, and gym, will make orbital space holidays a reality.”

Other commercial features include serviced berths that would be rented out to accommodate customer-owned modules. This goes for the station’s interior modularized rack space as well, where smaller companies that provide contract services to on-board occupants would be able to rent out space. Would it be too much to ask that it also has robot butlers?

The RASCAL competition began in August of 2016 in Cocoa Beach, Florida, and concluded on June 2nd, 2017. The top overall honors were awarded to the teams from Virginia Tech and the University of Maryland for their space habitat concepts, known as Project Theseus and Ultima Thule, respectively.

Further Reading: MIT, NASA

How Much Stuff is in a Light Year?

How Much Stuff is in a Light Year?

The Milky Way is an extremely big place. Measured from end to end, our galaxy in an estimated 100,000 to 180,000 light years (31,000 – 55,000 parsecs) in diameter. And it is extremely well-populated, with an estimated 100 to 400 million stars contained within. And according to recent estimates, it is believed that there are as many as 100 billion planets in the Milky Way. And our galaxy is merely one of trillions within the Universe.

So if we were to break it down, just how much matter would we find out there? Estimating how much there is overall would involve some serious math and incredible figures. But what about a single light year? As the most commonly-used unit for measuring the distances between stars and galaxies, determining how much stuff can be found within a single light year (on average) is a good way to get an idea of how stuff is out there.

Light Year:

Even though the name is a little confusing, you probably already know that a light year is the distance that light travels in the space of a year. Given that the speed of light has been measured to 299,792, 458 m/s (1080 million km/h; 671 million mph), the distance light travels in a single year is quite immense. All told, a single light year works out to 9,460,730,472,580.8 kilometers (5,878,625,373,183.6 mi).

Diagram showing the distance light travels between the Sun and the Earth. Credit: Wikipedia Commons/Brews ohare

So to determine how much stuff is in a light year, we need to take that distance and turn it into a cube, with each side measuring one light year in length. Imagine that giant volume of space (a little challenging for some of us to get our heads around) and imagine just how much “stuff” would be in there. And not just “stuff”, in the sense of dust, gas, stars or planets, either. How much nothing is in there, as in, the empty vacuum of space?

There is an answer, but it all depends on where you put your giant cube. Measure it at the core of the galaxy, and there are stars buzzing around all over the place. Perhaps in the heart of a globular cluster? In a star forming nebula? Or maybe out in the suburbs of the Milky Way? There’s also great voids that exist between galaxies, where there’s almost nothing.

Density of the Milky Way:

There’s no getting around the math in this one. First, let’s figure out an average density for the Milky Way and then go from there. Its about 100,000 to 180,000 light-years across and 1000 light-years thick. According to my buddy and famed astronomer Phil Plait (of Bad Astronomy), the total volume of the Milky Way is about 8 trillion cubic light-years.

And the total mass of the Milky Way is 6 x 1042 kilograms (that’s 6,000 trillion trillion trillion metric tons or 6,610 trillion trillion trillion US tons). Divide those together and you get 8 x 1029 kilograms (800 trillion trillion metric tons or 881.85 trillion trillion US tons) per light year. That’s an 8 followed by 29 zeros. This sounds like a lot, but its actually the equivalent of 0.4 Solar Masses – 40% of the mass of our Sun.

This image from the Wide Field Imager on the MPG/ESO 2.2-metre telescope at ESO’s La Silla Observatory in Chile, shows the bright star cluster NGC 6520 and its neighbour, the strangely shaped dark cloud Barnard 86. This cosmic pair is set against millions of glowing stars from the brightest part of the Milky Way — a region so dense with stars that barely any dark sky is seen across the picture.
Millions of glowing stars from the brightest part of the Milky Way — a region so dense with stars that barely any dark sky is seen across the picture. Credit: ESO

In other words, on average, across the Milky Way, there’s about 40% the mass of the Sun in every cubic light year. But in an average cubic meter, there’s only about 950 attograms, which is almost one femtogram (a quadrillionth of a gram of matter), which is pretty close to nothing. Compare this to air, which has more than a kilogram of mass per cubic meter.

To be fair, in the densest regions of the Milky Way – like inside globular clusters – you can get densities of stars with 100, or even 1000 times greater than our region of the galaxy. Stars can get as close together as the radius of the Solar System. But out in the vast interstellar gulfs between stars, the density drops significantly. There are only a few hundred individual atoms per cubic meter in interstellar space.

And in the intergalactic voids; the gulfs between galaxies, there are just a handful of atoms per meter. Like it or not, much of the Universe is pretty close to being empty space, with just trace amounts of dust or gas particles to be found between all the stars, galaxies, clusters and super clusters.

So how much stuff is there in a light year? It all depends on where you look, but if you spread all the matter around by shaking the Universe up like a snow globe, the answer is very close to nothing.

We have written many interesting articles about the Milky Way Galaxy here at Universe Today. Here’s 10 Interesting Facts About the Milky Way, How Big is the Milky Way?, How Many Stars are There in the Milky Way?, Where is the Earth Located in the Milky Way?, How Far is a Light Year?, and How Far Does Light Travel in a Year?

For more information, check out How many teaspoons are there in a cubic light year? at HowStuffWorks

Astronomy Cast also has a good episode on the subject. Here’s Episode 99: The Milky Way

Sources:

How Does Mercury Compare to Earth?

Mercury and Earth, size comparison. Credit: NASA / APL (from MESSENGER)

Mercury was appropriately named after the Roman messenger of the Gods. This is owed to the fact that its apparent motion in the night sky was faster than that of any of the other planets. As astronomers learned more about this “messenger planet”, they came to understand that its motion was due to its close orbit to the Sun, which causes it to complete a single orbit every 88 days.

Mercury’s proximity to the Sun is merely one of its defining characteristics. Compared to the other planets of the Solar System, it experiences severe temperature variations, going from very hot to very cold. It’s also very rocky, and has no atmosphere to speak of. But to truly get a sense of how Mercury stacks up compared to the other planets of the Solar System, we need to a look at how Mercury compares to Earth.

Size, Mass and Orbit:

The diameter of Mercury is 4,879 km, which is approximately 38% the diameter of Earth. In other words, if you put three Mercurys side by side, they would be a little larger than the Earth from end to end. While this makes Mercury smaller than the largest natural satellites in our system – such as Ganymede and Titan – it is more massive and far more dense than they are.

Mercury, as imaged by the MESSENGER spacecraft, revealing parts of the never seen by human eyes. Image Credit: NASA/JHUAPL/Carnegie Institution of Washington

In fact, Mercury’s mass is approximately 3.3 x 10²³ kg (5.5% the mass of Earth) which means that its density – at 5.427 g/cm3 – is the second highest of any planet in the Solar System, only slightly less than Earth’s (5.515 g/cm3). This also means that Mercury’s surface gravity is 3.7 m/s2, which is the equivalent of 38% of Earth’s gravity (0.38 g). This means that if you weighed 100 kg (220 lbs) on Earth, you would weigh 38 kg (84 lbs) on Mercury.

Meanwhile, the surface area of Mercury is 75 million square kilometers, which is approximately 10% the surface area of Earth. If you could unwrap Mercury, it would be almost twice the area of Asia (44 million square km). And the volume of Mercury is 6.1 x 10¹⁰ km3, which works out to 5.4% the volume of Earth. In other words, you could fit Mercury inside Earth 18 times over and still have a bit of room to spare.

In terms of orbit, Mercury and Earth probably could not be more different. For one, Mercury has the most eccentric orbit of any planet in the Solar System (0.205), compared to Earth’s 0.0167. Because of this, its distance from the Sun varies between 46 million km (29 million mi) at its closest (perihelion) to 70 million km (43 million mi) at its farthest (aphelion).

This puts Mercury much closer to the Sun than Earth, which orbits at an average distance of 149,598,023 km (92,955,902 mi), or 1 AU. This distance ranges from 147,095,000 km (91,401,000 mi) to 152,100,000 km (94,500,000 mi) – 0.98 to 1.017 AU. And with an average orbital velocity of 47.362 km/s (29.429 mi/s), it takes Mercury a total 87.969 Earth days to complete a single orbit – compared to Earth’s 365.25 days.

The Orbit of Mercury during the year 2006. Credit: Wikipedia Commons/Eurocommuter

However, since Mercury also takes 58.646 days to complete a single rotation, it takes 176 Earth days for the Sun to return to the same place in the sky (aka. a solar day). So on Mercury, a single day is twice as long as a single year. Meanwhile on Earth, a single solar day is 24 hours long, owing to its rapid rotation of 1674.4 km/h. Mercury also has the lowest axial tilt of any planet in the Solar System – approximately 0.027°, compared to Earth’s 23.439°.

Structure and Composition:

Much like Earth, Mercury is a terrestrial planet, which means it is composed of silicate minerals and metals that are differentiated between a solid metal core and a silicate crust and mantle. For Mercury, the breakdown of these elements is higher than Earth. Whereas Earth is primarily composed of silicate minerals, Mercury is composed of 70% metallic and 30% of silicate materials.

Also like Earth, Mercury’s interior is believed to be composed of a molten iron that is surrounded by a mantle of silicate material. Mercury’s core, mantle and crust measure 1,800 km, 600 km, and 100-300 km thick, respectively; while Earth’s core, mantle and crust measure 3478 km, 2800 km, and up to 100 km thick, respectively.

What’s more, geologists estimate that Mercury’s core occupies about 42% of its volume (compared to Earth’s 17%) and the core has a higher iron content than that of any other major planet in the Solar System. Several theories have been proposed to explain this, the most widely accepted being that Mercury was once a larger planet that was struck by a planetesimal that stripped away much of the original crust and mantle.

Internal structure of Mercury: 1. Crust: 100–300 km thick 2. Mantle: 600 km thick 3. Core: 1,800 km radius. Credit: MASA/JPL

Surface Features:

In terms of its surface, Mercury is much more like the Moon than Earth. It has a dry landscape pockmarked by asteroid impact craters and ancient lava flows. Combined with extensive plains, these indicate that the planet has been geologically inactive for billions of years.

Names for these features come from a variety of sources. Craters are named for artists, musicians, painters, and authors; ridges are named for scientists; depressions are named after works of architecture; mountains are named for the word “hot” in different languages; planes are named for Mercury in various languages; escarpments are named for ships of scientific expeditions, and valleys are named after radio telescope facilities.

During and following its formation 4.6 billion years ago, Mercury was heavily bombarded by comets and asteroids, and perhaps again during the Late Heavy Bombardment period. Due to its lack of an atmosphere and precipitation, these craters remain intact billions of years later. Craters on Mercury range in diameter from small bowl-shaped cavities to multi-ringed impact basins hundreds of kilometers across.

The largest known crater is Caloris Basin, which measures 1,550 km (963 mi) in diameter. The impact that created it was so powerful that it caused lava eruptions on the other side of the planet and left a concentric ring over 2 km (1.24 mi) tall surrounding the impact crater. Overall, about 15 impact basins have been identified on those parts of Mercury that have been surveyed.

Enhanced-color image of Munch, Sander and Poe craters amid volcanic plains (orange) near Caloris Basin. Credit: NASA/JHUAPL/Carnegie Institution of Washington

Earth’s surface, meanwhile, is significantly different. For starters, 70% of the surface is covered in oceans while the areas where the Earth’s crust rises above sea level forms the continents. Both above and below sea level, there are mountainous features, volcanoes, scarps (trenches), canyons, plateaus, and abyssal plains. The remaining portions of the surface are covered by mountains, deserts, plains, plateaus, and other landforms.

Mercury’s surface shows many signs of being geologically active in the past, mainly in the form of narrow ridges that extend up to hundreds of kilometers in length. It is believed that these were formed as Mercury’s core and mantle cooled and contracted at a time when the crust had already solidified. However, geological activity ceased billions of years ago and its crust has been solid ever since.

Meanwhile, Earth is still geologically active, owning to convection of the mantle. The lithosphere (the crust and upper layer of the mantle) is broken into pieces called tectonic plates. These plates move in relation to one another and interactions between them is what causes earthquakes, volcanic activity (such as the “Pacific Ring of Fire“), mountain-building, and oceanic trench formation.

Atmosphere and Temperature:

When it comes to their atmospheres, Earth and Mercury could not be more different. Earth has a dense atmosphere composed of five main layers – the Troposphere, the Stratosphere, the Mesosphere, the Thermosphere, and the Exosphere. Earth’s atmosphere is also primarily composed of nitrogen (78%) and oxygen (21%) with trace concentrations of water vapor, carbon dioxide, and other gaseous molecules.

The Fast Imaging Plasma Spectrometer on board MESSENGER has found that the solar wind is able to bear down on Mercury enough to blast particles from its surface into its wispy atmosphere. Credit: Shannon Kohlitz, Media Academica, LLC

Because of this, the average surface temperature on Earth is approximately 14°C, with plenty of variation due to geographical region, elevation, and time of year. The hottest temperature ever recorded on Earth was 70.7°C (159°F) in the Lut Desert of Iran, while the coldest temperature was -89.2°C (-129°F) at the Soviet Vostok Station on the Antarctic Plateau.

Mercury, meanwhile, has a tenuous and variable exosphere that is made up of hydrogen, helium, oxygen, sodium, calcium, potassium and water vapor, with a combined pressure level of about 10-14 bar (one-quadrillionth of Earth’s atmospheric pressure). It is believed this exosphere was formed from particles captured from the Sun, volcanic outgassing and debris kicked into orbit by micrometeorite impacts.

Because it lacks a viable atmosphere, Mercury has no way to retain the heat from the Sun. As a result of this and its high eccentricity, the planet experiences far more extreme variations in temperature than Earth does. Whereas the side that faces the Sun can reach temperatures of up to 700 K (427° C), the side that is in darkness can reach temperatures as low as 100 K (-173° C).

Despite these highs in temperature, the existence of water ice and even organic molecules has been confirmed on Mercury’s surface. The floors of deep craters at the poles are never exposed to direct sunlight, and temperatures there remain below the planetary average. In this respect, Mercury and Earth have something else in common, which is the presence of water ice in its polar regions.

Mercury’s Magnetic Field. Credit: NASA

Magnetic Fields:

Much like Earth, Mercury has a significant, and apparently global, magnetic field, one which is about 1.1% the strength of Earth’s. It is likely that this magnetic field is generated by a dynamo effect, in a manner similar to the magnetic field of Earth. This dynamo effect would result from the circulation of the planet’s iron-rich liquid core.

Mercury’s magnetic field is strong enough to deflect the solar wind around the planet, thus creating a magnetosphere. The planet’s magnetosphere, though small enough to fit within Earth, is strong enough to trap solar wind plasma, which contributes to the space weathering of the planet’s surface.

All told, Mercury and Earth are in stark contrast. While both are terrestrial in nature, Mercury is significantly smaller and less massive than Earth, though it has a similar density. Mercury’s composition is also much more metallic than that of Earth, and its 3:2 orbital resonance results in a single day being twice as long as a year.

But perhaps most stark of all are the extremes in temperature variations that Mercury goes through compared to Earth. Naturally, this is due to the fact that Mercury orbits much closer to the Sun than the Earth does and has no atmosphere to speak of. And its long days and long nights also mean that one side is constantly being baked by the Sun, or in freezing darkness.

We have written many stories about Mercury on Universe Today. Here’s Interesting Facts About Mercury, What Type of Planet is Mercury?, How Long is a Day on Mercury?, The Orbit of Mercury. How Long is a Year on Mercury?, What is the Surface Temperature of Mercury?, Water Ice and Organics Found at Mercury’s North Pole, Characteristics of Mercury,, Surface of Mercury, and Missions to Mercury

If you’d like more information on Mercury, check out NASA’s Solar System Exploration Guide, and here’s a link to NASA’s MESSENGER Misson Page.

We have also recorded a whole episode of Astronomy Cast that’s just about planet Mercury. Listen to it here, Episode 49: Mercury.

Sources:

How Far Does Light Travel in a Year?

Diagram showing the distance light travels between the Sun and the Earth. Credit: Wikipedia Commons/Brews ohare

The Universe is an extremely big place. As astronomers looked farther into space over the centuries, and deeper into the past, they came to understand just how small and insignificant our planet and our species seem by comparison. At the same time, ongoing investigations into electromagnetism and distant stars led scientists to deduce what the the speed of light is – and that it is the fastest speed obtainable.

As such, astronomers have taken to using the the distance light travels within a single year (aka. a light year) to measure distances on the interstellar and intergalactic scale. But how far does light travel in a year? Basically, it moves at a speed of 299,792,458 meters per second (1080 million km/hour; 671 million mph), which works out to about 9,460.5 trillion km (5,878.5 trillion miles) per year.

The Speed of Light:

Calculating the speed of light has been a preoccupation for scientists for many centuries. And prior to the 17th century, there was disagreement over whether the speed of light was finite, or if it moved from one spot to the next instantaneously. In 1676, Danish astronomer Ole Romer settled the argument when his observations of the apparent motion of Jupiter’s moon Io revealed that the speed of light was finite.

Light moves at different wavelengths, represented here by the different colors seen in a prism. Credit: NASA/ESA

From his observations, famed Dutch astronomer Christiaan Huygens calculated the speed of light at 220,000 km/s (136,701 mi/s). Over the course of the nest two centuries, the speed of light was refined further and further, producing estimates that ranged from about 299,000 to 315,000 km/s (185,790 to 195,732 mi/s).

This was followed by James Clerk Maxwell, who proposed in 1865 that light was an electromagnetic wave. In his theory of electromagnetism, the speed of light was represented as c. And then in 1905, Albert Einstein proposed his theory of Special Relativity, which postulated that the speed of light (c) was constant, regardless of the inertial reference frame of the observer or the motion of the light source.

By 1975, after centuries of refined measurements, the speed of light in a vacuum was calculated at 299,792,458 meters per second. Ongoing research also revealed that light travels at different wavelengths and is made up of subatomic particles known as photons, which have no mass and behave as both particles and waves.

Light-Year:

As already noted, the speed of light (expressed in meters per second) means that light travels a distance of 9,460,528,000,000 km (or 5,878,499,817,000 miles) in a single year. This distance is known as a “light year”, and is used to measure objects in the Universe that are at a considerable distances from us.

Examples of objects in our Universe, and the scale of their distances, based on the light year as a standard measure. Credit: Bob King.

For example, the nearest star to Earth (Proxima Centauri) is roughly 4.22 light-years distant. The center of the Milky Way Galaxy is 26,000 light-years away, while the nearest large galaxy (Andromeda) is 2.5 million light-years away. To date, the candidate for the farthest galaxy from Earth is MACS0647-JD, which is located approximately 13.3 billion light years away.

And the Cosmic Microwave Background, the relic radiation which is believed to be leftover from the Big Bang, is located some 13.8 billion light years away. The discovery of this radiation not only bolstered the Big Bang Theory, but also gave astronomers an accurate assessment of the age of the Universe. This brings up another important point about measuring cosmic distances in light years, which is the fact that space and time are intertwined.

You see, when we see the light coming from a distant object, we’re actually looking back in time. When we see the light from a star located 400 light-years away, we’re actually seeing light that was emitted from the star 400 years ago. Hence, we’re seeing the star as it looked 400 years ago, not as it appears today. As a result, looking at objects billions of light-years from Earth is to see billions of light-years back in time.

Yes, light travels at an extremely fast speed. But given the sheer size and scale of the Universe, it can still take billions of years from certain points in the Universe to reach us here on Earth. Hence why knowing how long it takes for light to travel a single year is so useful to scientists. Not only does it allow us to comprehend the scale of the Universe, it also allows us to chart the process of cosmic evolution.

We have written many articles about the speed of light here at Universe Today. Here’s How Far is a Light Year?, What is the Speed of Light?, How Much Stuff is in a Light Year?, How Does Light Travel?, and How Far Can You See in the Universe?

Want more info on light-years? Here’s an article about light-years for HowStuffWorks, and here’s an answer from PhysLink.

We’ve also recorded an episode of Astronomy Cast on this topic. Listen here, Episode 10: Measuring Distance in the Universe.

Sources:

Messier 49 – the NGC 4472 Elliptical Galaxy

The location of M49, in proximity to other Messier Objects and major stars. Credit: Wikisky

Welcome back to Messier Monday! In our ongoing tribute to the great Tammy Plotner, we take a look at Orion’s Nebula’s “little brother”, the De Marian’s Nebula!

During the 18th century, famed French astronomer Charles Messier noted the presence of several “nebulous objects” in the night sky. Having originally mistaken them for comets, he began compiling a list of them so that others would not make the same mistake he did. In time, this list (known as the Messier Catalog) would come to include 100 of the most fabulous objects in the night sky.

One of these objects is the elliptical galaxy known as Messier 49 (aka. NGC 4472). Located in the southern skies in the constellation of Virgo, this galaxy is one several members of the Virgo Cluster of galaxies and is located 55.9 million light years from Earth. On a clear night, and allowing for good light conditions, it can be seen with binoculars or a small telescope, and will appear as a hazy patch in the sky.

Description:

Messier 49 is the brightest of the Virgo Cluster member galaxies, which is pretty accurate considering it’s only about 60 million light years away and may span an area as large as 160,000 light years. It is a huge system of globular clusters, much less concentrated than Virgo cluster member M87 – but a giant none the less. As Stephen E. Zep (et al) wrote in a 2000 study:

“We present new radial velocities for 87 globular clusters around the elliptical galaxy NGC 4472 and combine these with our previously published data to create a data set of velocities for 144 globular clusters around NGC 4472. We utilize this data set to analyze the kinematics of the NGC 4472 globular cluster system. The new data confirm our previous discovery that the metal-poor clusters have significantly higher velocity dispersion than the metal-rich clusters in NGC 4472. The very small angular momentum in the metal-rich population requires efficient angular momentum transport during the formation of this population, which is spatially concentrated and chemically enriched. Such angular momentum transfer can be provided by galaxy mergers, but it has not been achieved in other extant models of elliptical galaxy formation that include dark matter halos. We also calculate the velocity dispersion as a function of radius and show that it is consistent with roughly isotropic orbits for the clusters and the mass distribution of NGC 4472 inferred from X-ray observations of the hot gas around the galaxy.”

This ground-based image shows the Small Magellanic Cloud. The area of the SMIDGE survey is highlighted, as well as the position of NGC 248. Credit: NASA/ESA/Hubble/Digitized Sky Survey 2

However, there was something going on in the mass structure of M49 that astronomers were curious about… Something they couldn’t quite explain. Was it dark matter? As M. Lowenstein wrote in a 1992 study:

“An attempt to constrain the total mass distribution of the well-observed giant elliptical galaxy NGC 4472 is realized by constructing simultaneous equilibrium models for the gas and stars using all available relevant optical and X-ray data. The value of <?>, the emission-weighted average value of kT, derived from the Ginga spectrum, <?> = 1.9 ± 0.2 keV, can be reproduced only in hydrostatic models where nonluminous matter comprises at least 90% of the total mass. However, in general, these mass models are not consistent with observed projected stellar and globular cluster velocity dispersions at moderate radii.”

The next thing you know, nuclear outburst were discovered – the product of interaction with a neighboring galaxy. As B. Biller (et al) indicated in a 2004 study:

“We present the analysis of the Chandra ACIS observations of the giant elliptical galaxy NGC 4472. The Chandra Observatory’s arcsec resolution reveals a number of new features. Specifically: 1) an ~8 arc min streamer or arm (this corresponds to a linear size of 36 kpc) extending southwest of the galaxy and an assymetrical, somewhat truncated streamer to the northeast. Smaller, morphologically similar structures are observed in NGC 4636 and are explained as shocks from a nuclear outburst in the recent past. The larger size of the NGC 4472 streamers requires a correspondingly higher energy input compared to the NGC 4636 case. The asymmetry of the streamers may be due to the interaction of NGC 4472 with the ambient Virgo cluster gas. 2) A string of small, extended sources south of the nucleus. These sources may stem from an interaction of NGC 4472 with the galaxy UGC 7637. 3) X-ray cavities corresponding to radio lobes, where expanding radio plasma has evacuated the X-ray emitting gas. We also present a luminosity function for the X-ray point sources detected within NGC 4472 which we compare to that for other early type galaxies.”

Chandra images showing 4 of the 9 galaxies discovered (left), and an artist’s impression on showing how gas falls towards a black hole and becomes a rapidly spinning disk of matter near the center (right). Credit: NASA/Chandra

But the very best was yet to come… the discovery of a black hole! According to NASA, the results from NASA’s Chandra X-ray Observatory, combined with new theoretical calculations, provide one of the best pieces of evidence yet that many supermassive black holes are spinning extremely rapidly. The images on the left show 4 out of the 9 large galaxies included in the Chandra study, each containing a supermassive black hole in its center.

The Chandra images show pairs of huge bubbles, or cavities, in the hot gaseous atmospheres of the galaxies, created in each case by jets produced by a central supermassive black hole. Studying these cavities allows the power output of the jets to be calculated. This sets constraints on the spin of the black holes when combined with theoretical models. The Chandra images were also used to estimate how much fuel is available for each supermassive black hole, using a simple model for the way matter falls towards such an object.

The artist’s impression on the right side of the main graphic shows gas within a “sphere of influence” falling straight inwards towards a black hole before joining a rapidly spinning disk of matter near the center. Most of the material in this disk is swallowed by the black hole, but some of it is swept outwards in jets (colored blue) by quickly spinning magnetic fields close to the black hole.

Previous work with these Chandra data showed that the higher the rate at which matter falls towards these supermassive black holes, the higher their power output is in jets. However, without detailed theory the implications of this result for black hole behavior were unclear. The new study uses these Chandra results combined with leading theoretical models for the production of jets, plus general relativity, to show that the supermassive black holes in these galaxies must be spinning at close to the maximum rate. If black holes are spinning at this limit, material can be dragged around them at close to the speed of light, the speed limit from Einstein’s theory of relativity.

Atlas Image obtained of Messier 49, taken by the Two Micron All Sky Survey (2MASS). Credit: NASA/UofMass/IPAC/Caltech/NASA/NSF/2MASS

History of Observation:

According to SEDS, M49 was the first member of the Virgo cluster of galaxies to be discovered, by Charles Messier, who cataloged it on February 19th, 1771. As he recorded in his notes at the time:

“Nebula discovered near the star Rho Virginis. One cannot see it without difficulty with an ordinary telescope of 3.5-feet [FL]. The Comet of 1779 was compared by M. Messier with this nebula on April 22 and 23: The comet and the nebula had the same light. M. Messier has reported this nebula on the chart of the route of the comet, which appeared in the volume of the Academy of the same year 1779. Seen again on April 10, 1781.” Eight years later, on April 22, 1779, on the occasion of following the comet of that year, and on the hunt for finding more nebulous objects in competition to other observers, Barnabas Oriani independently rediscovered this ‘nebula’: “Very pale and looking exactly like the comet [1779 Bode, C/1779 A1].”

In his Bedford Catalogue of 1844, Admiral William H. Smyth confused this finding with Messier’s discovery:

“A bright, round, and well-defined nebula, on the Virgin’s left shoulder; exactly on the line between Delta Virginis and Beta Leonis, 8deg, or less than half-way, from the former star. With an eyepiece magnifying 93 times, there are only two telescopic stars in the field, one of which is in the sp and the other in the sf quadrant; and the nebula has a very pearly aspect. This object was discovered by Oriani in 1771 [this is wrong: it was Messier who discovered it that year; Oriani found it only in 1779], and registered by Messier as a “faint nebula, not seen without difficulty,” with a telescope of 3 1/2 feet in length. It is a pity that this active and very assiduous astronomer could not have been furnished with one of the giant telescopes of the present days. Had he possessed efficient means, there can be no doubt of the augmentation of his useful and, in its day, unique Catalogue: a collection of objects for which sidereal astronomy must ever remain indebted to him.” This error was repeated by John Herschel in his General Catalogue of 1864 (GC), who also erroneously assigned this object to “1771 Oriani,” and also found its way into J.L.E. Dreyer’s NGC.

Let’s hope you don’t mistake it with the many other galaxies nearby!

The location of Messier 49 within the Virgo constellation. Credit: IAU and Sky & Telescope magazine (Roger Sinnott & Rick Fienberg)

Locating Messier 49:

Galaxy hopping isn’t an easy chore and it takes some practice. Starting looking for M49 about halfway between Epsilon and Beta Virginis. Use Gamma to help triangulate your position. At near magnitude 8, Messier 49 is quite binocular possible and would show under dark sky conditions as a faint, very small egg shaped fog. However, it will not show in a finderscope of a telescope – but the nearby stars will.

Use their patterns to help guide you there. Because galaxies require dark skies, M49 cannot be found under urban conditions or during moonlit nights. In telescopes as small as 70mm, it will appear as a nebulous egg shape and become brighter – but no more resolved to larger instruments. To assist in location, begin with lowest magnification and increase magnification once found to darken background field.

And here are the quick facts to help you get started!

Object Name: Messier 49
Alternative Designations: M49, NGC 4472
Object Type: Elliptical Galaxy
Constellation: Virgo
Right Ascension: 12 : 29.8 (h:m)
Declination: +08 : 00 (deg:m)
Distance: 60000 (kly)
Visual Brightness: 8.4 (mag)
Apparent Dimension: 9×7.5 (arc min)

We have written many interesting articles about Messier Objects here at Universe Today. Here’s Tammy Plotner’s Introduction to the Messier Objects, , M1 – The Crab Nebula, M8 – The Lagoon Nebula, and David Dickison’s articles on the 2013 and 2014 Messier Marathons.

Be to sure to check out our complete Messier Catalog. And for more information, check out the SEDS Messier Database.

Sources:

What is the Smallest Planet in the Solar System?

MESSENGER image of Mercury from its third flyby (NASA/Johns Hopkins University Applied Physics Laboratory/Carnegie Institution of Washington)

The Solar Planets are a nice mixed bag of what is possible when it comes to planetary formation. Within the inner Solar System, you have the terrestrial planets – bodies that are composed primarily of silicate minerals and metals. And in the outer Solar System, you have the gas giants and bodies that are composed primarily of ice that lie just beyond in the Trans-Neptunian region.

Of these, the question of which planet is the smallest has been the subject of some controversy. Until recently, the smallest planet was considered to be Pluto. But with the 2006 IAU Resolution that put constraints on what the definition of a planet entails, that status has since passed to Mercury. So in addition to being the closest planet to the Sun, Mercury is also the smallest.

Size and Mass:

With a mean radius of 2440 km, Mercury is the smallest planet in our Solar System, equivalent in size to 0.38 Earths. And given that it has its experiences no flattening at the poles – like Venus, which means it is an almost perfectly spherical body – its radius is the same at the poles as it is the equator.

And while it is smaller than the largest natural satellites in our Solar System – such as Ganymede and Titan – it is more massive. At 3.3011×10²³ kg in mass (33 trillion trillion metric tons; 36.3 trillion trillion US tons), it is equivalent to 0.055 Earths in terms of mass.

Mercury and Earth, size comparison. Credit: NASA / APL (from MESSENGER)

Density, Volume:

On top of that, Mercury is significantly more dense than bodies its size. In fact, Mercury’s density (at 5.427 g/cm3) is the second highest in the Solar System, only slightly less than Earth’s (5.515 g/cm3). The result of this is a gravitational force of 3.7 m/s2, which is 0.38 times that of Earth (0.38 g). In essence, this means that if you could stand on the surface of Mercury, you would weight 38% as much as you do on Earth.

In terms of volume, Mercury once again becomes a bit diminutive, at least by Earth standards. Basically, Mercury has a volume of 6.083×10¹⁰ km³ (60 billion cubic km; 14.39 trillion cubic miles) which works out to 0.056 times the volume of the Earth. In other words, you could fit Mercury inside Earth almost twenty times over.

Structure and Composition:

Like Earth, Venus and Mars, Mercury is a terrestrial planet, meaning that is primarily composed of silicate minerals and metals that are differentiated between a metallic core and a silicate mantle and crust. But in Mercury’s case, the core is oversized compared to the other terrestrial planets, measuring some 1,800 km (approx. 1,118.5 mi) in radius, and therefore occupying 42% of the planet’s volume (compared to Earth’s 17%).

Internal structure of Mercury: 1. Crust: 100–300 km thick 2. Mantle: 600 km thick 3. Core: 1,800 km radius. Credit: MASA/JPL

Another interesting feature about Mercury’s core is the fact that it has a higher iron content than that of any other major planet in the Solar System. Several theories have been proposed to explain this, the most widely-accepted being that Mercury was once a larger planet that was struck by a planetesimal that stripped away much of the original crust and mantle, leaving behind the core as a major component.

Beyond the core is a mantle that measures 500 – 700 km (310 – 435 mi) in thickness and is composed primarily of silicate material. The outermost layer is Mercury’s crust, which is composed of silicate material that is believed to be 100 – 300 km thick.

Yes, Mercury is a pretty small customer when compared to its brothers, sisters and distant cousins in the Solar System. However, it is also one of the densest, hottest and most irradiated. So while small, no one would ever accuse this planet of not being really tough!

We have written many interesting articles on Mercury and the Solar Planets here at Universe Today. Here’s What is the Biggest Planet in the Solar System?, What is the Second Largest Planet in the Solar System?, How Does Mercury Compare to Earth?, What is the Average Surface Temperature on Mercury?, How Long is a Day on Mercury?, and The Orbit of Mercury, How Long is a Year on Mercury?,

And here’s another take on the smallest planet in the Solar System, and here’s a link to NASA’s Solar System Exploration Guide.

We have recorded a whole series of podcasts about the Solar System at Astronomy Cast.

Sources:

Amazing New Views of Betelgeuse Courtesy of ALMA

This orange blob shows the nearby star Betelgeuse, as seen by the Atacama Large Millimeter/submillimeter Array (ALMA). ALMA/ESO/NRAO
This orange blob is the nearby star Betelgeuse, as imaged recently by the Atacama Large Millimeter/submillimeter Array (ALMA). ALMA/ESO/NRAO

Just. Wow.

An angry monster lurks in the shoulder of the Hunter. We’re talking about the red giant star Betelgeuse, also known as Alpha Orionis in the constellation Orion. Recently, the Atacama Large Millimeter Array (ALMA) gave us an amazing view of Betelgeuse, one of the very few stars that is large enough to be resolved as anything more than a point of light.

Located 650 light years distant, Betelgeuse is destined to live fast, and die young. The star is only eight million years old – young as stars go. Consider, for instance, our own Sun, which has been shining as a Main Sequence star for more than 500 times longer at 4.6 billion years – and already, the star is destined to go supernova at anytime in the next few thousand years or so, again, in a cosmic blink of an eye.

Still lumpy… Betelgeuse imaged by Hubble in 1996. Hubble/ESA/STScI

An estimated 12 times as massive as Sol, Betelgeuse is perhaps a staggering 6 AU or half a billion miles in diameter; plop it down in the center of our solar system, and the star might extend out past the orbit of Jupiter.

As with many astronomical images, the wow factor comes from knowing just what you’re seeing. The orange blob in the image is the hot roiling chromosphere of Betelgeuse, as viewed via ALMA at sub-millimeter wavelengths. Though massive, the star only appears 50 milliarcseconds across as seen from the Earth. To give you some idea just how small a milliarcsecond is, there’s a thousand of them in an arc second, and 60 arc seconds in an arc minute. The average Full Moon is 30 arc minutes across, or 1.8 million milliarcseconds in apparent diameter. Betelgeuse has one of the largest apparent diameters of any star in our night sky, exceeded only by R Doradus at 57 milliarcseconds.

The apparent diameter of Betelgeuse was first measured by Albert Michelson using the Mount Wilson 100-inch in 1920, who obtained an initial value of 240 million miles in diameter, about half the present accepted value, not a bad first attempt.

You can see hints of an asymmetrical bubble roiling across the surface of Betelgeuse in the ALMA image. Betelgeuse rotates once every 8.4 years. What’s going on under that uneasy surface? Infrared surveys show that the star is enveloped in an enormous bow-shock, a powder-keg of a star that will one day provide the Earth with an amazing light show.

The bowshock created by Betelgeuse as it plows through the local interstellar medium. JAXA/Akari

Thankfully, Betelgeuse is well out of the supernova “kill zone” of 25 to 100 light years (depending on the study). Along with Spica at 250 light years distant in the constellation Virgo, both are prime nearby supernovae candidates that will on day give astronomers a chance to study the anatomy of a supernova explosion up close. Riding high to the south in the northern hemisphere nighttime sky in the wintertime, +0.5 magnitude Betelgeuse would most likely flare up to negative magnitudes and would easily be visible in the daytime if it popped off in the Spring or Fall. This time of year in June would be the worst, as Alpha Orionis only lies 15 degrees from the Sun!

An early springtime supernova in the future? Stellarium

Of course, this cosmic spectacle could kick off tomorrow… or thousands of years from now. Maybe, the light of Betelgeuse gone supernova is already on its way now, traversing the 650 light years of open space. Ironically, the last naked eye supernova in our galaxy – Kepler’s Star in the constellation Ophiuchus in 1604 – kicked off just before Galileo first turned his crude telescope towards the heavens in 1610.

You could say we’re due.

What Caused the Kuiper Belt to Get Warped?

A planetary mass object the size of Mars would be sufficient to produce the observed perturbations in the distant Kuiper Belt. (Image: Heather Roper/LPL)

Astronomers have known about the Kuiper Belt for decades, and were postulating about its existence long before it was even observed. Since that time, many discoveries have been made in this region of space – ranging from numerous minor planets to the fact that the orbital planes of Kuiper Belt Objects (KBOs) are widely dispersed – that have led to new theoretical models of the formation and evolution of the Solar System.

For instance, while conducting measurements of the mean plane of minor planets and KBOs, a team from the Lunar and Planetary Laboratory (LPL) at The University of Arizona discovered a warp in orbits of certain, highly-distant KBOs.  According to their study, this warp could be an indication of a planetary-mass object in the area, one which orbits our Sun even closer than the theoretical “Planet 9“.

The study – “The Curiously Warped Mean Plane of the Kuiper Belt” which is scheduled to be published in the Astronomical Journal – was produced by Kathryn Volk and Renu Malhotra (two astronomers with the LPL). As they stated in their study, the presence of this planet was confirmed by examining the orbits of icy bodies in the very outer reaches of the Solar System.

Artist’s impression of the yet-to-be-discovered “planetary mass object”, who’s existence has been theorized based on the orbital plane of distant Kuiper Belt objects. Credit: Heather Roper/LPL

Whereas most KBOs – which are leftover material from the formation of the Solar System – orbit the Sun close to the mean plane of the Solar System itself, the most distant objects do not. To determine why, the researchers analyzed the tilt angles of the orbital planes of more than 600 KBOs to determine the direction of their precession – i.e. the direction in which these rotating objects experience a change in their orientation.

As Malhotra – a Louise Foucar Marshall Science Research Professor and Regents’ Professor of Planetary Sciences at LPL – illustrated, KBOs operate in a way that is analogous to spinning tops:

“Imagine you have lots and lots of fast-spinning tops, and you give each one a slight nudge. If you then take a snapshot of them, you will find that their spin axes will be at different orientations, but on average, they will be pointing to the local gravitational field of Earth… We expect each of the KBOs’ orbital tilt angle to be at a different orientation, but on average, they will be pointing perpendicular to the plane determined by the Sun and the big planets.”

What they found was that the average plane of these objects was tilted away from the solar plane by about eight degrees, which suggests that a powerful gravitational force in the outer Solar System is tugging on them. “The most likely explanation for our results is that there is some unseen mass,” said Volk in UA News press release. “According to our calculations, something as massive as Mars would be needed to cause the warp that we measured.”

Animated diagram showing the spacing of the Solar Systems planet’s, the unusually closely spaced orbits of six of the most distant KBOs, and the possible “Planet 9”. Credit: Caltech/nagualdesign

According to their calculations, this Mars-size body would likely orbit the Sun at a distance of roughly 60 AU, and with an orbital inclination that was tilted eight degrees to the average plane of the known planets (i.e. the same tilt as the “warped” KBOs). Within these parameters, a planet of this size would have sufficient gravitational influence to warp the orbital plane of the distant KBOs to within 10 AU on either side of it.

In other words, a Mars-sized planet in the outer Kuiper Belt would be able to influence the orbital inclination of KBOs that are between 50 and 70 AUs from the Sun. This is certainly consistent with what we know about the Kuiper Belt, who’s orbital inclination appears to be consistently flat (i.e. consistent with the rest of the Solar System) past a distance of about 50 AU – but changes between a distance of 50 and 80 AU.

As Volk indicated, there is a possibility that this warping could be the result of a statistical fluke. But in the end, their calculations indicated that this is highly unlikely, and that the behavior of distant KBOs is consistent with the existence of a as-yet-unseen gravitational influence:

“But going further out from 50 to 80 AU, we found that the average plane actually warps away from the invariable plane. There is a range of uncertainties for the measured warp, but there is not more than 1 or 2 percent chance that this warp is merely a statistical fluke of the limited observational sample of KBOs… The observed distant KBOs are concentrated in a ring about 30 AU wide and would feel the gravity of such a planetary mass object over time, so hypothesizing one planetary mass to cause the observed warp is not unreasonable across that distance.”  

Artist's impression of Planet Nine, blocking out the Milky Way. The Sun is in the distance, with the orbit of Neptune shown as a ring. Credit: ESO/Tomruen/nagualdesign
Artist’s impression of Planet Nine, blocking out the Milky Way. The Sun is in the distance, with the orbit of Neptune shown as a ring. Credit: ESO/Tomruen/nagualdesign

Another possibility is that another object entirely could have disturbed the plane of the outer Kuiper Belt – for instance, a star passing through the outer Solar System. But as Malhotra explained, this explanation is also a highly unlikely, as any disturbance caused by a passing star would only be temporary and would have manifested itself differently.

“A passing star would draw all the ‘spinning tops’ in one direction,” he said. “Once the star is gone, all the KBOs will go back to precessing around their previous plane. That would have required an extremely close passage at about 100 AU, and the warp would be erased within 10 million years, so we don’t consider this a likely scenario.”

Moreover, the tilt of these objects could not be attributed to the existence of Planet 9, who’s existence has also been suggested based on the extreme eccentricity of certain populations of KBOs. Compared to this Mars-sized planet that is thought to orbit at 60 AUs from the Sun, Planet 9 is predicted to be much more massive (at around 10 Earth masses) and is believed to orbit at a distance of 500 to 700 AU.

Naturally, one has to ask why this planetary-mass body has not been found yet. According to Volk and Malhotra, the reason has to do with the fact that astronomers have not yet searched the entire sky for distant for Solar System objects. Beyond that, there’s also the likely position of the object (within the galactic plane), which is so densely packed with stars that surveys would have a hard time spotting it.

However, with the construction of instruments like the Large Synoptic Survey Telescope (LSST) in Chile nearly complete, opportunities to spot it may be coming sooner other than later. This wide-field survey reflecting telescope, which is run by a consortium that includes the University of Arizona, is expected to provide some of the deepest and widest views of the Universe to date (which will begin in 2020).

In the meantime, and in response to any possible controversies regarding the so-called “Planet Debate”, it is worth noting that this body (if it exists) is currently being referred to as “planetary-mass object”. This is because, by definition, a body needs to have cleared its orbit in order to be called a planet. What’s more, the study does not rule out the possibility that the warp could be the result of more than one planetary mass object in the area.

Therefore, it would premature to state that astronomers – having not yet even confirmed the existence of Planet 9 – are now talking about the existence of a possible “Planet 10”. In the coming years, more news and information will become available, which will hopefully help us put the debate to rest and agree on just how many planets there are out there!

Further Reading: UA News, Earth and Planetary Astrophysics