Welcome back to Messier Monday! We continue our tribute to our dear friend, Tammy Plotner, by looking at the open star cluster of Messier 52. Enjoy!
In the 18th century, while searching the night sky for comets, French astronomer Charles Messier kept noting the presence of fixed, diffuse objects in the night sky. In time, he would come to compile a list of approximately 100 of these objects, with the purpose of making sure that astronomers did not mistake them for comets. However, this list – known as the Messier Catalog – would go on to serve a more important function.
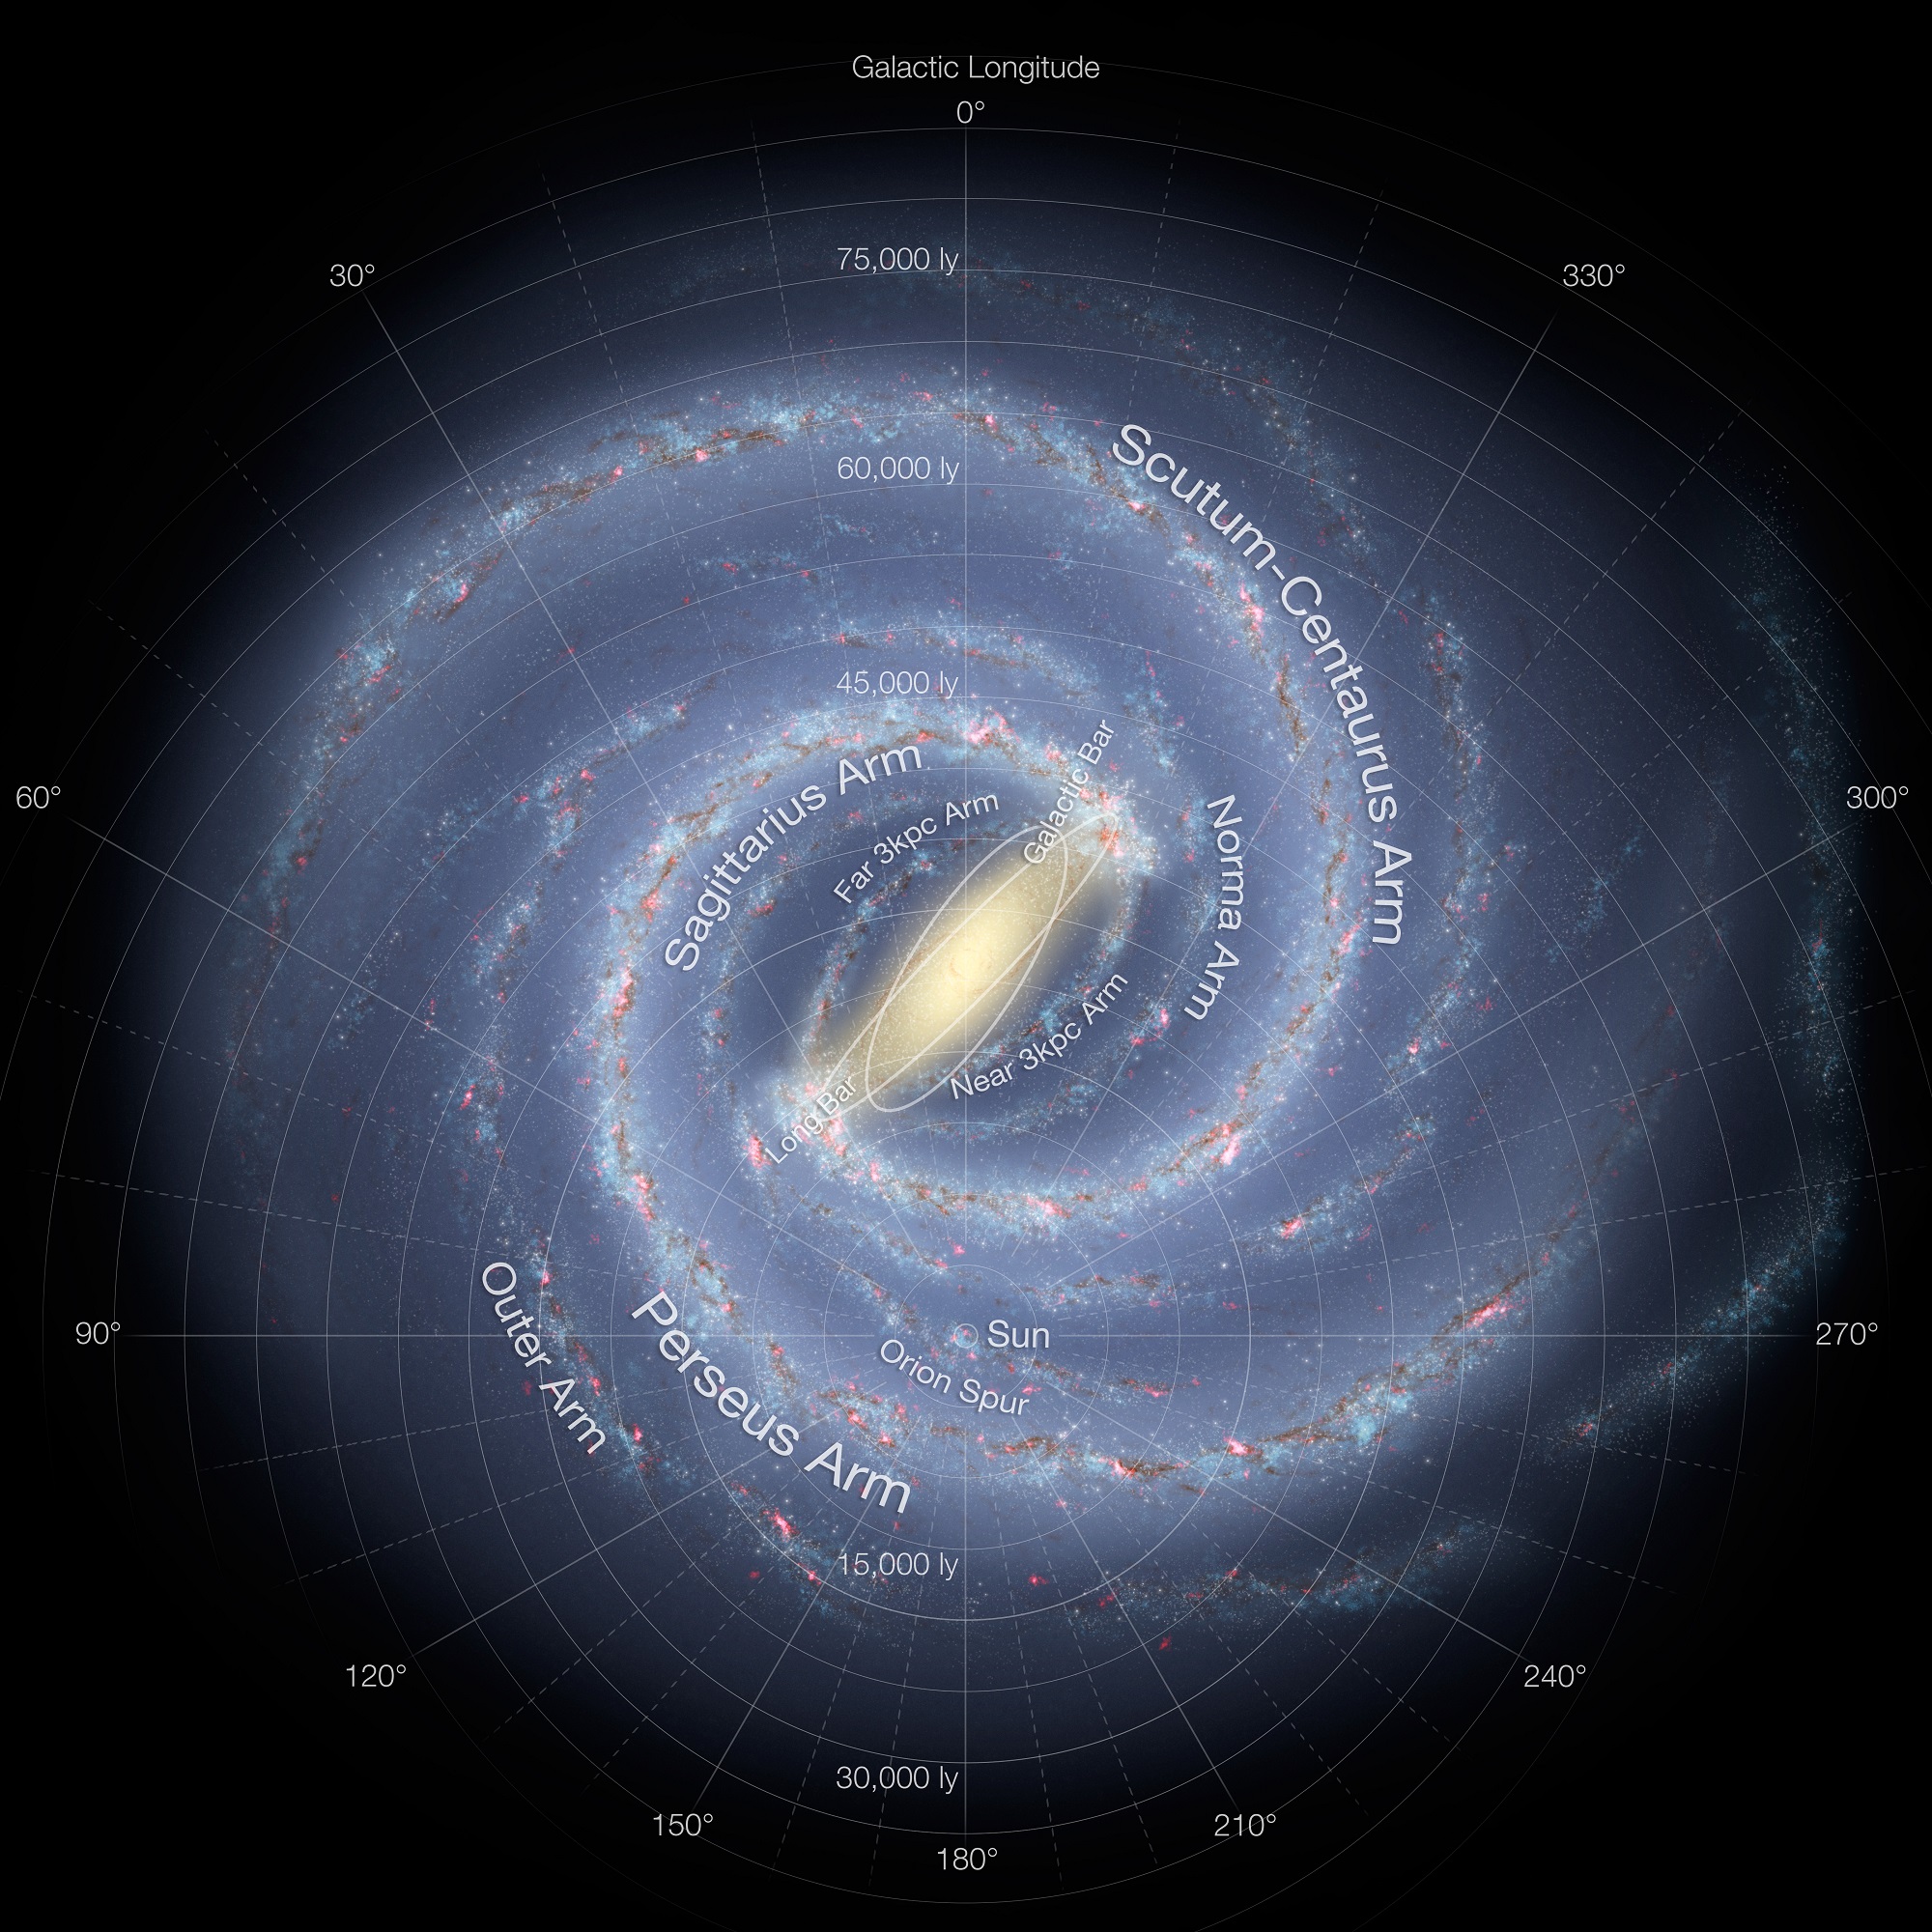
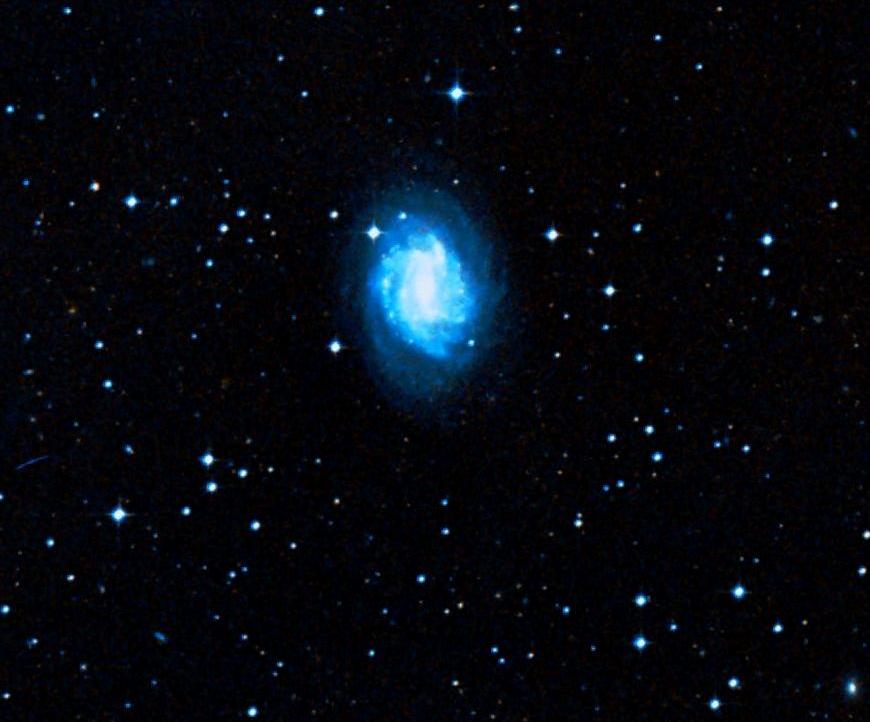
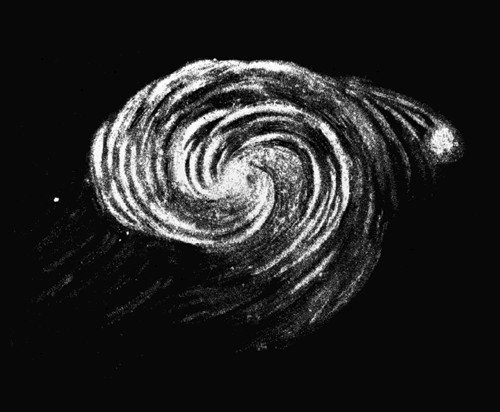
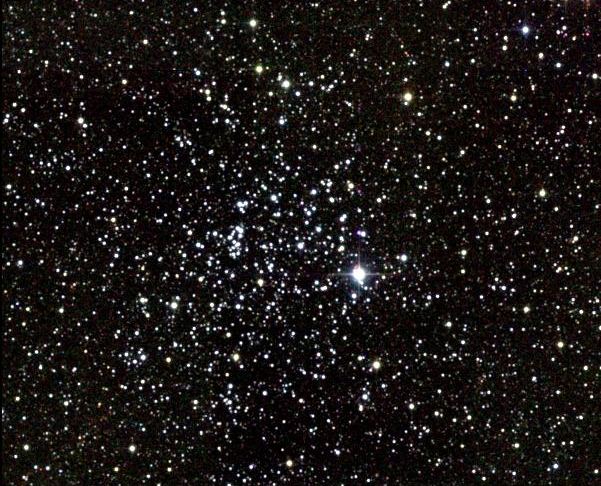
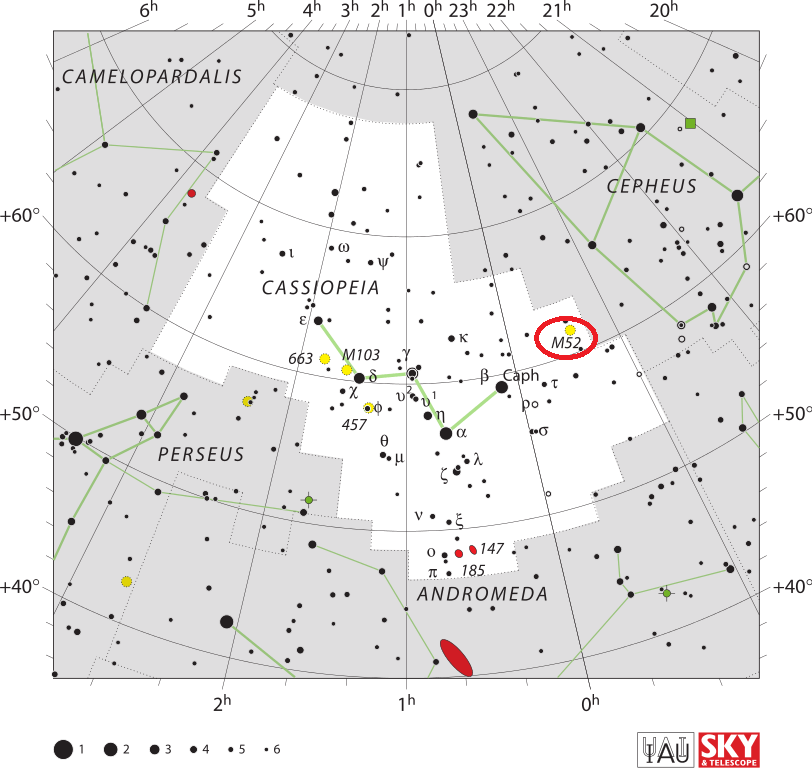
One of these objects is Messier 52, an open star cluster that can seen in proximity to the northern constellation Cassiopeia. Located about 5000 light years from Earth, this star cluster is easily spotted in the night sky because of its association with Cassiopeia’s familiar W-shape. It can viewed with binocular and telescopes, and will appears as a hazy, nebulous patch of light.
Description:
Located roughly 5000 light years away, this 35 million year old cluster of stars has around 200 members – one of which is a very peculiar Of star. According to A.K. Pandy (et al), M52 is an interesting cluster in which to study star formation history. As they stated in their 2001 study:
“The colour magnitude diagrams show a large age spread in the ages. Star formation was biased towards relatively higher masses during the early phase of star formation whereas most of the low mass stars of the cluster were formed during the later phase. The star formation seems to have been a gradual process that proceeded sequentially in mass and terminated with the formation of most massive stars.”

Indeed, M52 has been very studied for its star structure, including a search for variables. As S.L. Kim (et al), wrote in a 2000 study:
“We have performed a long-term project of CCD photometry of open clusters. Its primary goal is to search for variable stars, in particular short-period (less than a few days) pulsating stars such as Delta Sct, Gamma Dor, and slowly pulsating B-type stars (SPBs). These pulsating stars are recognized as important objects in studying stellar structure and testing evolution theory of intermediate-mass main sequence stars. Thus these clusters are ideal targets to investigate whether Gamma Dor type variability occurs in old open clusters or not.”
And it’s not just the structure they’re looking at – but the time frame in which they formed. As Anil K. Pandey wrote in her 2001 study:
“The distribution of stars in NGC 7654 indicates that the star formation within the cluster is not coeval and has an age spread -50 Myr. We found that star formation took place sequentially in the sense that low mass stars formed first. The star formation history in NGC 7654 supports the conventional picture of star formation in cluster where ‘low mass stars’ form first and star formation continues over a long period of time. The star formation within the cluster terminates with the formation of most massive stars in the cluster.”
History of Observation:
M52 was an original discovery of Charles Messier, captured on the night of September 7th, 1774. As he wrote in his notes at the time:
“Cluster of very small stars, mingled with nebulosity, which can be seen only with an achromatic telescope. It was when he observed the Comet which appeared in this year that M. Messier saw this cluster, which was close to the comet on the 7th of September 1774; it is below the star d Cassiopeiae: that star was used to determine both the cluster of stars and the comet.”
Sir William Herschel would also observe M52, but he would keep his notes private. As he wrote on August 29th, 1873:
“All resolved into innumerable small stars without any suspicion of nebulosity. 7 ft., 57. In the sweeper, 30, shews nebulosity, the stars being too obscure to be distinguished with its light tho’ considerable.” and again on December 23, 1805: “Review. Large 10 feet. This is a cluster of pretty condensed stars of different sizes. It is situated in a very rich part of the heavens and can hardly be called insulated, it may only be a very condensed part of the Milky Way which is here much divided and scattered. It is however so far drawn together with some accumulation that it may be called a cluster of the third order.”
Herschel’s son John would also add it to the General Catalog a few years later with less descriptive narrative, but it was Admiral Smyth who described M52’s beauty best when he said:
“An irregular cluster of stars between the head of Cepheus and his daughter’s throne; it lies north-west-by-west of Beta Cassiopeiae, and one third of the way towards Alpha Cephei. This object assumes somewhat of a triangular form, with an orange-tinted 8th-mag star at its vertex, giving it the resemblance of a bird with outspread wings. It is preceded by two stars of 7th and 8th magnitudes, and followed by another of similar brightness; and the field is one of singular beauty under a moderate magnifying power. While these were under examination, one of those bodies called falling stars passed through the outliers. This phenomenon was so unexpected and sudden as to preclude attention to it; but it appeared to be followed by a train of glittering and very minute spangles.”
May it glitter and spangle for you!
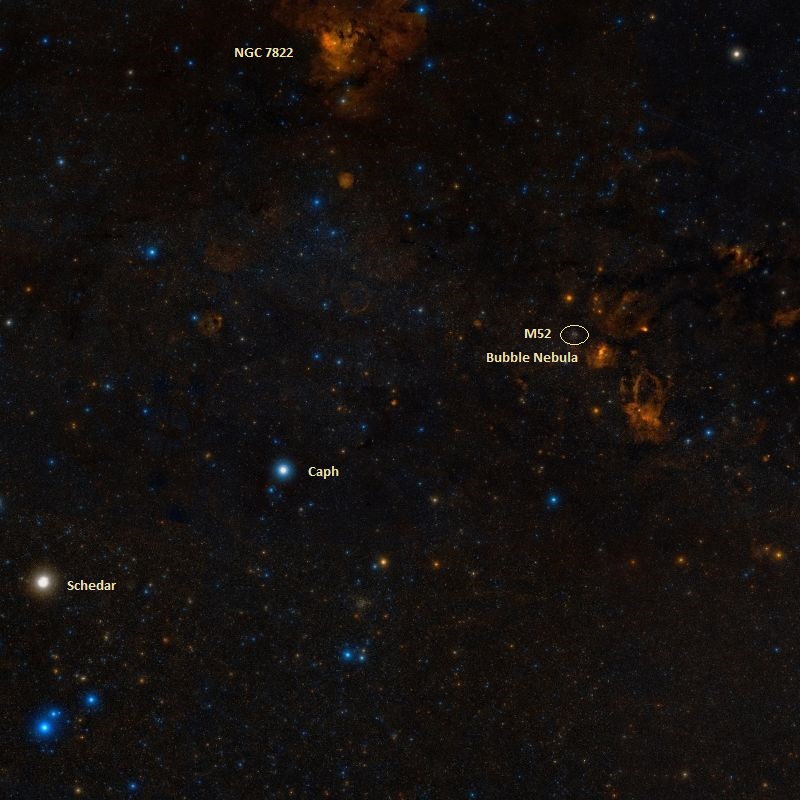
Locating Messier 52:
In the rich star cluster fields of Cassiopeia, M52 is distinctive for its size and brightness. It’s not hard to find! Begin by identifying the W-shape of Cassiopeia and focus on its two brightest stars – Alpha and Beta. Because this constellation is circumpolar, remembering to look at the side that has the brightest stars or the steepest angle, will help you remember how to find this great open cluster. Now, just draw a mental line between Alpha, the lower star, and Beta, the upper.
Extend that line into space about the same distance and aim your binoculars or finderscope there. In binoculars M52 will show clearly as a beginning to resolve star cloud and a hazy patch in a telescope finderscope. Even the smallest of telescopes can expect resolution from this multi-magnitude beauty and the more aperture you apply, the more stars you will see. M52 is well suited to urban or light polluted skies and stands up well to fairly moonlit conditions and hazy skies.
Object Name: Messier 52
Alternative Designations: M52, NGC 7654
Object Type: Open Galactic Star Cluster
Constellation: Cassiopeia
Right Ascension: 23 : 24.2 (h:m)
Declination: +61 : 35 (deg:m)
Distance: 5.0 (kly)
Visual Brightness: 7.3 (mag)
Apparent Dimension: 13.0 (arc min)
We have written many interesting articles about Messier Objects here at Universe Today. Here’s Tammy Plotner’s Introduction to the Messier Objects, M1 – The Crab Nebula, and David Dickison’s articles on the 2013 and 2014 Messier Marathons.
Be to sure to check out our complete Messier Catalog. And for more information, check out the SEDS Messier Database.
Sources: