On July 14th, 2015, the New Horizons mission made history when it became the first spacecraft to conduct a flyby of Pluto and its moons. In the course of making its way through this system, the probe gathered volumes of data on Pluto and its many satellites using a sophisticated suite of instruments. These included the first detailed images of what Pluto and its largest moon (Charon) look like up close.
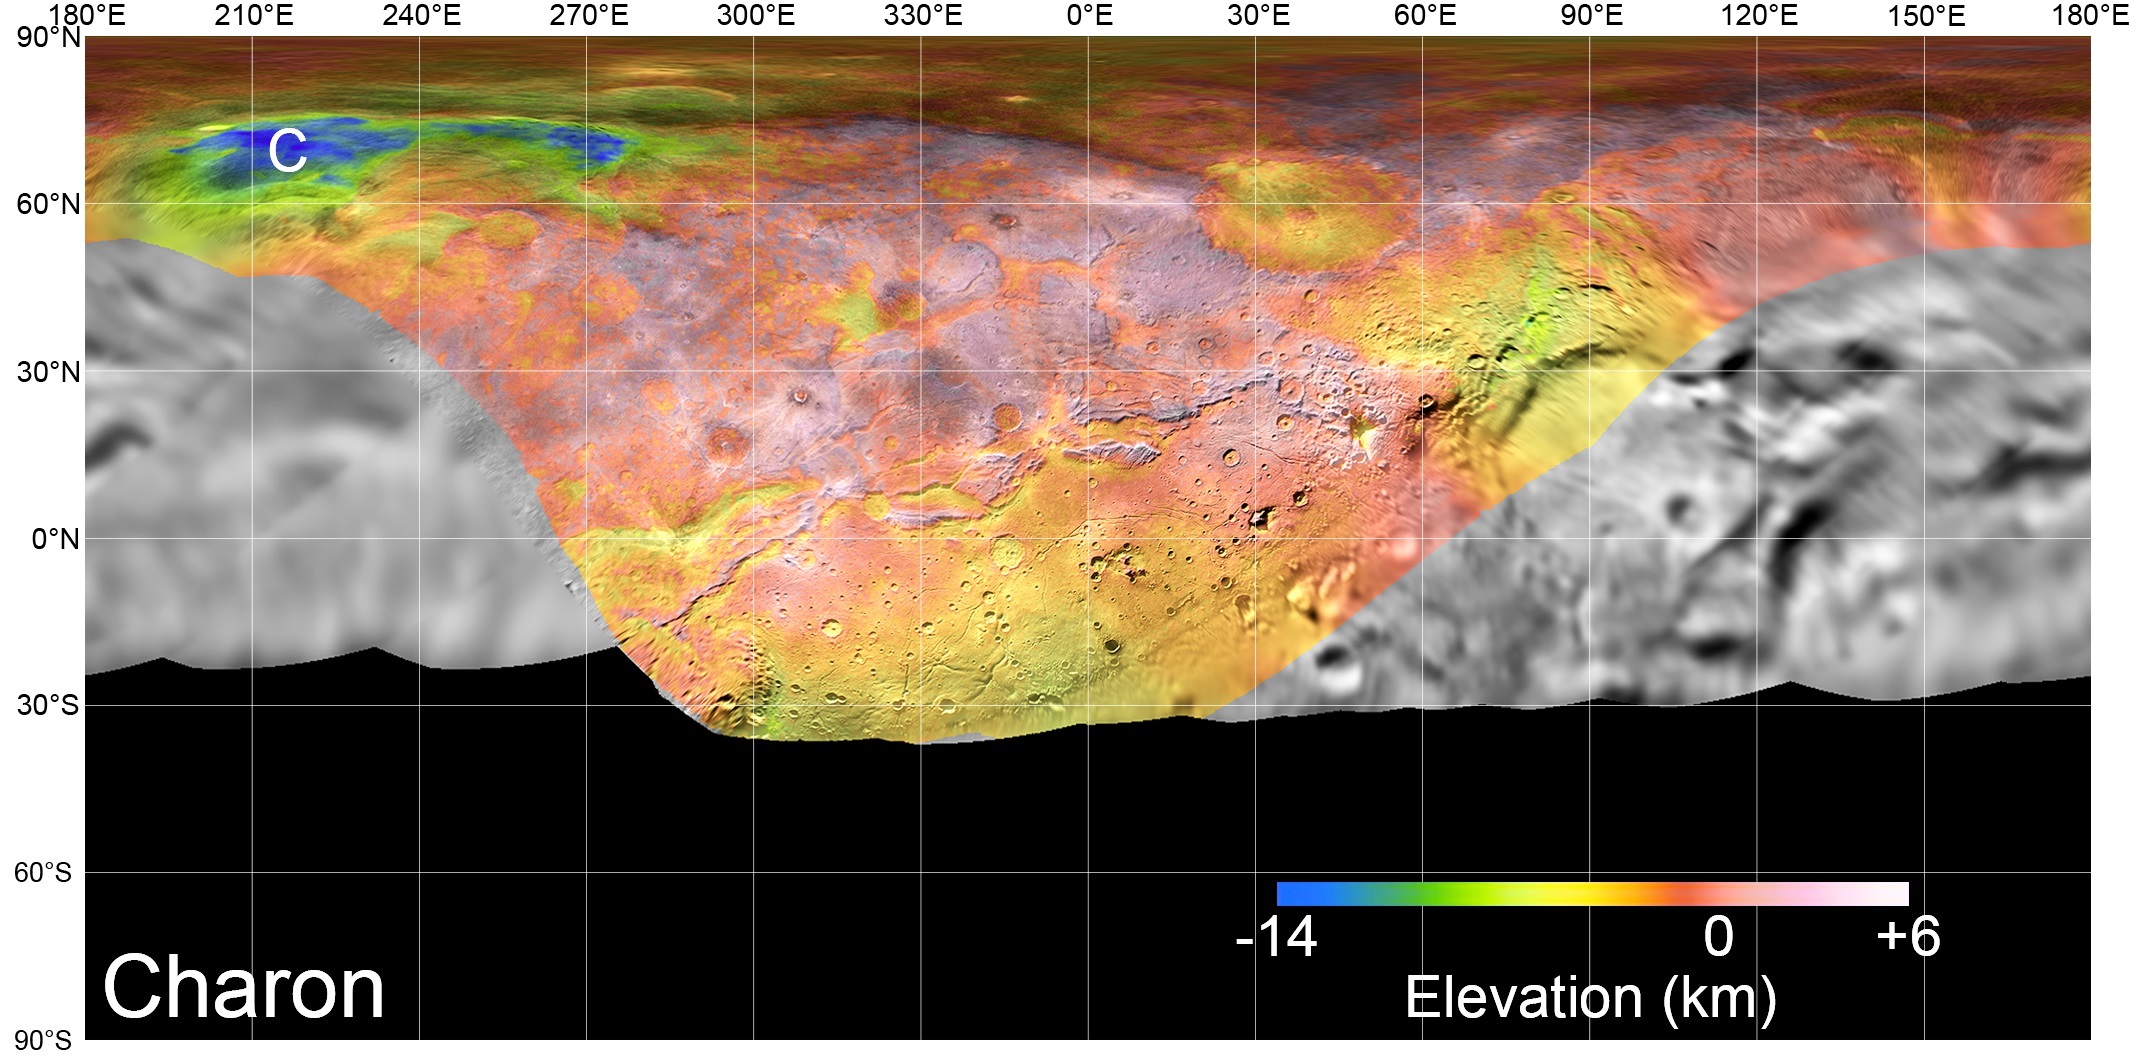
And while scientists are still analyzing the volumes of data that the probe has sent home (and probably will be for years to come), the New Horizons mission team has given us plenty of discoveries to mull over in the meantime. For instance, using the many images taken by the mission, they recently created a series of high-quality, highly-detailed global maps of Pluto and Charon.
The maps were created thanks to the plethora of images that were taken by New Horizons’ Long-Range Reconnaissance Imager (LORRI) and its Multispectral Visible Imaging Camera (MVIC). Whereas LORRI is a telescopic camera that was responsible for obtaining encounter and high-resolution geologic data of Pluto at long distances, the MVIC is an optical and infrared instrument that is part of the Ralph instrument – the main imaging device of the probe.

The Principal Investigator (PI) for the LORRI instrument is Andy Cheng, and it is operated from Johns Hopkins University Applied Physics Laboratory (JHUAPL) in Laurel, Maryland. Alan Stern is the PI for the MVIC and Ralph instruments, which are operated from the Southwest Research Institute (SwRI) in San Antonio, Texas. And as you can plainly see, the maps are quite detailed and eye-popping!
Dr. Stern, who is also the PI of the New Horizons mission, commented on the release of the maps in a recent NASA press statement. As he stated, they are just the latest example of what the New Horizons mission accomplished during its historic mission:
“The complexity of the Pluto system — from its geology to its satellite system to its atmosphere— has been beyond our wildest imagination. Everywhere we turn are new mysteries. These new maps from the landmark exploration of Pluto by NASA’s New Horizons mission in 2015 will help unravel these mysteries and are for everyone to enjoy.”
And these were not the only treats to come from the New Horizons team in recent days. In addition, the mission scientists used actual New Horizons data and digital elevation models to create flyover movies that show what it would be like to pass over Pluto and Charon. These videos offer a new perspective on the system and showcase the many unusual features that were discovered on both bodies.
The video of the Pluto flyover (shown above) begins over the highlands that are located to the southwest of Sputnik Planitia – the nitrogen ice basin that measures some 1,050 by 800 km (650 by 500 mi) in size. These plains constitute the western lobe of the feature known as Tombaugh Regio, the heart-shaped region that is named after the man who discovered Pluto in 1930 – Clyde Tombaugh.
The flyover also passes by cratered terrain of Cthulhu Macula before moving north past the highlands of Voyager Terra. It then turns south towards the pitted region known as Pioneer Terra before concluding over Tartarus Dorsa, a mountainous region that also contains bowl-shaped ice and snow features called penitentes (which are found on Earth and are formed by erosion).
The flyover video of Charon begins over the hemisphere that the New Horizons mission saw during its closest approach to the moon. The view then descends over Serenity Chasma, the wide and deep canyon that is named after the ship from the sci-fi series Firefly. This feature is part of the vast equatorial belt of chasms on Charon, which is one of the longest in the Solar System – 1,800 km (1,100 mi) long 7.5 km (4.5 mi) deep.
The view then moves north, passing over the Dorothy Gale crater and the dark polar region known as Mordor Macula (appropriately named after the domain of the Dark Lord Sauron in The Lord of the Rings). The video then turn south to fly over the northern terrain known as Oz Terra before finishing over the equatorial plans of Vulcan Planum and the mountain of Clarke Montes.
These videos were color-enhanced in order to bring out the surface details, and the topographic relief was exaggerated by a factor or two to three to emphasize the topography of Pluto and its largest moon. Digital mapping and rendering of these videos was performed by Paul Schenk and John Blackwell of the Lunar and Planetary Institute (LPI) in Houston.
It may be many years before another mission is able to travel to the Trans-Neptunian region and Kuiper Belt. As a result, the maps and videos and images that were taken by the New Horizons mission may the last glimpse some us get of the Pluto system. Luckily, the New Horizons mission has provided scientists and the general public with enough information to keep them busy and fascinated for years!
Further Reading: NASA